The model describes the relationship between monovalent and multivalent binding steps (Thesis 1.1), presents ordinary differential equations (ODEs) in a matrix form (Thesis 1.2), describes the ways to correct for mass transfer limitation (Thesis 1.3), and presents the output of the model in line with experiments (Thesis 1.4). This part also presents how the binding probabilities can be expressed using the integral of the product of two probability density functions (PDF) (Thesis 2.3) and provides ways to approximate the required PDFs (Thesis 2.4).
Summary of Challenges
Changing binding properties is also one of the most excellent tools of natural evolution, and it has two main branches; random mutations affecting protein structure, hence binding sites, or multiplying existing structures. These repeating protein structures have drastically different binding characteristics and the bonding between two molecules with repeating structures is called multivalent binding.
Problem Domains and Personal Contributions
Protein Binding Research
- Significance of Protein Binding
- Protein engineering
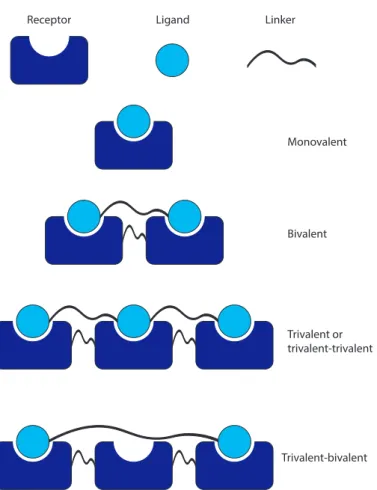
- Multivalent Proteins
- Multivalent models
This is the mechanism of monoclonal antibody therapy, which represents 6 of the 15 best-selling drugs in the United States [3]. In the context of multivalent reactions, we use the term avidity for the strength of the multivalent bond, while affinity for monovalent bond.
Modelling Protein Binding
Protein Binding-kinetics
The overall order of a reaction is the sum of the exponents, so if a and b are both one, the reaction order is second order. In this reaction, the order of association is second order and the dissociation is "pseudo-first" order (first order reaction in the case of complex molecules) because it depends only on the concentration of the complex.
Binding of Ligands and Inhibitors
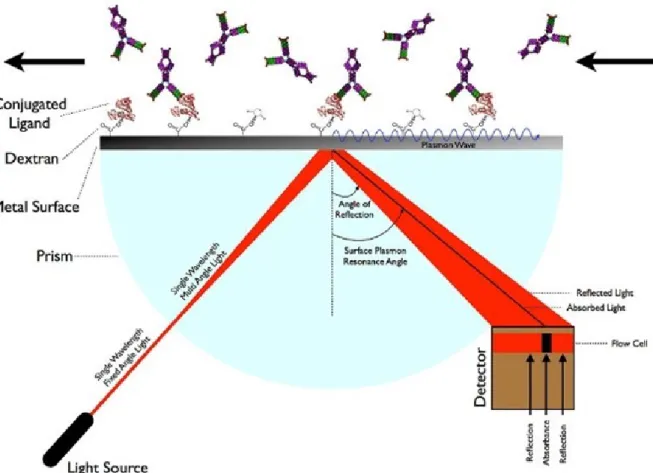
Binding Kinetics Measurements
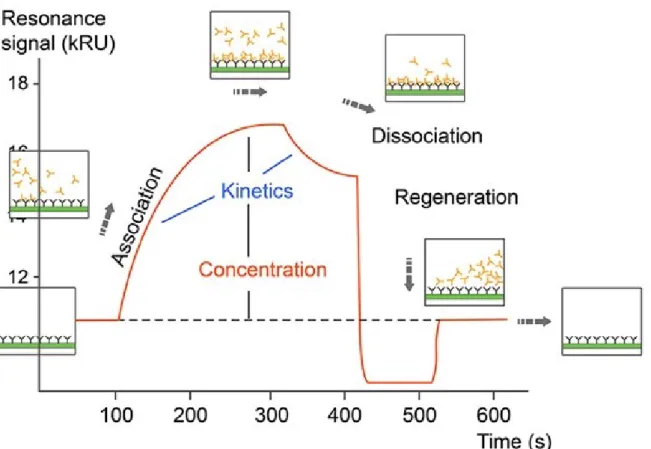
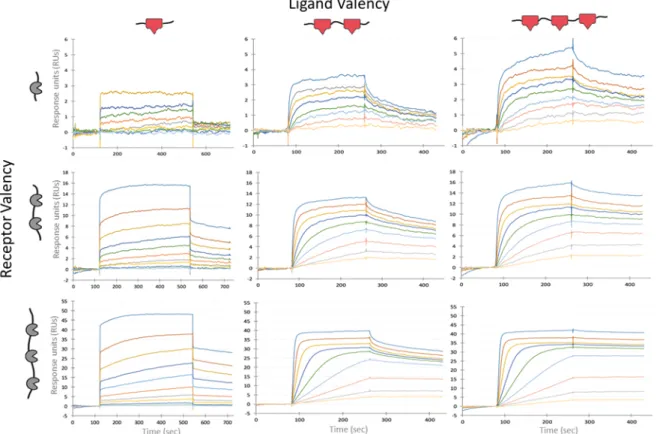
The informative part of the sensorgram has two phases, the association phase and the dissociation phase. The y-axis values are in RU (response unit), which is proportional to the mass of analyte on the surface of the chip.

Receptor-ligand binding kinetics
Multiple and multivalent binding-kinetics
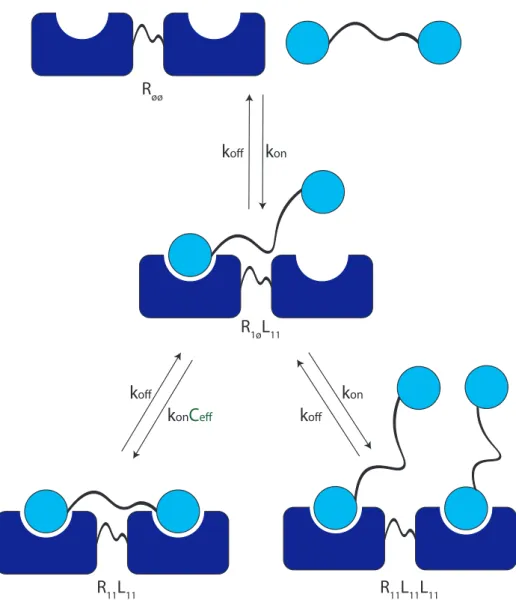
In the case of multiple binding, the events are independent and depend only on the receptor and ligand concentrations and the reaction rate constants; on the other hand, the multivalent binding event is described by an effective concentration of Cef instead of the ligand concentration together with the reaction rate constants. The reactions between different states in the multiple and multivalent bond are presented in equation 2.5.

Multivalent reaction-speed and rate-constants
Reaction order in multivalent binding
Due to the nature of this binding step, which depends only on the intrinsic forces of the partially bound complex - in this case a is 1-, it is a pseudo-first-order reaction. Furthermore, the association rates for the elementary reactions are second order, with a reaction constant equal to the monovalent on-rate constant, given that Assumptions 1 and 2 hold.
Rate-constants generalised notation
To summarize the reaction rates of the elementary steps, all the various dissociation reaction rates are pseudo-first order and based on reasonable assumptions, equal to the monovalent dissociation rates. Truly multivalent binding is a pseudo-first-order reaction which can be viewed as a second-order reaction with an approximate effective ligand concentration.
Binding-kinetics equations in matrix form
Model framework for higher valencies
State identification
Therefore, the system can be described by a receptor valence log list containing the IDs of the ligand-binding units. In addition, due to the asymmetric position of the binding points of the linker, there is a favorable and a less favorable divalent bound state.

Identifying possible state transitions
Model Output Alignment to Common Experimental Setup
Modeling Experiments on Surface Plasmon Resonance
RUmax is calculated by equation 2.11 shown below, where MW stands for the molecular weights of the receptor and ligand molecules; SM stands for the molar stoichiometry, and theRUReceptormax stands for the amount of coated receptors in RUs. The mass can also be easily converted to concentration by knowing the volume and the molecular weight of the ligand, similar to equation 2.12.
Mass Transfer limitation
Furthermore, according to conventional state space notation, y(t) = C(t)x(t)(Equation 2.10),x(t) is the state concentration vector.
Properties of the Model
Monovalent case
The "multivalent" equilibrium dissociation constant using the general form gives the familiar result where:KDmv = Px(t)n 0[L].
Bivalent case
The bivalent equilibrium dissociation constant can be determined in three ways; (1) from the equilibrium proportion of free receptors to all other states or (2) from the proportion of all other states to the bivalent state(s) or (3) from the ratio of free receptor to receptor units occupied units. Suppose the effective concentration is much greater than KDmv, then KDmv changes proportionally in the opposite direction of the effective concentration.
Higher valencies
Multivalent Reaction Describing Constants
Dissociation Constant
A good example to demonstrate how our intuitive understanding of the KD involves choosing one of the definitions is to compare the bivalent and bivalent-monovalent bond. In summary, firstly, we can conclude that the mechanism of the measurement must define the type of multivalentKD definition; secondly, if the ligand concentration is much lower than the KD or the Cef f then we get back the familiar form: KDbi−bi=KD2K2KD.
Reaction Rate-Constants
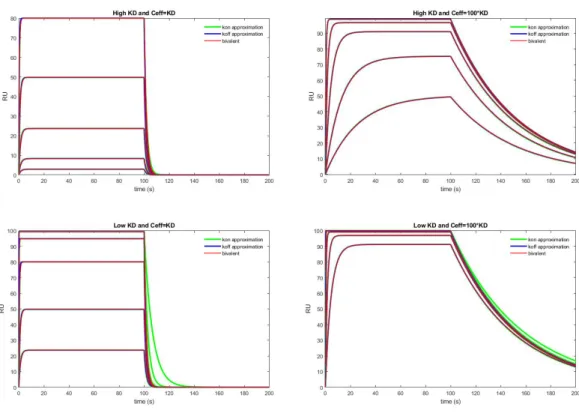
Of course, with nonzero ligand concentration and in the initial phase of the dissociation, this approximation may misbehave. This approach is based on the rate of decrease in the empty receptor states if all the receptors are empty.
Summary and Publications
To model experimental data of multivalent binding kinetics, the model output can be represented in the form of experimental output using the transformation they(t) =Cx(t), where parameter choices for the output matrix C are presented in general and for SPR experiments. The multivalent rate constant can be approximated by its monovalent counterpart if the linker does not induce binding strain.
Definition of Effective Concentration
Receptor and Ligand Probability Density Functions
Dynamical information can be derived from electron tomography, but its primary source is dynamical simulations or fluorescence resonance energy transfer (FRET). FRET is based on the distance-sensitive energy transfer between two fluorescent dyes, resulting in light intensity data related to the distance between the two dyes.
Defining Probability Density Function
Linker PDF
The equation describing a generally accepted end-to-end ligand distance PDF [56] is given in equaiotn 3.10 where the two parameters are the Lccouture length and the high stability length. 3.10) The source only gives the PDF for the distance r, but using the spherically symmetric nature of the PDF connector; we can translate the equation into x,y,z coordinates by replacing r with the Euclidean distance of the two edges and correcting for the 1D to 3D conversion by dividing the original equation by 4πr2.
Receptor and Ligand Unit PDF
Convolution of the two PDFs
We can also use l the maximum length off (maximum distance between p0 and p1) due to convolution is 0 outside this range.
Convolution with PDFs Describing Molecule Components
Iterative Expansion of PDFs
Then (step 3), we can use this fitted unit-ligand function and take its convolution with another unit, resulting in a unit-ligand PDF. After that, we can (step 4) use this unit-ligand-unit fitted function and take its convolution with another linker, resulting in a unit-ligand-unit-linker-PDF.
Effective Concentration with Predicted PDFs
We can define an iterative process to generate any molecule composed of units and the linkers that connect them. First, we can start with the convolution (step 1) of the first unit and the first linker.
Technical Details for Numerical Integration
Integral Bounds
Flipping the origin
By substituting the correct receptor and ligand PDFs described in Equation 3.20, we can calculate the effective concentration of any multivalent binding event, where the origin is set to the already bound ligand and receptor binding sites, and the new binding occurs between then the receptor and mth ligand units.
Shift
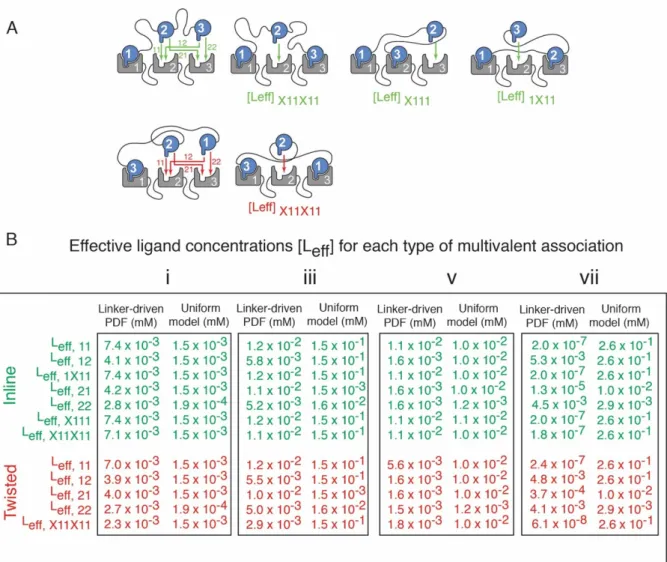
Different Effective Concentrations within Multivalent binding
Effective Concentration Notation
Therefore, if the distance of the ligand or receptor units is stable (which is the most likely scenario due to repetitive DNA segments in biology) it can be generalized. To get the link type, we can subtract the position of the new link from the position of the already linked unit.
Comparing Effective concentration Models
We categorize effective concentrations based on the position of the multivalent bond; if two neighboring partners participate in binding to the receptor, then we can talk about the type binding. Furthermore, starting from the trivalent-trivalent bond, there are cases when both neighbors of the unit are already bonded, and this forces the position of the middle unit.
Summary and Future Work
Parameter inputs
The MVsim GUI allows full input parameterization of the domain and binding topologies of the ligand(s) (Figure 4.1 a) and the receptor (Figure 4.1 c), monovalent kinetics between each pairwise combination of ligand-receptor binding domains (Figure 4.1 a), temporal dynamics of ligand concentration ( figure 4.1 b) and the set of parameters governing SPR and related kinetic studies, including association and dissociation times, flow rate, and level of immobilized receptor.
Simulation outputs
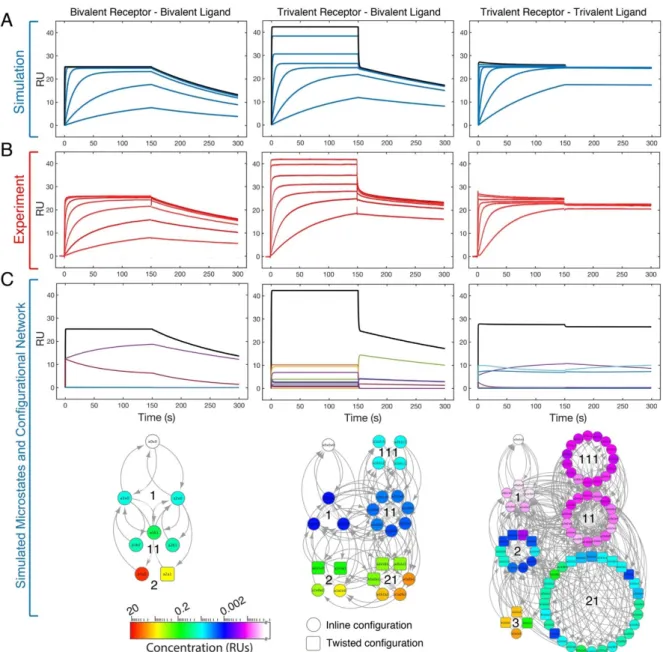
MVsim also enables users to visualize the dynamic evolution of the microstate network via an interactive map (Figure 4.2 e) and to export the response kinetics as a set of tab-delimited text files to facilitate deeper analysis through offline plotting and curve fitting and microstate network analysis in the Cytoscape software environment. MVsim also allows users to directly inspect both the calculated probability density functions and effective concentrations.
MVsim structure
The effective concentration calculation is implemented in the EffC_Calculator_polar.m, takes the receptor and ligand structure and parameters, generates the ligand and receptor PDFs, and calculates the product of the two PDFs resulting in the effective concentration. The code uses the MATLAB ode15's stiff solver to calculate the time series of the states for the given time interval.
Model Validation and Prediction for Experimental data
- Model development alongside Tratricopeptide Repeat Affinity Pro-
- Assessing performance against experimental model systems
- Applications to multivalent system design and quantification
- MVsim models the multivalency and avidity of SARS-CoV-2 S protein
- Parameter Fitting
Also, there were some unusual features in the case of binding of monovalent ligands to di- and trivalent receptors. Data preprocessing: Experimental data often contain artifacts, such as baseline drift, which is the gradual increase in signal without true changes in concentrations.
Multivalency in Protein-Protein interaction networks
Protein Multivalency Annotation
Appropriate output: There are advantages to using Bayesian optimization: it is easy to implement for every parameter in the model, can be used for the costly effective concentration calculation, and the algorithm provides visual output. Proteins that participate in complex formation are potentially multivalent binding agents; therefore they can be treated accordingly.
Semantic Databases
For these cases, the model can be used to assign a rough estimate for the binding strength based on the average distances between the binding domains. The scores on the nodes can be increased for multivalent proteins with a constant, for example representing stronger interaction by the factor equal to the multiplicity of the proteins.
Summary and Future Work
Publications Related to the Chapter
Mechanisms of non-canonical binding dynamics in multivalent protein-protein interactions. Proceedings of the National Academy of Sciences. To unify the multivalent system describing equations or to deal with large multivalent systems, the nomenclature and theory behind the state space representation can be used and parameter choices can be made using the model presented.
Summary of Thesis 2
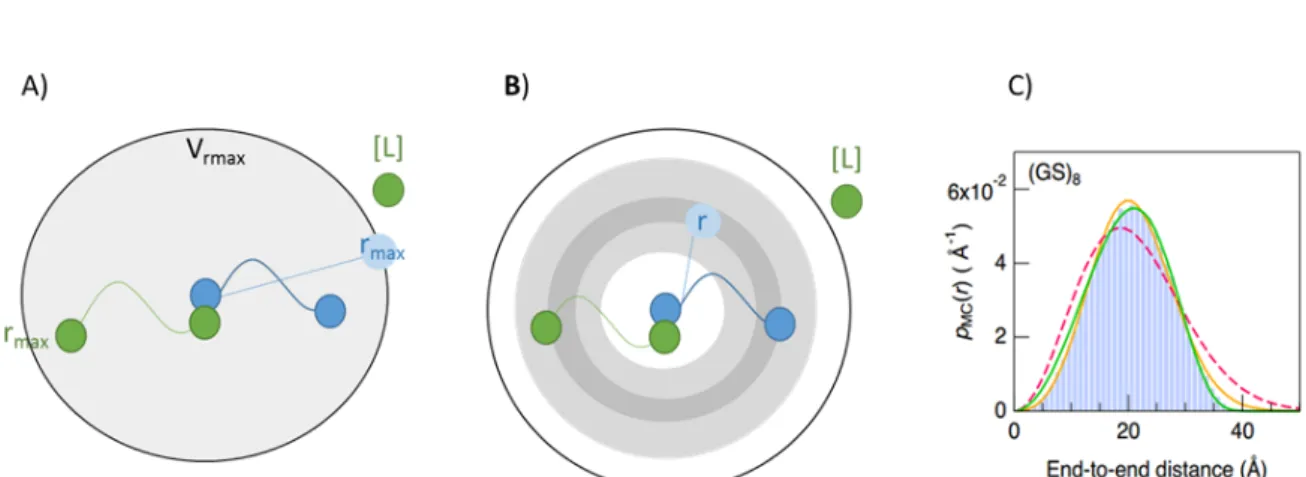
The P(binding|RL) probability that the ligand and receptor-free end are in the same position is given by R fL(x)fR(x)dxthe integral of the product where fL and FR connect the ligand and receptor end-to-end end are (bound to unbound binding site distribution) position probability density functions; moreover, the probability of a free ligand binding to the receptor simplifies to the PDF normalization constant of 1 molar ligand. The fL(x)ligand and fR(x)receptor molecule end-to-end distance probability density function—where both ligand and receptor consist of units with linkers connecting them—can be estimated by the convolution of the PDF of the components, which component PDFs can be measured or automatically generated.
Summary of Thesis 3
Additionally, supporting experiments for model development and validation are presented in this chapter. Available binding strength data are based on a mixture of measurements of multivalent and monovalent protein conformations.
Nomenclature of multivalent binding
Inhibitor and ligand binding
Surface Plasmon Resonance Device
Sensorgram: the SPR output
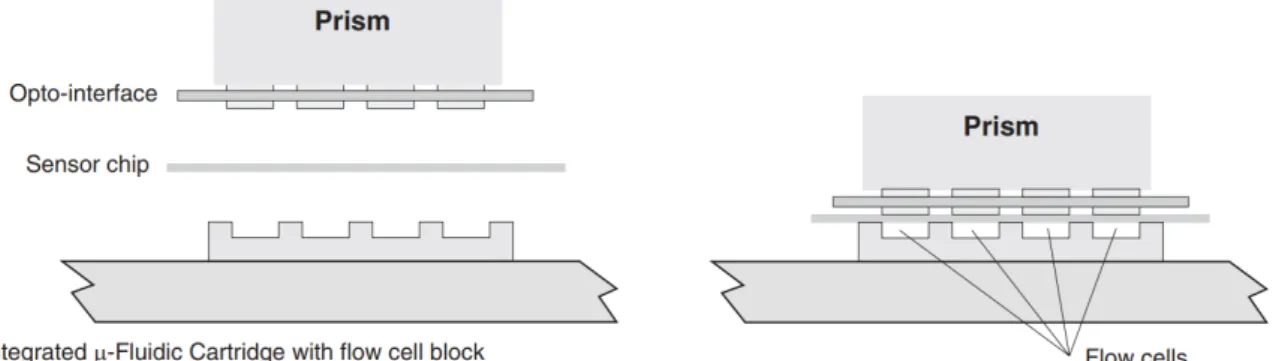
Schematics of an SPR flow cell
Multiple and multivalent binding
Linker and receptor free end-to-end distribution
Network of the complex monospecific bivalent system
Mass Transfer Limitation
The symmetric bivalent binding states
Simulation with simplified rate-constants
Experimental results alongside the simulated curves and state distribution
Different representations of the effective volume
Effective ligand concentrations
The User input fields of MVsim
MVsim output
Experimental data of mono, bi, and trivalent binding
Mono, di, trivalent TRAP receptor and ligand combinations in Biacore simulations 69
MVsim models the multivalency of the SARS-CoV-2 S protein RBD and ACE2