MŰHELYTANULMÁNYOK DISCUSSION PAPERS
INSTITUTE OF ECONOMICS, CENTRE FOR ECONOMIC AND REGIONAL STUDIES, HUNGARIAN ACADEMY OF SCIENCES BUDAPEST, 2014
MT-DP – 2014/19
Types of knowledge and diversity of business-academia collaborations
Implications for measurement and policy
ATTILA HAVAS
ii
Discussion papers MT-DP – 2014/19
Institute of Economics, Centre for Economic and Regional Studies, Hungarian Academy of Sciences
KTI/IE Discussion Papers are circulated to promote discussion and provoque comments.
Any references to discussion papers should clearly state that the paper is preliminary.
Materials published in this series may subject to further publication.
Types of knowledge and diversity of business-academia collaborations Implications for measurement and policy
Author:
Attila Havas senior research fellow Institute of Economics
Centre for Economic and Regional Studies Hungarian Academy of Sciences E-mail: attila.havas@krtk.mta.hu
August 2014
ISBN 978-615-5447-34-1 ISSN 1785 377X
iii
Types of knowledge and diversity of business-academia collaborations
Implications for measurement and policy
Attila Havas
Abstract
Business-academia (B-A) collaborations have been analysed by an extensive body of literature, taking many different angles, and using various sources and types of information (patent statistics, the Community Innovation Survey data, evidence from specific surveys, interviews, or case studies), but usually a given paper is relying on a single method, addressing one or two major research questions. In contrast, this paper tackles both R&D and innovation collaborations among businesses and academia relying on information from different statistics and interviews. The latter source also allows exploring motivations for, and major features of, B-A co-operation. The paper argues that mapping B-A collaborations by using multiple methods and multiple sources of information can significantly improve the reliability and richness of our understanding, and can offer insights on dynamics and qualitative features of these co-operation processes. Interviews conducted in Hungary – in line with other research findings – have also confirmed that (i) motivations, incentives for, and norms of, conducting R&D and innovation activities diametrically differ in business and academia; and (ii) different types of firms have different needs. Thus, more refined policy measures are to be devised to promote B-A collaboration more efficiently, better tuned to the needs of the actors, based on a relevant taxonomy of their co-operations. Evaluation criteria for academics should also be revised to remove some major obstacles, currently blocking more effective B-A co-operation. Several findings presented in this paper can be generalised beyond the cases considered, but the research design to analyse B-A collaborations and the concomitant policy recommendations always need to be tailored to the innovation systems in question.
Keywords: Types of knowledge; Business-academia collaboration; Multiple methods to map business-academia collaborations; STI policy implications
JEL classification: O38, O33
iv Acknowledgement
This paper draws on various projects; notably “Sectoral Systems of Innovation and Production in an Open Transition Economy” (OTKA, Hungarian Scientific Research Fund, contract No. T 046880 KGJ), “Micro-Dyn, The competitiveness of firms, regions and industries in the knowledge-based economy: What room for job-rich growth in Europe” (EU RTD FP6, contract No. 028868 CIT4), and “AEGIS, Advancing Knowledge-Intensive Entrepreneurship and Innovation for Economic Growth and Social Well-being in Europe”
(EU RTD FP7, grant agreement No. 225134). Financial support provided by these projects is gratefully acknowledged. Its first version (focussing on Hungary) was presented at the 11th Triple Helix International Conference entitled “Bringing businesses, universities and governments together to co-innovate and solve economic, social and technological challenges”, held on 8-10 July 2013 in London.
v
A vállalatok és a közfinanszírozású kutatóhelyek K+F és innovációs célú együttműködésének sokfélesége
Mérés és szakpolitikai következmények
Havas Attila
Összefoglaló
A vállalatok és a közfinanszírozású kutatóhelyek K+F és innovációs célú együttműködését (V–KKH együttműködés) igen kiterjedt szakirodalom elemzi, sokféle nézőpontból és eltérő típusú információkra (pl. szabadalmi statisztikákra, az EU harmonizált innovációs felmérésére [CIS], egyedi felmérésekre, interjúkra és esettanulmányokra) támaszkodva.
Általában egy tanulmány ezek közül csak egy módszert használ egy vagy két fő kutatási kérdés megválaszolására törekedve. Ezektől eltérően ez a tanulmány mind a K+F, mind az innovációs célú V–KKH együttműködéseket vizsgálja az EU tagországokban, egyrészt többféle statisztikai adatsorra, másrészt interjúkra támaszkodva. A V–KKH együttműködések mozgatórugóit és más fontos jellemzőit csak az utóbbi módszerrel lehet feltárni. A tanulmány amellett érvel, hogy a V–KKH együttműködéseket akkor ismerhetjük meg a kellő alapossággal, ha egyszerre többféle módszert és több információs forrást használunk az elemzés során. A magyarországi vállalatoknál készített interjúk – összehangban más kutatási eredményekkel – azt is megerősítették, hogy (i) a vállalatok és a KKH-k motivációi és normái gyökeresen eltérnek egymástól, valamint (ii) a különböző típusú vállalatok szükségletei erősen eltérőek, s ezért más és más jellegű V–KKH együttműködésben érdekeltek. Ezért a V–KKH együttműködéseket támogató szakpolitikai intézkedések akkor lehetnek hatásosabbak, ha figyelembe veszik ezen együttműködések eltérő típusait. A KKH- knál dolgozó kutatók értékelési rendszerét is módosítani kell, hogy megszűnjenek – de legalább csökkenjenek – az eredményesebb V–KKH együttműködéseket hátráltató akadályok. A tanulmány megállapításai és szakpolitikai ajánlásai az EU-nál tágabb körben is érvényesnek tűnnek, de minden esetben az adott innovációs rendszer sajátosságait szem előtt tartva kell megtervezni és elvégezni az elemzést, illetve kidolgozni a tényleges szakpolitikai intézkedéseket.
Tárgyszavak: a tudás típusai; a vállalatok és a közfinanszírozású kutatóhelyek együttműködése; mérés; tudomány-, technológia- és innovációpolitikai következmények
JEL kód: O38, O33
vi Köszönetnyilvánítás
A tanulmányt megalapozó kutatást a következő projektek támogatták: Ágazati innovációs és termelési rendszerek: A járműipar, az elektronika és a távközlési berendezésgyártás esete (OTKA T 046880 KGJ); Micro-Dyn, The competitiveness of firms, regions and industries in the knowledge-based economy: What room for job-rich growth in Europe (EU RTD FP6, contract No. 028868 CIT4); valamint AEGIS, Advancing Knowledge-Intensive Entrepreneurship and Innovation for Economic Growth and Social Well-being in Europe (EU RTD FP7, grant agreement No. 225134). A tanulmány első, a magyar esetre fókuszáló változata előadásként elhangzott a „Bringing businesses, universities and governments together to co-innovate and solve economic, social and technological challenges” c.
konferencián (11th Triple Helix International Conference, London, 2013. július 8-10.).
vii
Table of Contents
1 INTRODUCTION 1
2 TYPES OF KNOWLEDGE IN INNOVATION MODELS AND ECONOMICS
PARADIGMS 3
2.1 Linear, networked and multi-channel interactive learning models of innovation 3 2.2Innovation in mainstream and evolutionary economics:
types of knowledge and policy implications 5
3 MAIN ACTORS ENGAGED IN RTDI ACTIVITIES AND THEIR
CO-OPERATION IN EU COUNTRIES 7
3.1 The principal research performer sectors 7
3.2 The weight of business resources in funding R&D activities 10 3.3 Information sources for innovation – as assessed by firms 12 3.4 Types of partners in innovation co-operation and firms’ assessment 14 4 FIRMS’ MOTIVATIONS FOR R&D AND INNOVATION CO-OPERATION:
EVIDENCE FROM HUNGARY 18
5 CONCLUSIONS, METHODOLOGICAL AND POLICY IMPLICATIONS 20
REFERENCES 23
1 INTRODUCTION
Various schools of economics focus on different research questions, devise and follow specific axioms and assumptions, and rely on a certain set of preferred methods, e.g. econometrics, game theoretical models, simulations, controlled experiments or qualitative analyses.
Innovation – technological, organisational, managerial changes and opening up new markets – had been a major theme in classical economics. Then neoclassical (general equilibrium) economics essentially abandoned research questions concerned with dynamics, and instead focused on static comparative analyses and optimisation. Technological changes were treated as exogenous to the economic system. More recently, given compelling empirical findings and new theoretical insights on firm behaviour and the operation of markets, various branches of mainstream economics1 have relaxed some of the most unrealistic assumptions of neoclassical economics, and put innovation back on the research agenda. For evolutionary economics of innovations, in contrast, since its foundation innovation has been the central theme, and this paradigm has also developed a diametrically different theoretical framework to analyse its core questions. These competing schools, however, now share some major claims: innovation contributes to enhanced productivity to a decisive extent, creates new opportunities to increase profits, and thus improves competitiveness at the micro level.
Further, it has significant impacts on several macroeconomic indicators, too, including growth, the structure of the economy and foreign trade, balance of payment, investments, and employment.2 These schools, although consider different types of knowledge as major inputs for innovations, also share the view that universities and publicly financed research organisations (PROs) are major actors.
There are a variety of linkages in a successful national innovation system (NIS) among its players (businesses, academia, intermediary organisations, service providers, policy-makers etc.). Firms are involved in different ways and to a varying degree in shaping science, technology and innovation (STI) policy strategies and actual policy measures. The types and quality of links between businesses and intermediary organisations (including actors offering funds for innovation activities) also influence the performance of a given NIS, just as external linkages, that is, the internationalisation of research, technological development and
1 Mainstream economics is constantly evolving, driven by its own ‘internal’ dynamics as well as by integrating new notions, research questions and methods from various schools of economics. Its major features cannot, therefore, be precisely defined. For example, while representative agents were a central feature for decades, more recently heterogeneity has become a key issue, e.g. in the new trade theory.
2 It is impossible to give a comprehnsive and balanced overview of this huge literature. Only a few groundbreaking pieces, handbooks or other synthesis papers can be highighted here in a somewhat arbitrary way, excluding the so-called endogenous (or new) growth theory: Baumol 2002; Baumol et al. 2007; Dodgson and Rothwell (eds) 1994; Dosi 1988; Dosi et al. (eds) 1988; Edquist (ed) 1997; Ergas 1986, 1987; Fagerberg et al. (eds) 2005;
Fagerberg et al. 2012; Freeman and Soete 1997; Hall and Rosenberg (eds) 2010; Klevorick et al. 1995; Lundvall (ed) 1992; Lundvall and Borrás 1999; Martin 2012; Mowery and Nelson 1999; Nelson (ed) 1993; Nelson 1995;
Nelson and Winter 1982; OECD 1992, 1998; Pavitt 1999; Smith 2000; von Tunzelmann 1995.
2
innovation (RTDI) processes and the impacts of external STI policies. Of these linkages, only business-academia (B-A) co-operation is discussed in this paper. It is aimed at providing a map of B-A collaboration in the EU countries, drawn by using several ‘lenses’ offered by various data sets, together with findings of interviews conducted with firms in Hungary.
Business-academia collaborations have been extensively studied in many countries (Agrawal and Cockburn 2002; Balconi et al. 2004; Borsi 2005; Carlsson 2012; Cowan 2005;
D’Este, Patel 2007; D’Este et al. 2011; Feller et al. 2002; Guerini et al. 2012; Havas 2004, 2009, 2010, 2011; Hemmert at al. 2014; Howels and Nedeva 2003; Inzelt 2004, 2010; Inzelt et al. 2011; Jensen et al. 2010; Laredo 2007, 2011; Laursen and Salter 2004; Mansfield, Lee 1996; Mazzoleni and Nelson 2007; Meyer-Kramer and Schmoch 1998; Mohnen and Hoareau 2002; Mora-Valentin et al. 2004; Mosoniné Fried and Szunyogh 2008; OECD 2001, 2002, 2008; Pavitt 1999; Rietzen and Soete 2011; Rosenberg and Nelson 1994; Schartinger et al.
2002; Technopolis 2012). These papers take many different angles, and use various sources and types of information (e.g. patent statistics, Community Innovation Survey [CIS] data, evidence from tailor-made surveys, interviews, or case studies), but usually a given paper relies on a single method and tackles one or two specific research questions. In contrast, this paper addresses both R&D and innovation collaborations among businesses and academia by considering information from different set of statistics, namely those on i) sources of R&D funding for universities and PROs, ii) sources of information for innovations, as well as iii) occurrence and ‘value’ of innovation co-operation by the type of partners. Further, it also relies on interviews to explore motivations and major features of B-A co-operation in Hungary. In other words, for pragmatic reasons the unit of analysis is changing when there is a shift in methods: the unit of analysis is a set of EU countries (all member states, except Croatia, Cyprus, Luxembourg and Malta) for statistical analyses, and given the time and other resources needed for interviews it is only Hungary for qualitative analyses. Yet, it is believed that this ‘mixed level’ of analysis can still illustrate the benefits of using multiple methods for mapping B-A collaborations. Indeed, results of qualitative research conducted in other countries are in line with the findings derived from the Hungarian interviews.
This paper is organised as follows. Section 2 highlights different types of knowledge, stemming from various sources, required for successful innovation processes, and juxtaposes various models of innovation and economics paradigms as to how these various approaches treat knowledge created and used for innovation and hence what type of B-A collaborations attract their attention. Section 3 briefly describes the major RTDI performing sectors in 24 EU countries, then explores B-A co-operation from several angles, relying on various sets of statistics. Section 4, based on interviews with firms operating in Hungary, argues that different types of firms have different types of needs and internal resources, and thus they enter into different types B-A co-operations. Further, businesses and academic organisations
3
have different motivations for co-operation, as well as different norms, values, and internal decision-making systems, and thus co-operation is far from being smooth. Conclusions, policy implications and directions for further research are summarised in Section 5. One of the major conclusions is that mapping B-A collaborations by using multiple methods and multiple sources of information can significantly improve the reliability and richness of our understanding and can offer insights on the dynamics and qualitative features (e.g.
motivations, incentives, strategic considerations) of these co-operation processes. As to policy implications, more refined policy measures are needed to promote B-A collaboration in a more effective way, better tuned to the needs of the actors, based on a relevant taxonomy of RTDI collaborations.
2 TYPES OF KNOWLEDGE IN INNOVATION MODELS AND ECONOMICS PARADIGMS Innovation was the core notion for Schumpeter in his attempts to analyse business dynamics, but in mainstream economics it has not become a key research question for decades. The first models of innovation, therefore, had been devised by natural scientists and practitioners before economists showed a serious interest in these issues. Then the classic articles on the
“simple economics of basic scientific research” by Nelson (1959) and the “allocation of resources for invention” by Arrow (1962) marked a new beginning; since then various economics schools have also applied and adapted their own analytical tools and methods to examine various aspects of RTDI processes, and a new paradigm, namely the evolutionary economics of innovation has also ‘evolved’.3
2.1 LINEAR, NETWORKED AND MULTI-CHANNEL INTERACTIVE LEARNING MODELS OF INNOVATION
The idea that basic research is the main source of innovation was already proposed in the beginning of the 20th century, mainly by natural scientists and managers of company labs who were comparing large firms, sectors and national economies by their R&D intensities in an attempt to establish the links between R&D activities and economic performance (Fagerberg et al. 2011; Godin 2008). This reasoning then became a key idea in Bush (1945), a still highly influential report. Bush was the first policy advisor who forcefully explained the fundamental role of scientific research in underpinning economic competitiveness and advocated a new line in policy thinking: “We will not get ahead in international trade unless we offer new and more attractive and cheaper products. Where will these new products come from? How will we find ways to make better products at lower cost? The answer is clear.
3 Other important research programmes have also emerged, most importantly the various schools of science and technology studies (for a thorough historical overview see e.g. Martin 2012), but that literature is not explored here.
4
There must be a stream of new scientific knowledge to turn the wheels of private and public enterprise. (…) New products and new processes do not appear full-grown. They are founded on new principles and new conceptions, which in turn are painstakingly developed by research in the purest realms of science. (…) Today, it is truer than ever that basic research is the pacemaker of technological progress. In the nineteenth century, Yankee mechanical ingenuity, building largely upon the basic discoveries of European scientists, could greatly advance the technical arts. Now the situation is different. A nation which depends upon others for its new basic scientific knowledge will be slow in its industrial progress and weak in its competitive position in world trade, regardless of its mechanical skill. (…) We can no longer count on ravaged Europe as a source of fundamental knowledge. In the past we have devoted much of our best efforts to the application of such knowledge which has been discovered abroad. In the future we must pay increased attention to discovering this knowledge for ourselves particularly since the scientific applications of the future will be more than ever dependent upon such basic knowledge. (…) For many years the Government has wisely supported research in the agricultural colleges and the benefits have been great.
The time has come when such support should be extended to other fields.” (Bush 1945, ch. 3) These ideas have gradually led to what is known today as the science-push model of innovation. By the second half of the 1960s the so-called market-pull model contested that reasoning, portraying demand as the driving force of innovation. An extensive debate has evolved between these two approaches, trying to establish which is more accurate in describing innovation processes, and especially identifying the most important information sources for innovation.4 Then both became variants of the linear model of innovation when Kline and Rosenberg (1986) suggested the chain-linked model, stressing the non-linear property of innovation processes, the variety of sources of information, as well as the importance of various feedback loops. This latter one has been extended into the networked model of innovation; more recently called the multi-channel interactive learning model (Caraça et al., 2009).
In sum, both the science-push and the networked (interactive) models of innovation emphasise the role of universities and PROs as important information sources for innovation.
The main difference between these approaches is how they portray the other actors: the networked model considers various types of knowledge – besides R&D results produced by academic organisations –, and thus highlights not only B-A collaborations, but the significance – in many cases the necessity – of further types of co-operations as well, namely
4 Just to indicate the extent and the long-lasting impacts of this debate, a recent overview by Di Stefano et al.
(2012) relies on not fewer than one hundred papers.
5
those between innovators, on the one hand, and their suppliers, competitors, users, other business partners, as well as professional associations, on the other.5
2.2 INNOVATION IN MAINSTREAM AND EVOLUTIONARY ECONOMICS:
TYPES OF KNOWLEDGE AND POLICY IMPLICATIONS
Mainstream economics6 depicts actors as rational agents facing known and calculable risks and driven by the aspiration to make optimal decisions. In contrast, evolutionary economics of innovation posits that uncertainty is an inherent feature of innovation processes and optimisation, therefore, is excluded on theoretical grounds. Further, while the availability of information has been a focal question in mainstream economics for decades, a major lesson of the evolutionary account of innovation is that firms’ performance is determined by their accumulated knowledge – both codified and tacit – and skills, as well as learning capabilities. Information can be obtained via normal market transactions, and thus mainstream economics can readily treat information as a special good.7 In contrast, knowledge cannot be bought and used instantaneously – and that applies a fortiori to the types of knowledge required for innovation (how to exploit readily available pieces of information in a new way e.g. by combining information on different subject matters, how to utilise experience and skills accumulated through previous search processes, and how to assemble these various types of knowledge). One must go through a learning process to acquire knowledge and skills, and it is not only time-consuming, but the costs of trial and error need to be incurred as well. Hence, the uncertain, cumulative and path-dependent nature of innovation is reinforced. Cumulativeness, path-dependence and learning lead to heterogeneity both at micro and meso levels (Castellaci 2008; Dosi 1988; Dosi et al. (eds) 1988; Fagerberg et al. (eds) 2005; Hall and Rosenberg (eds) 2010; Malerba, 2002; Pavitt 1984; Peneder, 2010).
As to policy advice, the fundamental concept in mainstream economics is market failure:
unpredictability of R&D outputs from inputs, inappropriability of full economic benefits of private investment in R&D, and indivisibility in R&D results lead to ‘suboptimal’ level of business R&D efforts. Two types of policy interventions, therefore, are justified: (a) incentives to boost private R&D expenditures via subsidies and protection of intellectual property rights, and (b) funding for public R&D activities.
5 This brief account could only list the most influential models. Balconi et al. (2010), Caraça et al. (2009), Dodgson and Rothwell (eds) (1994) and Godin (2006) offer detailed discussions on their emergence, properties and use for analytical and policy-making purposes.
6 The so-called new or endogenous growth theory is not discussed here separately because its major assumptions on knowledge are very similar to those of mainstream economics (Lazonick, 2013; Smith, 2000). Knowledge in new growth models is reduced to codified scientific knowledge, in sharp contrast to the much richer understanding of knowledge in evolutionary economics of innovation.
7 Various forms of learning are now studied in mainstream economics, too, e.g. learning by doing and exporting.
6
Evolutionary economics of innovation does not focus exclusively on R&D. This school identifies various types and forms of knowledge, all relevant for innovation. In particular, the importance of tacit knowledge is stressed, besides codified knowledge. Practical knowledge – acquired, developed, revised and transmitted when performing various tasks –, is obviously of crucial importance for the innovation process. Hence, scientific knowledge is far from being the only, or most important, type of knowledge required for a successful introduction of new products, processes, services, or organisational and managerial innovations. As for the sources of knowledge, R&D is clearly among the vital ones (both for codified and tacit knowledge). Besides in-house R&D projects, however, results of other R&D projects are also widely exploited for innovation process: extramural projects conducted in the same or other sectors, at public or private research establishments, home or abroad. Further, a number of other sources of knowledge are also of significance for innovations, such as design, scaling up, testing, tooling-up, trouble shooting, and other engineering activities, as well as ideas from suppliers, users and NGOs (including patient groups), inventors’ ideas and practical experiments, as well as interactions among artists, designers and engineers (Hirsch-Kreinsen et al. (eds) 2005; Klevorick et al. 1995; Lundvall (ed) 1992; Lundvall and Borrás 1999; von Hippel 1988). In general, all sorts of trial and error processes, learning by doing, using, interacting and comparing contribute to knowledge generation. Further, knowledge embodied in advanced materials and other inputs, as well as in equipment and software is also utilised by innovative firms. All rounds of the Community Innovation Survey clearly and consistently show that firms regard a wide variety of sources of information as highly important to innovation.8
In brief, policy implications of evolutionary economics can be derived from two closely related claims. First, the success of firms is largely determined by their abilities to exploit all the above types of knowledge, coming from both R&D activities and other activities. Second, knowledge generation, diffusion and exploitation takes place in, and is fostered by, networks, clusters and other forms of co-operation and communications. The quality and frequency of these interactions are largely determined by the institutions – the ‘rules of the game’ – and other properties of a given innovation system, in which they take place (Bergek et al. 2008;
Carlsson et al. 2002; Ergas 1986, 1987; Etzkowitz and Leydesdorff 2000; Edquist (ed) 1997;
Fagerberg et al. (eds) 2005; Foray (ed) 2009; Freeman 1987, 1991, 1994, 1995, 2002;
Lundvall (ed) 1992, Lundvall et al. 2002; Nelson (ed) 1993, Nelson 1995; Niosi 2002; Smith 2000, 2002). STI policies, therefore, should aim at strengthening the respective – sectoral, regional or national – innovation system and improving its performance by tackling systemic failures hampering the production, circulation and utilisation of any type of knowledge required for successful innovation (Dodgson et al. 2011; Edquist 2011; Foray (ed) 2009;
8 See e.g. EC 2004, Table 1.2.3 for the 1998-2000 period, as well as Figures 5-6 in this article for 2008-2010.
7
Freeman 1994; Lundvall and Borrás 1999; OECD 1998; Smith 2000). Concerning B-A collaborations, deliberate policy efforts are needed to promote its various types, serving knowledge-intensive activities of all firms, regardless whether the aim is a radical innovation, an incremental one, or ‘just’ solving an important technical problem.
3 MAIN ACTORS ENGAGED IN RTDI ACTIVITIES AND THEIR CO-OPERATION IN EU COUNTRIES
3.1 THE PRINCIPAL RESEARCH PERFORMER SECTORS
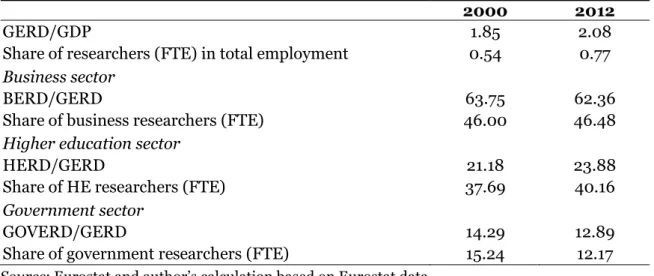
The business sector is the most important research performer at an aggregate level in the EU27 countries both in terms of its share in GERD and employment, followed by the higher education and the government sectors. (Table 1) The share of the private non-profit sector is around 1% by either measure, and thus it is not analysed here.
Table 1 R&D inputs and the weight of R&D performing sectors, EU27, 2000; 2012 (%)
2000 2012
GERD/GDP 1.85 2.08
Share of researchers (FTE) in total employment 0.54 0.77 Business sector
BERD/GERD 63.75 62.36
Share of business researchers (FTE) 46.00 46.48
Higher education sector
HERD/GERD 21.18 23.88
Share of HE researchers (FTE) 37.69 40.16
Government sector
GOVERD/GERD 14.29 12.89
Share of government researchers (FTE) 15.24 12.17
Source: Eurostat and author’s calculation based on Eurostat data
The number of researchers (counted as full-time equivalent, FTE) employed by businesses has increased from 500,377 in 2000 to 763,993 by 2012 in the EU27 countries, and thus remained the largest employers of researchers.9 This pattern is not repeated at a country level: in 2012 businesses were the largest employers of (FTE) researchers in 12 EU countries, while the higher education sector took the lead in 11 EU countries, and the government sector in a single country. The share of business enterprise researchers in the EU27 total was 46.5% in 2012 and varied between 15.2% (LV) and 62.3% (AT) in the national total at a country level. This ratio was above 50% in 11 EU countries and under 30% in 8 ones. (Figure 1) Business R&D expenditures (BERD) have increased from €111,181.1m in
9 Data used in this sub-section are taken from Eurostat and own calculations are also based on these data.
8
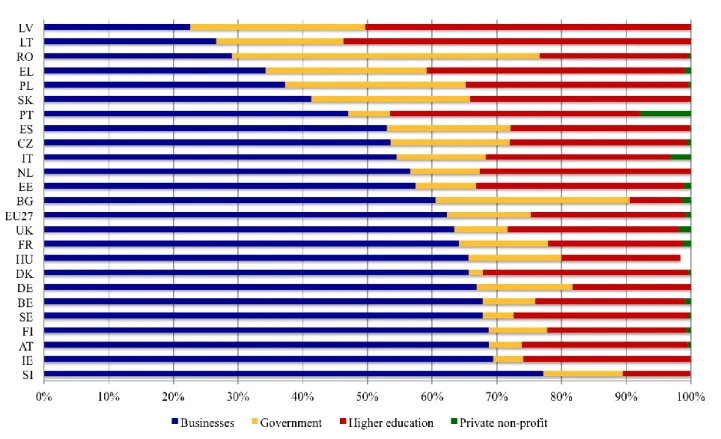
2000 to €145,652.6m in 2012 (PPS at 2005 prices), that is, by 31%. The share of GERD performed by the business enterprise sector was 62.4% in 2012. At a country level this ratio was ranging between 22.6% (LV) and 77.2% (SI) in 2012, with six countries above 67%, seven relatively close to the EU27 average ratio, that is, between 57-67%, six between 40-57%, and another five below 40%.10 (Figure 2)
Figure 1 Share of research performing sectors in employing FTE researchers,
EU countries, 2012
Source: author’s calculation based on Eurostat data
* 2011 data
10 This share has hardly changed between 2000 and 2012 in 14 countries (not more than 5 percentage point change), but there were some significant changes, too: an increase by 9 percentage points from an already high level in SE, by 17-22 percentage points in four countries (HU, LV, PT, SI), by 34-40 percantage points in BG, EE, and RO, and a decrease by 25 percentage points in SK. A detailed analysis would be required to identify if geniune structural shifts or reclassification of research performing organisations have casued these changes.
9
Figure 2 Share of research performing sectors in performing GERD, EU countries, 2012
Source: author’s calculation based on Eurostat data
Higher education (HE) organisations were the second largest employers with 412,473 FTE researchers in 2000 at the EU27 level and 660,040 in 2012, that is, 40.2% of the EU27 total. Again, there is a great variety at a national level: the share of HE FTE researchers in the national total was ranging between 24.9% (HU) and 66.8% (LV) in 2012. It was close to the EU27 aggregate figure, i.e. stood between 37% and 43% in 4 countries, below 37% in 11 countries, in the range of 43-60% in 5 countries, and above 60% in 4 countries. (Figure 1) The total EU27 R&D expenditures in the HE sector (HERD) have increased by 51% in absolute terms: from €36,933.9m in 2000 to € 55,776.0m in 2012 (PPS at 2005 prices). The share of GERD performed by the HE sector is significantly lower: it fluctuated between 21.2%
and 23.9% in 2000-2012 at the aggregate level of 27 EU countries. The HERD/GERD ratio varied between 8.0% (BG) and 53.7% (LT) in 2012 at a country level. In 5 countries it was in the range of 8-21%, in another 6 close to the EU27 ratio (between 21-27%), in 11 ones between 27-40%, and in 2 ones above 50%. (Figure 2)
At an aggregate level the government sector was the No. 3 employer with 166,791 FTE researchers in 2000, and 200,045 in 2012, that is, less than one third of the HE figures. The share of this sector was 12.2% of the EU27 total in 2012, but the variation at the country level is significant in this case, too: the weight of the government sector is ranging between 3.0%
10
(UK) and 47.3% (BG). This share is below 7% in 7 countries, between 11% and 12% (that is, very close to the EU27 aggregate) in 4 countries, between 16% and 21% in 11 countries, and above 39% in 2 countries. (Figure 1) The share of GERD performed by the government sector was in line with its share in employment, that is, 12.9% in 2012 at the aggregate EU27 level.
At the country level this share varied from 2.2% (DK) to 47.6% (RO) in 2012: it was below 10% in 10 countries, between 10% and 15% (i.e. close to the EU27 ratio) in 6 countries, between 15% and 30% in 8 countries, and close to 50% in RO. (Figure 2)
3.2 THE WEIGHT OF BUSINESS RESOURCES IN FUNDING R&D ACTIVITIES
BERD is mainly financed by businesses’ own resources: this share was fluctuating in a narrow range of 81.3-83.2% in 2000-2011. From a different angle, the bulk of business R&D funds is devoted to business R&D activities: 94.8-95.7% in the same period. It is worth stressing, though, that in some countries businesses fund research activities both at HE institutes and in the government sector (publicly financed R&D institutes, or PROs) to a noteworthy extent.
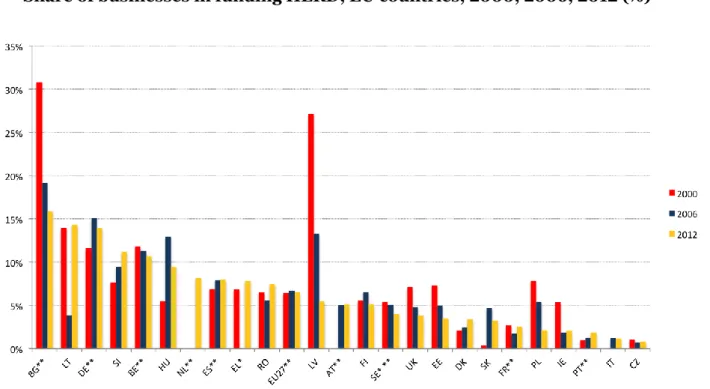
While at the EU27 level 6.3-6.8% of HERD was financed by businesses in 2000-2012, at a country level one can find much more variation both in terms of the ratio of business sources and dynamics. (Figure 3) The share of business sources in funding HERD was around or above 10% in 6 countries, around 7-8% in 4 countries, around 3-5% in 8 countries, and less than 3% in 6 ones in 2012. In some countries this share decreased significantly, e.g. from 30.8% in 2000 to 16.0% in 2012 (BG), or from 27.1% to 5.4 (LV), while in other cases first increased from 5.5% in 2000 to 13.0% in 2006, and then decreased to 9.5% in 2012 (HU).
Overall, this share grew in 10 countries by 2012, among these by around 4 percentage points in Hungary and Slovenia, and by 2.3 percentage points in Germany from an already high level, and declined in 11 countries (missing data for 3 countries).
The share of business sources in funding HERD is higher than the aggregate EU27 figure in 10 countries, of which 5 are new member states and one is a less developed Southern European country. The relatively high ratio of business funding in these countries might be attributed to the low amount of HERD in absolute terms: a few projects commissioned by firms, with relatively low budgets by international standards, can lead to a high weight of business funding in HERD.
11
Figure 3 Share of businesses in funding HERD, EU countries, 2000, 2006, 2012 (%)
Source: author’s calculation based on Eurostat data
* 2001 data instead of 2000 data
** 2011 data instead of 2012 data
The share of business sources in funding Government Intramural Expenditure on R&D (GOVERD) was 5.7-8.9% at an aggregate EU27 level in 2000-2011. As for the member states, this ratio was in the range of 1.1% (PT [2011] and 17.3% (RO) in 2012. It was above 10% in 8 countries, 7-9% in 4 countries, 4-6% in 8 countries, and 1-3% in 4 ones in 2012 (or 2011).
(Figure 4) This ratio increased in 9 countries (by 7 percentage points in DE, 3-4 percentage points in 3 countries, around 2 percentage points in 2 countries, around 1 percentage point in 3 countries, and just 0.4 point in one country), and decreased in 13 cases (by 6-12 percentage points in 4 countries, by 3-5 points in another 4, and by 1-2.5 points in the remaining three countries).
The share of GOVERD financed by businesses is higher in 10 member states than the EU27 figure, and 6 of these are new members. The low volume of GOVERD in these countries, most likely, is an important factor in explaining the high value of this ratio.
12
Figure 4 Share of businesses in funding GOVERD, EU countries, 2000, 2006, 2012 (%)
Source: author’s calculation based on Eurostat data
* 2001 data instead of 2000 data
** 2011 data instead of 2012 data
3.3 INFORMATION SOURCES FOR INNOVATION – AS ASSESSED BY FIRMS
The quality of co-operation among the NIS players can be characterised by firms’
assessments as to the importance of sources of information for their innovation activities. In all countries participating in CIS2008 and CIS2010 the largest share of firms regards their own enterprise or enterprise group as a highly important source of information for innovation, and other firms – suppliers, customers, competitors and commercial labs – are also highly appreciated by a large part of firms. Thus Figure 5 only presents these business- type sources of information. The other sources – which can be called ‘scientific’ ones in a bit simplified way – are depicted on Figure 6. These are “highly important sources of information” for a significantly lower share of innovative firms. In most countries conferences, trade fairs, and exhibitions ranked first in this group, scientific journals and trade/technical publications comes second, followed by universities and public research institutes. Universities are among the top 3 in seven countries: they came second in Estonia, Finland, and Hungary, while third in Belgium, the Czech Republic, Poland, and Spain. PROs were ranked No. 2 in Spain, while in all other countries No. 5, except Poland (No. 3) and the Czech Republic (No.4).
13
Figure 5 Highly important ‘business’ sources of information for product and process
innovation, EU members, 2008-2010
Source: Eurostat, CIS2010
Figure 6 Highly important ‘scientific’ sources of information for product and process
innovation, EU members, 2008-2010
Source: Eurostat, CIS2010
14
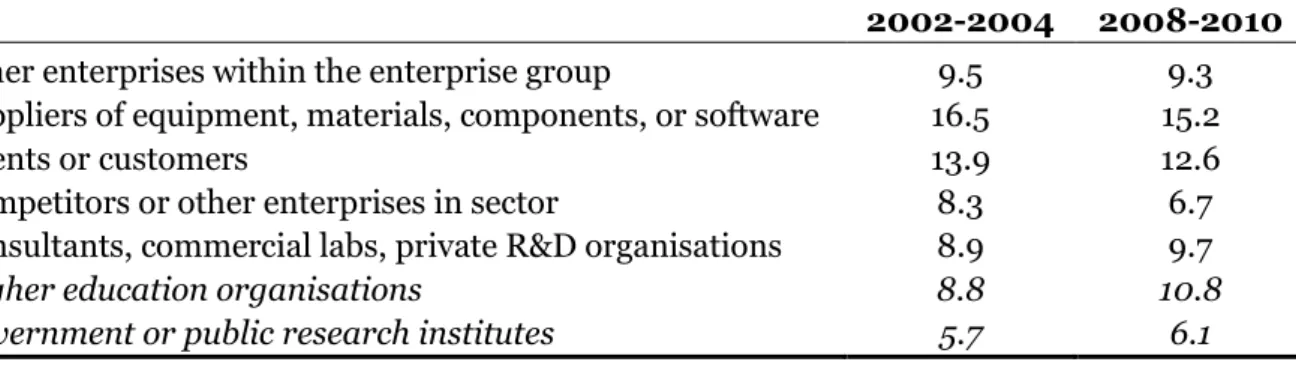
3.4 TYPES OF PARTNERS IN INNOVATION CO-OPERATION AND FIRMS’ ASSESSMENT Data on innovation co-operation partners are only available at the EU27 level for 2002-2004 and 2008-2010. In both periods, 25.5% of innovative enterprises reported being “engaged in any type of co-operation”. Overall, a larger share of innovative firms have co-operated with business partners (other enterprises in their group, suppliers, clients, competitors, and commercial labs) than with higher education institutes (HEIs) or publicly financed research organisations (PROs). (Table 2) Suppliers of equipment, materials, components, or software were mentioned by the highest share of innovative firms as co-operation partners in both periods (16.5% and 15.2%, respectively). HEIs have become partners for a higher share of firms by 2008-2010 (8.8% vs. 10.8%), and thus ‘overtaken’ three types of business partners (out of five), including other enterprises within the enterprise group. PROs have remained the least frequently mentioned co-operation partners, but 2008-2010 saw a slight increase.
Table 2 Share of innovative enterprises indicating co-operation with specified partners,
EU27, 2002-2004 and 2008-2010 (percentage of all innovative enterprises)
2002-2004 2008-2010
Other enterprises within the enterprise group 9.5 9.3
Suppliers of equipment, materials, components, or software 16.5 15.2
Clients or customers 13.9 12.6
Competitors or other enterprises in sector 8.3 6.7
Consultants, commercial labs, private R&D organisations 8.9 9.7
Higher education organisations 8.8 10.8
Government or public research institutes 5.7 6.1
Source: Eurostat
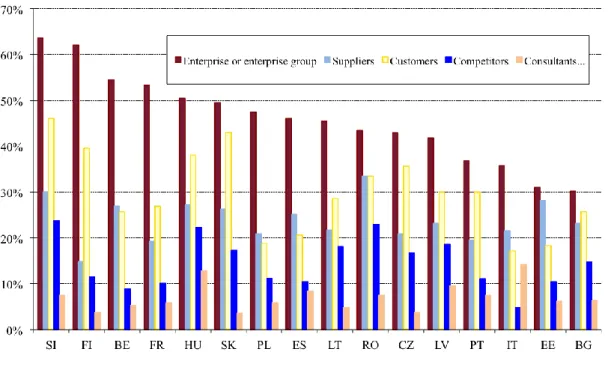
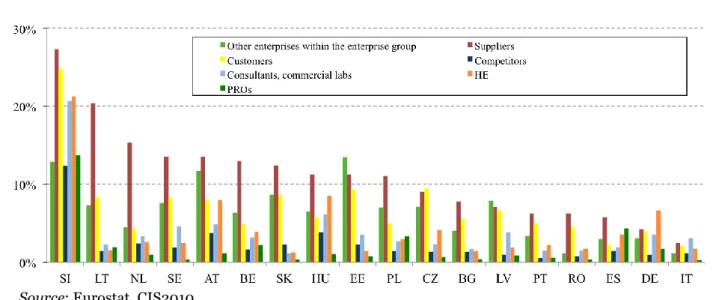
There are significant differences among EU members in this respect, too, and thus Figure 7 presents country-level data. Almost in all countries the highest share of innovative firms report co-operation with suppliers, with the exception of Finland and the UK (where customers are the top co-operation partners), and Germany (HEIs). It is noteworthy that 23- 35% of innovative firms co-operate with suppliers in 15 countries, and 16% of firms do so in another 2 countries, while the aggregate EU27 figure is 15.2%. Similarly, 21-30% of innovative firms co-operate with clients or customers in 14 countries, and 13-15% of firms do so in another 3 countries, while the aggregate EU27 figure is 12.6%. As for competitors or other enterprises in the sector, 8-31% of innovative firms in 14 countries co-operate with them, as opposed to the ratio of 6.7% for the EU27 countries. Finally, 12-26% of innovative firms in 16 countries co-operate with other enterprises within the enterprise group, which is well above the EU27 figure (9.3%). In short, innovation co-operation with ‘business’ partners
15
are much more widespread in a large number of countries than suggested by the aggregate EU27 data.
Figure 7 Innovation co-operation methods, EU members, 2008-2010
Source: Eurostat, CIS2010
It is also interesting to note that there is no clear division between the more and the less advanced member states (or the ones belonging to various groups defined using the so-called Summary Innovation Index). For example, Lithuania, Slovakia and Slovenia are next to Finland, Sweden and Denmark on Figure 7, while Bulgaria and Romania are in the same group as Germany, Spain and the UK.11 In other words, the higher occurrence of innovation co-operation does not necessarily mean a better innovation – and ultimately economic – performance. Clearly, there are many other factors influencing innovation performance – and much more determining economic one. As for the former, the quality of co-operation is among those factors. Thus, when analysing B-A co-operation it is also important to note which co-operation method is the most valuable one for firms. In most EU countries co- operation with suppliers, customers, and other enterprises within the enterprise group is mentioned by a relatively large portion of firms as the most valuable method. (Figure 8)
11 Lithuania, Bulgaria and Romania were in the group of “modest innovators” given their 2008-2009 performance, reflected in the Innovation Union Scoreboard 2010, Slovakia and Spain were among the “moderate innovators”, Slovenia and the UK were “innovation followers”, while Denmark, Finland, Germany Sweden formed the club of
“innovation leaders”. (UNU-MERIT 2011)
16
Figure 8 Innovation co-operation methods assessed most valuable,
EU members, 2008-2010
Source: Eurostat, CIS2010
Yet, in six countries higher education institutes are among the top three co-operation method: HEIs were ranked first in Germany (6.6% of the innovative firms mentioned this method as the most valuable for innovation, and only 4.2% perceived suppliers as the most valuable innovation co-operation partners), second in Hungary (8.5%), while third in Austria (8.0%), Romania (1.7%), Slovenia (21.3%), and Spain (3.6%).12 PROs are assessed far less favourably: besides Spain, where they are ranked No. 2 (4.3%), nowhere else are among the top three.
Finally, Figures 9-10 zoom into innovation co-operation with HEIs and PROs, respectively. Finland is way ahead of other countries in both cases, and although there are no data as to how Finnish firms assess the various types of innovation co-operation partners, it is highly likely that they find co-operation with both HEIs and PROs useful, otherwise they would be engaged in these B-A collaborations to a lesser extent. It is also worth noting that a high share of innovative Finnish firms tends to co-operate: Finland is the only country where any of the 7 types of innovation co-operation partners is mentioned at least by 22% of innovative firms (and on top of that, five types are mentioned by around or well above 30%).
(Figure 7)
12 These figures also indicate that either only a small number of firms reply to this question of the CIS questionnaire in several countries, and thus with a low share of ‘votes’ universities can take one of the top three positions, or they are more critical in some countries when the value of innovation co-operation methods are to be assessed than in other countries.
17
Figure 9 Innovation co-operation with HE institutes, EU members, 2008-2010
Source: Eurostat, CIS2010
Figure 10 Innovation co-operation with PROs, EU members, 2008-2010
Source: Eurostat, CIS2010
18
4 FIRMS’ MOTIVATIONS FOR R&D AND INNOVATION CO-OPERATION: EVIDENCE FROM HUNGARY
It has been a recurring theme of various reports and policy documents that the intensity, frequency, and quality of B-A co-operation in Hungary has been significantly below the desired level. (Arnold et al. 2007) The SME development strategy of the Ministry for Economy and Transport has stressed that knowledge diffusion between publicly financed research institutes and firms has been insufficient; directors of PROs have not considered businesses’ interests when defining research themes or assessing researchers’ performance;
and researchers have hardly moved between PROs and businesses. (GKM 2008, p. 34)
Thus several Hungarian STI policy measures have been devised with the aim of promoting B-A co-operation in Hungary, either by making this type of collaboration compulsory, or giving priority to joint project proposals of firms and universities or PROs.13 Most likely these measures have at least some impacts: the frequency of B-A collaboration has increased to a noteworthy extent since 2002. (Havas 2013) An evaluation report on the use of the Research and Technological Innovation Fund – the most important domestic fund to support RTDI activities – in 2004-2009 also states: “The corporate sector and (…) universities/ public research institut[e]s have definitely come closer to one another.” (Ernst &
Young and GKI 2010a, p. 4)
Interviews conducted in four sectors – automotive industry, pharmaceuticals, telecom equipment manufacturing, and software development – have confirmed that companies and public R&D units (HEIs and PROs) are driven by fundamentally different incentives and goals to be involved in R&D and innovation activities. Hence, there are inherent hindrances to B-A collaboration. In brief, companies are interested in a relatively wide array of R&D activities (from day-to-day problem solving to long-term strategic research, some of which may require to produce advanced scientific and technological knowledge, or even path- breaking new theoretical results), but those should lead to business results (e.g. enhanced productivity, larger market shares, entry to new markets, increased profits). Projects are regularly monitored and assessed, and when necessary, a given project could be substantially reshaped (e.g. in terms of the number of participants, R&D methods applied, budget), or even stopped. Thus, tight project management (meeting deadlines and ‘respecting’ budget constraints) and keeping commercially sensible information secret are of vital importance. In contrast, researchers working for universities and PROs are not simply interested, but even forced to disclose their results as quickly and as widely as possible, given the evaluation criteria applied in the academic world. Further, they are usually less accustomed to tight
13 The first of these types of measures were introduced already in the second half of the 1990s. For an overview of these measures see, e.g. Havas and Nyiri (eds) 2007, and for more details the annual ERAWATCH and TrendChart country reports, as well as the Joint Inventory of Policy Measures by ERAWATCH and TrendChart at http://erawatch.jrc.ec.europa.eu/erawatch/opencms/research_and_innovation/.
19
project management, but noticeable changes have occurred in recent years, due to tighter control exercised by both the domestic and foreign funding agencies.
These systemic hindrances to B-A collaborations – different goals and incentives for academic researchers and businesses – are not a unique feature of Hungarian innovation system. Several “profound differences in the ‘scientific’ and ‘industrial’ cultures” – fairly similar ones to those observed in Hungary – have been highlighted in a presentation by the General Secretary of the European Council of Academies of Applied Sciences, Technologies and Engineering. (Lukasik 2013)
Based on the interviews conducted with Hungarian firms, at least three fundamentally different types of business-academia collaboration can be identified. No doubt, other types of co-operations might also be found, and a more detailed, more refined classification could also be devised. This tentative taxonomy considers two major aspects: whether there is any ownership link between the partners, and the main objectives of co-operation.
1) Co-operation between R&D intensive spin-off companies and their founding university or PRO
Research-intensive spin-off firms naturally co-operate closely with those research units where their co-founders used to work (or still keep a part-time position). In spite of strong personal contacts, certain frictions might hinder co-operation in these cases, too, given the rigid structures and slow, cumbersome decision-making processes at HEIs and PROs.
These tensions can be further aggravated when the founding university/ PRO is constrained either by regulations or its own internal rules and norms in considering the business interests of the spin-off firms, and in finding a common ground between academic and business cultures. The goals and nature of RTDI co-operation between these types partners are driven by the business opportunities of the spin-off firm (what research capacities of the university/ PRO – including human resources – can be rented/ hired for joint projects).
2) Co-operation aimed at solving short-term, relatively simple technical problems
Most companies, even those using fairly basic production technologies, regularly face technical problems: a new material or component/ sub-system should be used, given an incremental innovation, or a new supplier; production costs should be reduced, products and/ or production processes/ methods should be improved at the request of a client, and thus new equipment should be added to the existing production lines, etc. Large companies tend to rely on their internal resources to perform these tasks. Small and medium-sized firms, however, are likely to seek external assistance, usually universities or colleges located nearby. There is an even stronger incentive to co-operate when public support is available to solve technical problems in a collaborative way.
3) Strategic, long-term R&D and innovation co-operation
Larger firms, pursuing to maintain their competitive edge, are more interested in co- operating with universities and PROs on strategic, long-term R&D projects to explore new technological opportunities, or breaking new grounds. In these cases firms can benefit from collaborating academic researchers who possess advanced S&T knowledge, and are
20
also embedded in international networks: firms thus can gain access to an extensive pool of knowledge. By sharing tasks and knowledge, firms can reduce the costs of research and better cope with scientific uncertainties. Moreover, several domestic and EU schemes promote this type of co-operation, further reducing costs.
As part of these long-term, strategic collaborations, firms also support PhD courses financially and/or offer PhD students relevant themes (projects) for their thesis. Besides the S&T results achieved by these projects, a major advantage for firms is that they can collect direct experience as to how these students work – how they solve problems, communicate and co-operate with team members, take the pressures from deadlines, inevitable failures, tensions with colleagues, etc. – and thus can make a better informed decision as to whom to employ, as opposed to the case when they can only rely on a few documents and interviews.
A broader form of co-operation is supporting tertiary education by donating modern equipment to universities. In that way firms can make sure that the next generation of engineers and scientists would be familiar e.g. with up-to-date measurement techniques and experienced in using other instruments/ techniques, which might not be available at universities without these co-operations.
This type of co-operation – and thus at least some of the elements mentioned above – can be of relevance for those small and medium-sized companies, too, for which gaining access to advanced S&T knowledge and new talents is of crucial importance.
This tentative taxonomy can – and should – be developed into a more detailed and better- substantiated typology. Depending on the objectives of further analyses, the following aspects can be used when refining it: the objectives, organisational form and duration of co- operation; types of participants (domestic vs. foreign universities and firms); major characteristics of the business participants (size, ownership, specific sectoral/ technological/
strategic features, etc.)
Even this tentative taxonomy is sufficient to stress that heterogeneous firms are faced with different needs, posses distinctive capabilities, set specific goals, and thus pursue different RTDI strategies. Hence, different forms and types of B-A co-operations can be observed, with specific goals and activities. STI policies, however, tend to neglect this diversity, and not only in Hungary. For example, major EU policy documents tend to mention only type 3) B-A collaboration, while type 2) ones are seem to be equally relevant in improving firms’ innovation performance and hence competitiveness (see e.g. EC 2013a, 2013b).
5 CONCLUSIONS, METHODOLOGICAL AND POLICY IMPLICATIONS
Mapping, understanding and promoting co-operation among the actors of innovations systems is at the forefront of interest of analysts and policy-makers in many countries. One of the major lessons of evolutionary economics of innovation has been that different types of
21
knowledge, skills and experience are required for successful innovation processes, and these elements are rarely possessed by single entities; rather, these are distributed among various actors. Hence, their co-operation is vital to integrate these elements to exploit them for economic and social ends.
Taking these observations as its starting points this paper has mapped business-academia collaborations in the EU countries by using various sets of statistics, as well as interviews conducted with firms in Hungary. Businesses contribute to the R&D funds used by universities and PROs by 6.3-6.8% of HERD and 5.7-8.9% of GOVERD at an aggregate EU27 level, but these ratios are notably higher in 10-12 EU countries, indicating intense B-A collaboration. As for sources of information for innovations, universities and PROs are less important for innovative firms in the EU countries than their own enterprise of other firms in their group, customers, suppliers, competitors and/or other firms in the same sector. As to innovation co-operation, almost in all countries the highest share of innovative firms report co-operation with suppliers and the other business partners (clients, competitors or other enterprises in sector, other enterprises within the enterprise group) are also significantly more frequently mentioned partners than academic organisations. In six countries, though, HEIs are among the top three co-operation partners when firms identify the most valuable method of co-operation. In contrast, PROs have that standing in a single country only.
Interviews have also been used to shed light on the dynamics and qualitative features (e.g.
motivations, incentives, strategic considerations) of B-A co-operation processes.
The results show that mapping these collaborations by using multiple methods and multiple sources of information can significantly improve the reliability and richness of our understanding, leading to both theoretical results (e.g. a thoroughly tested typology of B-A co-operations) and more effective STI policies.
Findings have also confirmed that (i) motivations, incentives for, and norms of, conducting RTDI activities diametrically differ in business and academia; and (b) different types of firms have different needs. Thus, more refined policy measures are to be devised to promote B-A collaboration more effectively, better tuned to the needs of the actors, based on a relevant taxonomy of RTDI collaborations.
Further, evaluation criteria for academics should also be revised to remove some major obstacles, currently blocking more effective B-A co-operation. Obviously, it would require sound analyses of a given higher education system, and then a thorough decision-preparatory process, involving major stakeholders, because quite naturally a fierce opposition is likely to arise from academics, given strong traditions at universities and PROs.
Interviews also suggest that in some cases collaborative projects had already been decided; i.e. an available support scheme has not oriented the RTDI activities of a given firm.
22
Moreover, several B-A collaboration projects would have been conducted without public support, too. In other words, additionality in the narrow sense has been fairly low. More detailed case studies would be needed to establish if additionality in the broader sense – the so-called behavioural additionality – can be observed. (Lipsey and Carlaw 1998; OECD 2006) It should be also stressed that consultancy firms specialising in identifying opportunities to obtain public support and drafting project proposals have played a major role in several Hungarian cases. Without them a number of firms would have not applied for public support.
Again, more thorough research, relying on a larger sample, would be needed to draw firm policy conclusions. So far, only diametrically opposite interpretations can be put forward as hypotheses. A) These consultancy firms play a useful role in ‘re-wiring’ and revitalising the Hungarian NIS: they disseminate vital information and build contacts among the interested players more efficiently than the responsible government agencies and other public (non- profit) organisations charged with these tasks. B) These consultancy firms pursue a special rent-seeking strategy, and appropriate some 10-15% of public funds meant to be used for advancing good causes (for the whole society).
Both the methodological and policy implications could be generalised beyond the cases considered in this paper, but the research design to analyse B-A collaborations and the concomitant policy recommendations need to be tailored to the innovation systems in question.
23 References
Agrawal A, Cockburn IM (2002) University Research, Industrial R&D, and the Anchor Tenant Hypothesis. NBER Working Paper Series 9212.
Arnold E, Busch N, Fayl G, Guy K (2007) Programme Monitoring at NKTH: Principles and a Pilot Exercise. report, NKTH, Budapest.
Arrow K (1962) Economic welfare and the allocation of resources for invention. In: Nelson RR (ed) The Rate and Direction of Inventive Activity. Princeton University Press, Princeton, NJ, pp. 609-625.
Balconi M, Breschi S, Lissoni F (2004) Networks of inventors and the role of academia: an exploration of Italian patent data. Research Policy 33: 127-145.
Balconi M, Brusoni S, Orsenigo L (2010) In defence of the linear model: An essay. Research Policy 39: 1-13.
Baumol W (2002) The Free-Market Innovation Machine: Analyzing the Growth Miracle of Capitalism. Princeton University Press, Princeton, NJ.
Baumol, W., Litan, R., Schramm, C. (2007) Good Capitalism, Bad Capitalism, and the Economics of Growth and Prosperity. Yale University Press, New Haven, CT.
Bergek A, Jacobsson S, Carlsson B, Lindmark S, Rickne A (2008) Analyzing the Functional Dynamics of Technological Innovation Systems: A Scheme of Analysis. Research Policy 37: 407–429.
Borsi B (2005) A vállalatok és kutatóhelyek közötti kapcsolatok innovációs hatása Magyarországon (The innovation impact of science and industry relations in Hungary).
Külgazdaság 49: 37-57.
Bush, V. (1945) Science: the Endless Frontier. U.S. Government Printing Office: Washington, D.C., http://www.nsf.gov/od/lpa/nsf50/vbush1945.htm.
Caraça J, Lundvall B-Å, Mendonça S. (2009): The changing role of science in the innovation process: From Queen to Cinderella? Technological Forecasting and Social Change, 76:
861-867.
Carlsson B, Jacobsson S, Holmén M, Rickne A (2002) Innovation systems: analytical and methodological issues. Research Policy 31: 233-245.
Carlsson, B. (2012) Knowledge Flows in High-Tech Industry Clusters. mimeo, Case Western Reserve University, Cleveleand, Ohio, USA.
Castellacci F (2008) Technological paradigms, regimes and trajectories: Manufacturing and service industries in a new taxonomy of sectoral patterns of innovation. Research Policy 37: 978-994.
Cowan R (2005) Universities and the Knowledge Economy. MERIT-Infonomics Research Memorandum series No. 2005-027.
D’Este P, Patel P (2007) University–industry linkages in the UK: What are the factors underlying the variety of interactions with industry? Research Policy 36: 1295-1313.
D’Este P, Guy F, Iammarino S (2011) Shaping the formation of university-industry research collaborations: what type of proximity does really matter? Papers in Evolutionary Economic Geography No. 11.06, Utrecht University, Urban & Regional Research Centre, Utrecht.
Di Stefano G, Gambardella A, Verona G (2012) Technology push and demand pull perspectives in innovation studies: Current findings and future research directions.
Research Policy 41: 1283-1295.
Dodgson M, Rothwell R (eds) (1994) The Handbook of Industrial Innovation. Edward Elgar, Cheltenham.
Dodgson M, Hughes A, Foster J, Metcalfe S (2011) Systems thinking, market failure, and the development of innovation policy: The case of Australia. Research Policy 40: 1145-1156.
24
Dosi G (1988) Sources, procedures and microeconomic effects of innovation, Journal of Economic Literature 24: 1120-1171.
Dosi G, Freeman C, Nelson RR, Silverberg G, Soete L (eds) (1988) Technical Change and Economic Theory, London: Pinter.
EC (2004) Innovation in Europe: Results for the EU, Iceland and Norway. Office for Official Publications of the European Communities, Luxembourg.
EC (2013a) Research and Innovation Performance in EU Member States and Associated Countries: Innovation Union Progress at Country Level. doi 10.2777/82363 http://ec.europa.eu/research/innovation-union/pdf/state-of-the-
union/2012/innovation_union_progress_at_country_level_2013.pdf.
EC (2013b) State of the Innovation Union 2012: Accelerating Change.
http://ec.europa.eu/research/innovation-union/pdf/state-of-the- union/2012/state_of_the_innovation_union_report_2012.pdf.
Edquist C (ed) (1997) Systems of Innovations: Technologies, institutions and organizations.
Pinter, London.
Edquist C (2011) Design of innovation policy through diagnostic analysis: identification of systemic problems or (failures). Industrial and Corporate Change 20: 1725-1753.
Ergas H (1986) Does Technology Policy Matter? Centre for European Policy Studies, CEPS Papers No. 29, Brussels.
Ergas H (1987) The importance of technology policy. In: Dasgupta, P., Stoneman, P. (eds):
Economic Policy and Technological Performance. Cambridge University Press, Cambridge, pp. 51-96.
Ernst & Young and GKI (2010a) Comprehensive assessment study about the operation of the Research and Technology Innovation Fund (KTIA) 01.01.2004 - 31.12.2009 – Executive summary. NKTH, Budapest.
Ernst & Young and GKI (2010b) A Kutatási és Technológiai Innovációs Alap 2004.01.01. – 2009.12.31. közötti működésének átfogó értékelése (Comprehensive assessment study about the operation of the Research and Technology Innovation Fund (KTIA) 01.01.2004 - 31.12.2009). NKTH, Budapest.
Etzkowitz H, Leysdorff L (2000) The dynamics of innovation: from National Systems and
‘Mode 2’ to a Triple Helix of university-industry-government relations. Research Policy 29: 109-123.
Fagerberg J, Mowery DC, Nelson RR (eds) (2005) The Oxford Handbook of Innovation.
Oxford University Press.
Fagerberg J, Fosaas M, Bell M, Martin B (2011) Christopher Freeman: social science entrepreneur. Research Policy 40: 897-916.
Fagerberg J, Fosaas, M., Sapprasert, K.(2012) Innovation: Exploring the knowledge base.
Research Policy 41: 1132-1153.
Feller I, Ailes CP, Roessner JD (2002) Impacts of research universities on technological innovation in industry: evidence from engineering research centers. Research Policy 31:
457-474.
Foray D (ed) (2009) The New Economics of Technology Policy. Edward Elgar, Cheltenham.
Freeman C (1987) Technology and Economic Performance: Lessons from Japan. Pinter Publishers, London.
Freeman C (1991) Networks of innovators, a synthesis of research issues. Research Policy 20:
499-514.
Freeman C (1994) The economics of technical change: A critical survey. Cambridge Journal of Economics 18: 463-514.
Freeman C (1995) The ‘National System of Innovation’ in historical perspective. Cambridge Journal of Economics 19: 5-24.