1
KAPOSVAR UNIVERSITY
THE DOCTORAL SCHOOL OF MANAGEMENT AND ORGANIZATIONAL SCIENCE
Head of the Doctoral School PROF. DR. IMRE FERTO, D.Sc.
Full professor
Supervisor
PROF. DR. ZOLTAN GAL, PhD
Head of the Department of Regional and Enviromental Economics
FOREIGN DIRECT INVESTMENT LOCATION DETERMINANTS IN INDIA: NATIONAL, SUBNATIONAL AND REGIONAL LEVEL
APPROACH
Author
DEVESH SINGH
KAPOSVÁR 2019
2 Table of Contents
1. BACKGROUND OF THE RESEARCH, OBJECTIVES ... 3
1.1 Research question: following research question derived on the basis of past literature ... 3
1.2 Practical justification of research ... 3
1.3 Research gap ... 4
1.4 Experiment location profile ... 7
2. MATERIALS AND METHODS ... 9
2.1 Tools and sources used in this research ... 10
3. RESULTS ... 12
3.1 Sample biasing result ... 12
3.2 Reliability and Robustness ... 15
3.3 Goodness of Fit ... 20
3.4 Logistic regression results summary ... 22
4. CONCLUSION AND RECOMMENDATION ... 26
4.1 Recommendation ... 27
4.2 New scientific outcome ... 28
5 ARTICLE PUBLICATION ... 32
3
1
. BACKGROUND OF THE RESEARCH, OBJECTIVES
Foreign direct investment location choice is an attractive topic between the practitioner and research scholar from the last three decades due to the significant importance of international business in modern globalization era to find out the answer where to invest and how to select business operation location for Foreign Direct Investment (FDI).
In an international business context, most of the research conducted on the developed nation and few of them are on developing nation and out of them the developing nation studies are focused mainly in China’s region in best of author knowledge and literature review couldn’t find the research on the Indian context.
1.1 Research question: following research question derived on the basis of past literature
1. Find out the FDI location determinant at the national, sub-national and regional level, for instance, this region is India, Karnataka and Bangalore?
2. Examine the location determinant, whether it differs at the national, sub-national and regional level?
3. Why do the international firms select a particular region for investment and operation rather than other location?
4. What are the practical implications of location determinants for managers, central and regional governments?
1.2 Practical justification of research
The practical explanation of present research draws the attention toward the failure and success of firms, based on the necessary element of location selection criteria and business performance of the firms in a competitive environment. This thesis has been following practical justification:
4
1. This research presents the rich, comprehensive and gainful significant variables of the successful location requirements for international investor’s business expansion in India.
2. Providing a better tool of location selection with significant elements, which efficiently work on the Indian international investment environment.
3. This research will deliver recommendations to the local authority to improve the location facility at the city level. So, more and more foreign investors may invest in that area.
4. The central government can use this research to understand, which variables are necessary to attract the FDI and in which area government is lagging behind. Furthermore, it presents the idea for a policymaker to understand the international investment requirement for location choice. So, this research will help to make the policy makers to lure foreign investors.
1.3 Research gap
Karnataka region has been neglected and ignored by the researchers and practitioners, although it is the “Silicon Valley” of India. However, the existing literature on FDI location decision is jumbled the country selection determinant and the regional location determinant for establishing the operation unit in the host country. In addition, the literature on FDI location decision is based on either regional or firm-based. So, the existing literature failed to give a clear view whether there is any difference in the selection of country and regional location for FDI.
In literature review, we explained mainly FDI related theories and divided into two parts classical trade theories (theory of mercantilism, absolute advantage theory, comparative advantage theory and factor proportion theory) and
5
modern theories (country similarity theory, product life cycle theory, new trade theory and comparative advantage theory). At the end of the literature, review thesis explain the relationship between trade theory and location theory. The objectives of dissertation, research proposed the hypothesis for our experiment area India (nine hypotheses related to the country), Karnataka (five hypotheses for sub-national level) and Bangalore city (four hypotheses at the regional level) in addition, research gives variable justification with reference of other researchers further, the thesis explains the experiment area location profile, research process flow, tools and material and length of survey.
Figure- Commulative percentage of FDI inflow in India sector wise April 2000 to June 2018
Source: India stat compiled by the author.
0 5 10 15 20
Services Sector Infrastructure & Constr.
Computer Software & Hardware Telecommunications Trading Automobile Industry Drugs & Pharmaceuticals Chemicals
Power Hotel & Tourism Metallurgical Industries Food Processing Industries Electrical Equipments Information & Broadcasting Petroleum & Natural Gas Non-Conventional Energy Cement and Gypsum Products Hospital & Diagnostic Centres Industrial Machinery Consultancy Services
FDI in %
6
The distribution of FDI by different sectors and their respective shares for India are presented in figure 1. Between April 2000 and June 2018, core service industry (Finance, banking, insurance, non-finance/business, outsourcing, R&D, courier, tech. testing and analysis, Other) attracted the maximum FDI 17.61 per cent, followed by construction and infrastructure computer software and hardware and telecommunications. The trading, automobile industry chemicals power, hotel and tourism, metallurgical industries and food processing industries also contributed significantly. The rough estimation of sector-wise FDI indicates that the services sector attracted a higher amount of FDI and followed by manufacturing. Agriculture Services contributed 0.52 percentage of FDI inflow from April 2000 to June 2018 which included in figure 1 others.
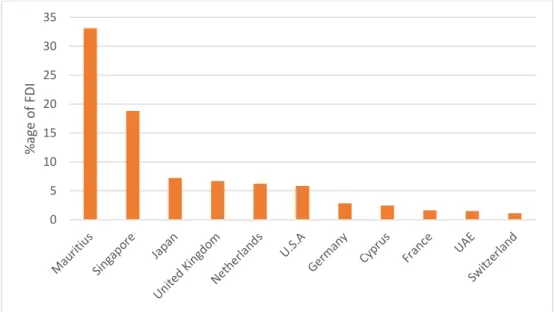
Figure 2 Cumulative percentage of FDI inflow in India from different countries April 2000 to June 2018
Source: India stat Compiled by author.
From figure 2 Mauritius was the top source of FDI inflow into India over 2000–
2018 and the source of over 33.13 % of the total FDI inflow into India. There
0 5 10 15 20 25 30 35
%age ofFDI
7
are two reasons for the huge inflows of FDI first is most business persons in Mauritius are of Indian origin and second India’s double taxation treaty with Mauritius, which facilitates tax-free inflows into India if investors inflow investment through Mauritius. Even Indian investors also inflow money through Mauritius because there is loophole exist in double taxation avoidance agreement, means investment once taxed in Mauritius can't be taxed again in India. Although this investment rout of inflow of FDI is diverted time to time through Singapore because of the same reason, “treaty shopping” and NRI investments. After Singapore, USA has emerged as the third largest investor in India after 2010 but overall from 2000-2018 U.S.A have just 5.84 per cent of total FDI. The other investor in India followed by Japan and the other developed countries like the UK, the Netherlands, Germany, Singapore, and France, which are India’s major trading partners.
1.4 Experiment location profile
Karnataka is the eighth largest state in the country both in terms of population and area, and it is the fastest emerging economies in India. In India, approximately 50 % State Domestic Product (SDP) comes from the IT sector.
This state impressed with 26 % contribution of industrial base in SDP. The ICT cluster was started to develop in India after the 1970s. The major boost was brought up by the R. K. Baliga, the first managing director and chairman and of Karnataka State Electronics Development Corporation. The literature presented FDI inflows to Karnataka from 1991 to 2015 reveals that in the initial period of liberalization USA (United States of America) was the top country which invested in Karnataka followed by UK (United Kingdom) and Japan.
Karnataka has been rising as one of the major technology destinations in the country as well as in the world and known as the ‘IT capital of India’, Bangalore put Karnataka on the global IT and technology map.
8
Figure-3 Total cumulative % of FDI inflow in India from the top seven states April 2000- June 2018
Source: Data collected from India stat and compiled by the author.
From figure 3, Bangalore is on the third position to receive FDI in India and emerged as a leading destination for FDI inflows because of eas availability of skilled labour, infrastructure and natural resources, which assure the investors to get the proper return for the capital employed.
0 5 10 15 20 25 30 35
Mumbai New Delhi Bangalore Chennai Ahmedabad Hyderabad Kolkata
commulative % of FDI inflow
9
2. MATERIALS AND METHODS
From figure-4, shows the process flow of research and it started with the theoretical framework where we review the researches related with the FDI location choice. After the collection of literature, unique objectives were created for research and based on these objectives, in next step secondary data was collected from the Bloomberg database.
Figure 4 Process flow diagram
Source: author vizulization.
Once the collection of stakeholder data process is finished, to make the hypothesis, we divided the hypothesis in 3 level, country, state and city in our
10
case it is India, Karnataka and Bangalore. This thesis collected data from 109 enterprises for FDI location choice in Bangalore to know the point of view for the country, state and city level in the matter for FDI location selection. The stakeholder in this research for data collection are the managers, HR, companies research analyst and other decision makers which are contributing to the company decision process. Further, we proceed with this research with the following steps mentions in figure 4 to get the final conclusion.
2.1 Tools and sources used in this research
This research used the IBM SPSS 25.0 version to analyze the data. This thesis collected the company information which invested in India during 1992-2018.
The Bloomberg terminal access is used from Corvinus University central library. The keyword used to search the information from Bloomberg database was “Merger and Acquisition” “Joint Ventures” and “Investment” in India.
Total of 600 company’s information was extracted from the terminal. Once the basic information of foreign investors in India is collected, we refine the data and extracted the companies which invested in Bangalore. After that, we approach companies HR, data analyst, managers or other higher authorities who have the company’s information through the email. The emails are collected through the company’s official websites and India’s registrar of companies (ROC) official database.
For data collection, request email sent to the respondent to take participate and used the Google form survey platform, to collect the respondent data. Connect through the email to the respondent for participating in the survey has extra merits and benefits, compared to the traditional way of doing the on-ground survey. According to literature, the computer-based survey is created less distorted noise in samples because the respondent gets the flexibility of time to fill the questioners. We tested the average time to fill research questioner, the average time to fill the questioner is 17 minutes. After collecting the data
11
from a respondent in the first wave a, a reminder is sent to the respondent in the second wave to enhances the response rate. The literature presented that 2nd, 5th, 23rd day reminder increases the response rate in his research and sending the reminder successfully increase the response rate. Total 600 company’s secondary data were collected from the Bloomberg but due to discontinuity in data, this thesis includes a total 400 companies. Out of 400 total, 115 firms participated in this research, from the 115 responses this research finally included 109 companies, other six samples were rejected due to the discontinuity of data.
12
3. RESULTS
Check the responses biases we performed the Mann-Whitney therefore, responses divided into two waves early responses and late responses. Next step was the reliability tests for robustness, Cronbach’s alpha is a prominent method to measure reliability and checked the of the determinant. Afterwards from reliability test, the main experiment is started with logistic regression. In this process first, we perform the Goodness of fit with Hosmer and Lemeshow Test.
The goodness of fit was considered if significance values greater than 0.5.
After successful completion of result and their evaluation. Further, we progress to the conclusions and recommendations this part describing the significance of a hypothesis with the support of references and continue with the recommendation for central and state government in India and Managerial implication. At the end of the thesis describe the uniqueness of the research and new scientific result.
3.1 Sample biasing result
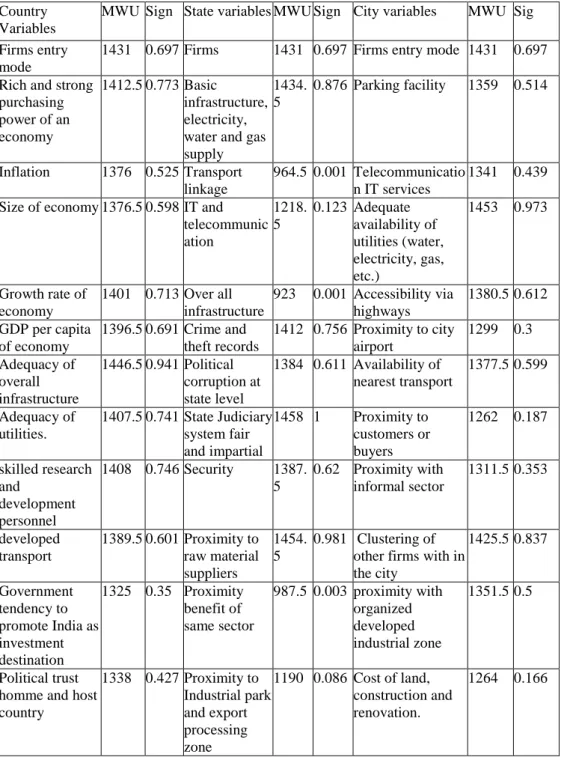
To check the sample biasing, we used the Mann-Witney test which, best fits with the Likert scale, see table 1. Since data measured on the Likert scale, so we adopted the non-parametric test for checking any kind bias in this research.
Addressing non-response bias through Mann-Whitney like another study research divided the data between early and late response which is the best strategy to check the biasing. Perform Mann-Whitney test samples divided into two waves, the first wave included the first 54 respondents who responses early and second wave another 54 respondent who response late. From table 1 although, the single variable for a country like bureaucracy, efficient workforces and access to finance for the state it is transported linkage, overall construction, proximity business and industrial law and city level, availability of insurance is a significant value less than 0.05. This showed that however bias in the response may exist in the single variable response but overall, it
13
could affect the determinant which being studying in this thesis. So, in this research, we can move further for the reliability test to checking variables robustness and model of fittest.
Table 1 Sample biasing Mann-Whitney U test Country
Variables
MWU Sign State variables MWU Sign City variables MWU Sig Firms entry
mode
1431 0.697 Firms 1431 0.697 Firms entry mode 1431 0.697 Rich and strong
purchasing power of an economy
1412.5 0.773 Basic infrastructure, electricity, water and gas supply
1434.
5
0.876 Parking facility 1359 0.514
Inflation 1376 0.525 Transport linkage
964.5 0.001 Telecommunicatio n IT services
1341 0.439 Size of economy 1376.5 0.598 IT and
telecommunic ation
1218.
5
0.123 Adequate availability of utilities (water, electricity, gas, etc.)
1453 0.973
Growth rate of economy
1401 0.713 Over all infrastructure
923 0.001 Accessibility via highways
1380.5 0.612 GDP per capita
of economy
1396.5 0.691 Crime and theft records
1412 0.756 Proximity to city airport
1299 0.3 Adequacy of
overall infrastructure
1446.5 0.941 Political corruption at state level
1384 0.611 Availability of nearest transport
1377.5 0.599
Adequacy of utilities.
1407.5 0.741 State Judiciary system fair and impartial
1458 1 Proximity to customers or buyers
1262 0.187
skilled research and
development personnel
1408 0.746 Security 1387.
5
0.62 Proximity with informal sector
1311.5 0.353
developed transport
1389.5 0.601 Proximity to raw material suppliers
1454.
5
0.981 Clustering of other firms with in the city
1425.5 0.837
Government tendency to promote India as investment destination
1325 0.35 Proximity benefit of same sector
987.5 0.003 proximity with organized developed industrial zone
1351.5 0.5
Political trust homme and host country
1338 0.427 Proximity to Industrial park and export processing zone
1190 0.086 Cost of land, construction and renovation.
1264 0.166
14 Adequacy of
investment friendly policy
1379.5 0.605 Proximity to customers or employee
924 0.001 Rent cost 1342.5 0.404
Policy
Stability/Instabil ity
1311 0.343 Ease of industrial laws
811.5 0 Availability of low cost labour
1277 0.233
Location benefits with neighbor country
1409 0.657 Environment permission
1228.
5
0.13 Logistic cost within the city
1395 0.685
Neighbor country market
1358 0.469 Financial incentives and rebates
1381 0.568 Regional economic environment
1247.5 0.097
Geographic proximity between India and parent firm’s country
1295 0.245 State judicial system
1251.
5
0.181 Innovation and technology spillover
1289.5 0.248
Employees loyalty to the company
1285.5 0.235 Tax
administration regulatory framework
1452 0.969 Labor market efficiency
1278.5 0.222
Adequacy of ethical employees
1424 0.815 Availability of
credit from regional bank
1241.5 0.134
Ethical business environment
1404 0.701 Availability of
Insurance
1062 0.006 Bureaucracy and
red tape
598 0 Efficient
regulatory framework
644 0
National judiciary system
1113.5 0.028 Size of local
market
1404 0.723 Future Growth
and
development of parent firms in host country
1407.5 0.732
Increase the product line
1414 0.772 Adequacy of
market information
1444 0.927
Follow the other competitors
1392 0.677 Follow firms in
complementary sector
1179 0.073
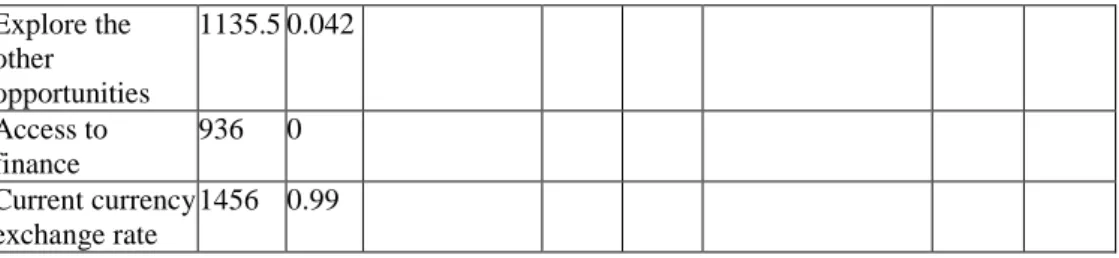
15 Explore the
other opportunities
1135.5 0.042
Access to finance
936 0 Current currency
exchange rate
1456 0.99 source: compiled by the author.
3.2 Reliability and Robustness
Cronbach’s alpha is a prominent method to measure reliability an important character of alpha is, alpha value tends to increase with increase the items in the scale. So, this thesis we used Cronbach’s alpha to test the internal consistency and reliability. Other literature shows that the value 0.6 is sufficient threshold value to pass the reliability test. Cronbach’s alpha differs from 0 to 1, value from less than 0.6 is unsatisfactory internal consistency and reliability but greater than 0.6 it is satisfactory. So, this thesis using the 0.6 minimum threshold criteria for significant reliability.
Table 2 Reliability Test Country Oriented Factors
Variables
Cronbach's Alpha if Item Deleted
Corrected Item-Total Correlation
Cronbach' s Alpha
N of Items
Economic Factors 0.827 5
Rich and strong purchasing power of economy
0.759 0.732
Inflation 0.809 0.677
Size of Economy 0.790 0.647
Growth rate of economy 0.789 0.635
GDP per capita of economy 0.810 0.571
Infrastructure 0.739 4
Adequacy of utilities. ex- electricity, water, sanitation
0.683 0.560
16 Adequacy of telecommunication and IT services
0.636 0.525
Adequacy of developed transport 0.722 0.603 Adequacy of overall infrastructure 0.665 0.459
Political Factors 0.747 4
Government tendency to promote India as an investment destination
0.740 0.510
Political trust between India and the parent firm’s country
0.655 0.732
Adequacy of investment friendly policy 0.555 0.751
Policy Stability/Instability 0.778 0.358
Proximity with neighbour country 0.811 3
Location benefits with neighbor country 0.812 0.587 Adequacy to access to the neighbour country
market
0.569 0.811
The geographic proximity between India and the parent firm’s country
0.800 0.603
Social Factors 0.755 3
Employees loyalty to the company 0.467 0.744 0.755 3
Adequacy of ethical employees 0.681 0.587
Ethical business environment 0.772 0.541
Institutional administration 0.821 3
Bureaucratic institution. ex FIPB, RBI, CVC 0.594 0.818 Regulatory framework boundation 0.568 0.842
National judiciary system 0.973 0.419
Market Factors 0.634 4
Size of local market 0.652 0.270
Future Growth and development of parent firms in the host country
0.476 0.523
Increase the product line 0.576 0.403
Accessible market information 0.523 0.487
Global Competition Factors 0.775 3
Follow the other competitors 0.572 0.716
17
Follow firms in complementary sector 0.769 0.541 Explore any other opportunities due to
globalization
0.728 0.582
Finance 0.693 2
Access to finance facility . 0.531
Current currency exchange rate . 0.531
Source: compiled by the author.
The table-2 showing the reliability test for country-oriented factors. The second row represent Cronbach's Alpha if Item deleted, we can see all value in column second is near to Cronbach's Alpha value. Therefore, all variables are contributing the to experiment effectively. The last determinant finance didn’t show any value because it contains only two variables. The second column shows the correlation between the variables for a particular determinant for instance economic determinant, GDP per capita has minimum correlation value 0.571, same as we can see other variables. Therefore, we can consider that all variables for country-oriented factors are pass the reliability test.
Table 3 Reliability Test States Oriented Factors
Variables
Corrected Item-Total Correlation
Cronbach's Alpha if Item
Deleted
Cronbach's Alpha
N of Items
State Infrastructure 0.732 4
Basic infrastructure, electricity, water and gas
supply 0.238 0.814
Transport linkage 0.687 0.569
Information and communication technology
and IT services 0.689 0.573
Overall infrastructure development in the state 0.522 0.673 Corruption
Crime and theft records 0.51 0.769 0.782 4
Political corruption in state 0.688 0.679
18 State Judiciary and municipal system fair and
impartial 0.726 0.65
Industry agglomeration 0.459 0.788
Intra Industry agglomeration
Proximity to raw material suppliers 0.219 0.8 0.716 4
Proximity benefit of the same sector 0.668 0.547 Proximity to Industrial park and export
processing zone 0.682 0.542
Proximity to customers and buyers 0.489 0.664
State Investment Incentives 0.71 3
Ease of industrial laws 0.47 0.694
Environment permission 0.562 0.579
Financial incentives and rebates 0.556 0.586
State Institutional Administration .615 3
State judicial system
.477 .439
Tax administration regulatory framework .617 .271 Overall state Institutional system partial and
fair (ex. Combination of Municipal and local police etc.)
.241 .806
source: compiled by the author.
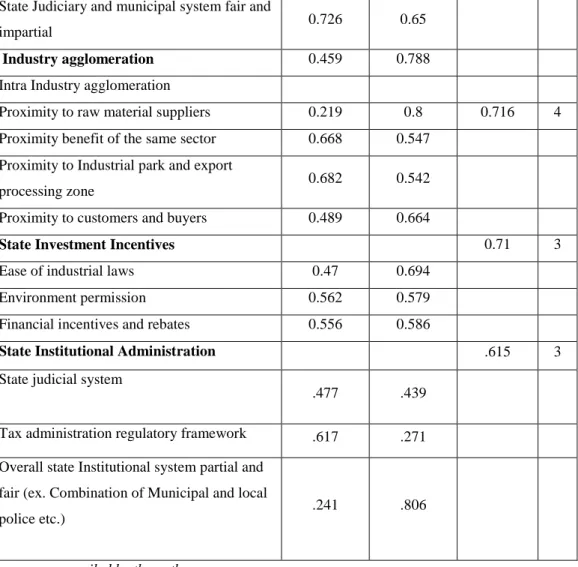
Table 3 presenting the reliability test for states-oriented factors there is five- determinant related to the state-oriented FDI location choice. From table-3 all variables within the determinant positively correlated with each other.
Proximity to raw material and suppliers have the lowest correlation value 0.219. This variable has alpha value 0.8 which is higley contributing determinant. State institutional administration has the lowest Cronbach's Alpha value 0.615 but overall it passes the threshold level 0.6 criteria. We can consider all variables related to state pass the robustness test.
19 Table 4 Reliability test city-oriented factor
Variables Corrected Item- Total Correlation
Cronbach's Alpha if Item Deleted
Cronbac h's Alpha
N of Items
City Infrastructure 0.604 6
Parking facility .295 .576
Availability of telecommunication IT services
.342 .560
Adequate availability of utilities (water, electricity, gas, etc.)
.396 .536
Accessibility via highways .174 .622
Proximity to the city airport .627 .400
Availability of nearest transport .211 .609
Regional Agglomeration 0.790 4
Proximity to customers and employee
0.326 0.851
Proximity with informal sector 0.727 0.669 Clustering of other firms within the
city
0.744 0.659
proximity with an organized developed industrial zone
0.624 0.726
Cost Factors 0.769 4
Cost of land, construction and renovation.
0.718 0.634
Rent cost 0.598 0.699
Availability of low-cost labour 0.745 0.62
Logistic cost within the city 0.286 0.863
Regional Competitiveness 0.726 3
Regional economic environment 0.627 0.54
Innovation and technology spillover in the city. ex-Silicon Valley
0.574 0.605
Labor market efficiency 0.45 0.748
Regional Finance Facility 0.785 2
20 Availability of credit from a
regional bank
0.643
Availability of Insurance 0.643 Source: compiled by the author.
From table 4 infrastructure has the lowest alpha value 0.604 but greater than our threshold level. Regional agglomeration has the highest alpha 0.790 in city- oriented factors. So, all city-oriented variables pass the reliability test.
Overall for summarizing the reliability test for the national, sub-national and regional level. The variable at the national level has nine determinant and 31 independent variables which represent the national level FDI location choices criteria, the sub-national level has five determinant and 18 variables which reflect the Karnataka’s foreign investment location related variables and for Bangalore first column shows five determinants with nineteen variables for city-level FDI location choice. From the column, corrected item, total correlation and Cronbach's Alpha item if deleted we can say that all variables in the research are contributed effectively, there is no need to omit any variables. The fourth column representing the Cronbach's Alpha, threshold criteria for considering the reliable determinant. From table 2,3 and 4 we can see that all determinants have the Cronbach’s alpha value greater than 0.6 which we want in this research. Therefore, all determinants passed the reliability test and we can perform the goodness of fit test.
3.3 Goodness of Fit
Hosmer and Lemeshow test are considered more robust than a traditional omnibus test, therefore this test is often preferred over the omnibus test as an overall test of the model.
21 Table-5 Goodness of fit Hosmer and Lemeshow test
Country Chi- square
Sig. State Chi-
square
Sig. City Chi-
square Sig.
Economic
Factor 8.03 0.43 State
Infrastructure 2.06 0.96 City
Infrastructure 3.15 0.92 Infrastructure 1.41 0.97 Corruption 2.79 0.83 Regional
Agglomeration 3.88 0.87 Political Factors 3.65 0.82 Industrial
agglomeration 2.23 0.97 Cost Factors 5.06 0.75 Proximity with
neighbor country
2.36 0.67 State Investment
Incentives 2.87 0.94 Regional
Competitiveness 2.11 0.91
Social factors 5.85 0.44 State Institutional
Administration 4.49 0.81 Regional
Finance Facility 0.57 0.9 Bureaucracies 8.24 0.31
Market 9.3 0.32 Global
Competition 9.91 0.27 Finance 7.58 0.48 source: compiled by the author.
The significant value near to 1 represent the better goodness of fit test in table- 5 and this test is stricter than other tests. Probability is computed based on chi- square distribution for the logistic model. The goodness of fit is considered if the significance value is higher than 0.5 which we want in this research. The greater significance value leads to rejecting the null hypothesis, so if there is no difference between observed and model-predicted values, this implying that the model's estimates fit the data at an acceptable level.
Hosmer and Lemeshow test the model predictability for infrastructure at the national, subnational and regional level is high, the value of model predictability for infrastructure determinant at the national, subnational and regional level is 97,96 and 92 per cent respectively from table 5.
22 3.4 Logistic regression results summary
We wanted to predict the dicthomus variables with the help independent variables. Binary logistic regression is the perfect methodology for describing the relationship between a dependent or response (Joint ventures =0 and foreign wholly owned=1) variables and a set of independent (predictor or explanatory) variables.
Table 6 regression results
Determinant Hypothesis
Result supported by another imperial study
Sign. Influence
Economic
H1: Economic growth has a positive influence on FDI, to select the country as an investment
destination.
(Alfaro 2013;
Borensztein, J. De Gregorio, and Lee 1997; Carkovic and Levine 2002; Zoltan.
Gal and Andrea 2017; Prasad, Rajan,
and Subramanian 2007 )
Insignificant Positive
Infrastructure
H2: Infrastructure has a positive influence on FDI, to select the country as an Investment destination.
H10: State’s infrastructure has a positive influence on FDI to select the states as an investment destination.
H 15: City’s infrastructure has a positive influence on
(Asiedu 2002; Liu 2009)
Insignificant
Insignificant
Negative
Negative
23 FDI, to select the cities as an investment destination.
Insignificant
Negative
Agglomeration
H12: Industrial agglomeration in the state, has a positive influence on FDI, to select the states as an investment destination.
H 16: Industrial
agglomeration in the city, has a positive influence on FDI, to select the cities as an investment destination
(Guimarães, Figueiredo, and Woodward 2000;
Head, Ries, and Swenson 1995)
Insignificant
Significant
Positive
Positive
International politics in India
and corruption in Karnataka
H3: Political factors a have a negative influence on FDI, to select country as an investment destination.
H11: Corruption in states, has a negative influence on FDI, to select the states as an investment destination.
(Root and Ahmed 1979; Schneider and
Frey 1985; Singh et al. 1995; Wheeler
and Mody 1992)
Insignificant
Insignificant
Positive
Negative
Proximity between countries
H4: Proximity between countries has a positive influence on FDI, to select the country as an
investment destination.
(Jordaan 2004;
Rasciute and Downward 2017)
Insignificant
Negative
Social factor
H5: Social factors have a positive influence on FDI, to select the country as an investment destination.
(Bhardwaj, Dietz, and Beamish 2007;
Dunning 1998; Mac- Dermott and Mornah
2015; Sathe and Handley-Schachler
2006)
Insignificant
Negative
24 Institutional
administration
H6: National institutions’
administration has a positive influence on FDI to select country as an investment destination.
H14: State’s institutional administration have a positive influence on FDI, to select the states as an investment destination.
(Ali, Fiess, and MacDonald 2010;
Walsh and Yu 2010)
Significant
Insignificant
Positive
Positive
Market factors
H7: Market factors have a positive influence on FDI, to select the country as an investment destination.
(Akhtar 2014;
Arshad 2012; Li and Park 2006; Liu
2009)
Insignificant
Negative
Global competition and Regional competitivenes
s
H8: International competition has a positive influence on FDI, to select the country as an investment destination.
H18: Competitiveness in the city have a positive influence on FDI, to select the cities as an investment destination.
Anand and Kogut (1997), James R.
Markusen (1997), Jones and Wren (2006) and Miyake
and Sass (2000)
Significant
Insignificant
Positive
Positive
Finance
H9: International finance has a positive influence on FDI to select the country as an investment destination.
(Desbordes and Wei 2017; Feenstra and
bruce 1996; Froot and Stein 1991)
Insignificant
Positive
25 H19: Finance development in the city has a positive influence on FDI, to select the cities as an investment destination.
Significant
Positive
The cost factor in the city
H17: High-cost factors in the city has a negative influence on FDI, to select the cities as an investment destination.
(Holl and Mariotti 2018; Loree and Guisinger 1995;
Wheeler and Mody 1992)
Insignificant Positive
States investment
incentives
H13: State’s investment incentives have a positive influence on FDI, to select the states as an investment destination.
(Brewer 1992;
Pradhan 2000) Significant Positive
Source: created by author from logistic regression results.
Description of logistic regression, we used the model predictability by odds ratio. The impact of predictors is usually explained in terms of odds ratios, which is the key effect size in this thesis. With the help of logistic regression in this research we checked the probability of getting (successful occurrence of the event) foreign wholly-owned firms with the association of predictors.
The following table 6 help to make the conclusion for the hypothesis which we have to discuss in the conclusion part.
26
4. CONCLUSION AND RECOMMENDATION
Analysis shows that the country determinant viz. institutional administration and global competition has a significant impact in India for FDI location choice, another side at the state level, states government investment incentives has significant impact on Karnataka to select an investment destination and for Bangalore regional agglomeration and regional finance facility has significant impact at city level to select Bangalore as final investment destination for foreign investment.
4.1 Conclusion
The determinant national institutional administration has a significant effect on FDI location choice with the individual variables viz. bureaucratic procedure and red tape, efficient regulatory framework and national judiciary system. National institutional administration has a huge impact on FDI location choice. In India, FDI project need clearance from both state and central government which involves many bureaucratic procedures and it is a complex matter between central and state to finalize the policy and synchronization the bureaucracy procedure, FDI project passes through the multiple steps from both bureaucracies. There are few steps which cause the delay of FDI projects viz. building plan approval, power connection, land use change and land acquisition. Therefore, coordination on these issues between the centre and the states cause unnecessary delays at the center and state level. Global competition market is imperfectly competitive and countries, with identical taste and technology, to achieve the economies of scale traded each other and India is benefiting from this global competition. In research, we found that every one-unit increment of global competition foreign wholly-owned firms prefers to invest in India 22.458.
27
State Investment Incentives is a significant factor for the FDI location choice.
However, India has a federal system and states have their own responsibilities and control over many subjects that affect investment, direct rebate, environment permission, land acquisition and ease of industrial law can help the state government to hike the FDI. So, improvement in incentives, directly causes 72.85 times more likely to increase the chances to select states for FDI projects. Agglomeration of industries either it is industry specific or sector based and foreign or domestic agglomeration both impact the FDI location choice. We found in our research improve in agglomeration boost the FDI location choice 724.548 more likely. In India agglomeration is mainly product specific and industry-specific like “Aligarh” is famous for lock production and
“Bareilly” is famous for bamboo furniture production. To support these agglomerated industries financial facility is important as like as “blood for the human body”. Credit from the regional bank and insurance is the main component for financial development at the regional level which impact the foreign wholly-owned firm’s location choice decision
4.2 Recommendation
For the central government, the key factors for the FDI investment are related to economic, political, global competition, institutional administration, market and social factors. Therefore, the empirical result from the research has some practical implication for the central government. central government should have carefully made the policy framework which strongly promotes the economic activity in India. Since India is benefitting from the global competition. It has a positive impact on Indian FDI investment. Foreign investors trying to explore the new market for the growth of the firms. India can be the best option for international investment, to cash this opportunity.
Indian government should have to understand which determinant is most effective for India to popularize as attractive location choice for FDI. Political
28
factors, institutional administration and finance is the most valuable determinant which drives the foreign investors to select India as an investment destination.
This research recommended to the state government should have improvised the overall infrastructure in Karnataka. Increasing population migration and shortage of basic facility resulted in the lack of basic infrastructure viz.
electricity, transport linkage and telecommunication. The infrastructure and corruption determinant negatively contributed to FDI location choice in the Karnataka region. These determinants are not driven by the FDI investment in Karnataka. So, the government should have to improvise the policy, that these variables will contribute possible in future to attract FDI. State government should consider the other positively significant discovered location variables (State investment incentives in Karnataka and regional agglomeration in Bangalore) in policy making to attract more FDI in Karnataka.
This research suggests three major location selection made at national, subnational and regional level (India, Karnataka, Bangalore). The enhanced understanding of the FDI location determinants provided by this research has important implications for the FDI location choice in India for managers of MNCs, firm’s decision makers, CEO and CTO. The FDI location determinant from this research explores important factors, in the quest to choose optimal FDI location for business operation by identifying the determinant which successfully contributing to location selection at country, state and city.
Decision makers can develop strategies to enter in host countries and select this research determinants for successful location for business operation.
29
5. SCIENTIFIC OUTCOME
Based on the logistic result the following scientific result has been drawn from logistic regression table at the national, sub-national and regional level.
5.1 National Institutional administration
Every unit increase of bureaucratic procedure chances to select foreign wholly-owned firms, India as an investment destination increase 5.393 times more likely.
When the national judiciary system improves, foreign wholly-owned firms are 0.634 times less likely to invest in India.
Every unit increase of efficient regulatory framework chances to select foreign wholly-owned firms, India as an investment destination decrease 0.2 times less likely.
Overall national institution administration has a positive impact. The national institution at administration improves chances to select foreign wholly-owned firms India as an investment destination by 163.998 times more likely.
5.2 Global Competition
Foreign wholly-owned firms in India negatively influence by other competitors in India. The variable “follow the other competitors” has a negative impact to select India as an investment destination and it influence 0.676 times less likely
The complementary sector has a positive impact on FDI location choice at the national level. Increment in the variable “follow a firm in a complementary sector”, foreign wholly-owned firms 1.388 times more likely to select India as an investment destination.
30
Since India is a growing market, investor tries to explore the new opportunity for continuous growth, we can see the evidence through this thesis. Foreign wholly owned firms 1.065 more likely to invest in India if the variable “explore the other opportunities in India” increase.
Overall global competition positively impacts the Indian FDI location choice decision. Progress in global competition, chances to select foreign wholly-owned firms India as investment destination increase by 22.458 times more likely.
5.3 State Investment Incentives
Ease of industrial laws influence the foreign wholly-owned firms, 0.947 times less likely to choose Karnataka as an investment destination.
Increment in Environment permission, influence 0.355 times less likely to select Karnataka as an investment destination.
State investment incentives have a positive impact on FDI location choice at the subnational level. Increment in state investment incentives, chances to select Karnataka as investment destination increase by 72.85 times more likely.
5.4 Regional Agglomeration
Proximity to the supplier in Bangalore influence the chances to select the foreign wholly-owned firms 0.802 times less likely.
Proximity in informal sector positively influences the foreign wholly- owned firm’s location selection decision in Bangalore city. Firms want to locate the facility near to the supportive industries. Every unit increment in variable “Proximity with informal sector” chances to select Bangalore as an investment destination 1.438 times more likely.
31
Foreign investors positively influence the clustering of other firms within the city. Every unit increment of clustering in Bangalore, chances to select Bangalore city as FDI location destination increase by 1.487 times more likely.
Bangalore has more than 50 small and big IT park and industrial zone they positively affect the foreign investment. Firms try to relocate within this developed zone, we can observe the evidence from this thesis. Every increment in variable “proximity with organized developed industrial zone” increase the chances to choose Bangalore as investment destination 0.284 times more likely by foreign wholly- owned firms.
Overall regional agglomeration has a positive influence on FDI location choice. We can see evidence through this thesis. Every unit increment in regional agglomeration increase the chances to select Bangalore as an investment destination 724.58 times more likely.
5.5 Regional Finance Facility
Improvement in the availability of credit from a regional bank, chances to select the local area for the company’s operation by 1.840 times more likely.
Local insurance risk in the city, negatively influence the foreign wholly-owned firms by 1.393 times less likely.
Broadly we can say that the regional finance facility positively affects the FDI location choice decision. We can conclude from our result every unit increment in regional finance, chances to select area as an investment destination by foreign investor 229.658 times more likely.
32
6 ARTICLE PUBLICATION
Publication on thesis topic:
Devessh Singh (2018): India’s outward and inward foreign direct investment – post liberalization period,Társadalomtudományi folyóirat A Virtuális Intézet Közép-Európa Kutatására Közleményei (ISSN: 2064-437X), pp 87-94.
Devesh Singh, Dr.Zoltán Gál (2018): Industrial agglomeration and location choice in service sector: case of India, The Central European Journal of Regional Development and Tourism, SCOPUS,(ISSN:1821-2506 ),pp-88-105 Devesh Singh (2019): Determinant of innovation and its impact on foreign direct investment: Context of Europe, Researchers World – Journal of Arts, Science & Commerce, (E-ISSN 2229-4686 , Print ISSN: 2231-4172 ),pp-1-11 11.2 Off topic publication
Devesh Singh, Zoltán Gál, Raqif Huseynov, Michal Wojtaszek (2018):
Determining the Performance Measurement of SME from Economic Value Added: Study on Hungary, Somogy County, Scientific Journal Warsaw University of Life Sciences (ISSN 2081-6960eISSN 2544-0659),pp-270-279.