Because of the similarity between the areas, it is worth applying methods well-proven in autonomous vehicle research to mobile machine automation problems. I am currently an assistant researcher at the Department of Material Handling and Logistics Systems at the Budapest University of Technology and Economics.
The Topic
Highlights in the Related Area
Research Goals
An important goal of layout planning is to ensure continuous flow, which is one of the five principles of lean production. C4: Distance traveled by human labor: The sum of the distances that the employees have to travel during the operations.
Multi-criteria Decision Making Methods
- Analytic Hierarchy Process
- Analytic Network Process (ANP)
- ELimination Et Choix Traduisant la REalité (ELECTRE) 11
- Technique for Order Preferences by Similarity to
- Other Methods
These methods are often referred to as outlier methods and they are based on the calculation of the so-called concordance and discordance indices. These methods have been applied in recent research such as optimal selection of roofing materials [155] and evaluation of bidding procedure of construction projects [81].
Fuzzy in Decision Making and Support
The Fuzzy Concept
Per the definition of Zadeh "a variable whose values are not numbers but words or sentences in a natural or artificial language, for example a linguistic variable is the temperature which can have such values as cold, hot, hot.
Fuzzy Extensions
Fuzzy in Decision Making and Support 15 (Table 2.1) formulated by experts and after some evaluation of "fuzzy if then rules" and defuzzification the output will be a sharp value [21]. In addition, there are methodologies that merge one of the methods of section 2.2 with the fuzzy paradigm, combining their advantages.
Fuzzy in Layout Planning
Fuzzy Decision Maps (FDM) [134] which method allows using fuzzy linguistic values in cognitive maps to express relative importance. A non-structural fuzzy decision support system is tested in [201] and the test result showed that it is applicable in the initial phase of design for the most important site facilities, but it is sensitive to the evaluation factors.
Proposed Method
Finally, the preference ratio for each criterion is determined based on the number of criteria and decision makers and ranked on an interval scale using their respective standard normal distribution values. We add the weight of evaluation factors, where Ti is preferred or indifferent to Tj.
Example on the Proposed Method
The authors of [141] generated different feasible layout versions with multi-objective optimization using Pareto-based ant colony optimization and single-objective optimization using the Max-min ant system. For the multi-objective optimization, two objective functions were considered: f1: score for the probability of accidents related to the construction site layout, f2: score for the total handling costs among the facilities related to the construction site layout; in the case of single-objective optimization, the objective.
Conclusion
Dead reckoning (DR): The essential thing about dead reckoning is that, in principle, if the starting position is known, the vehicle's speed (velocity and orientation) is recorded continuously so that its position can be calculated. The disadvantage of the online systems is the fixed communication costs, which can be eliminated by using an off-line system;.
Vehicle Tracking in Transportation
The Department of Transport Technology and Economics of the Budapest University of Technology and Economics is also working on a project called BusEye. 132] compared GPS technology with two pointer technologies, the first one is the so-called vehicle map technique and the second one is Radio Frequency Identification (RFID), and RFID proved to be the best (Fig.3.1) in the investigation of the said publication.
Vehicle Tracking in Construction
210] proposes a framework for near real-time simulation (NRTS) where the machine parts are equipped with UWB RTLS, e.g. So the cycle time of the action can be recorded and with this data the simulation can be set in near real time.
Recommendations and Conclusion
The Contribution of the Chapter
State-of-the-art methods cannot be used to recognize small parts without a shape model or incremental recognition and without accurate scale information. Characteristic features of the point cloud, such as noise and local density, disappear in these steps.
The Outline of the Chapter
Looking at the palette of best practice solutions: the application of conventional 3D recognition methods such as [148] is not favorable because mesh generation or voxelization steps can be expensive for incomplete data and can also cause information loss. Solving the above issues offers the potential of partial cloud recognition and solving the problem of sequential data collection from tilted single layer/multilayer LIDAR sensors.
Related Works
Sensors and Data Structure
2D laser scanners are rarely used stand-alone for these tasks, of course 2.5D or 3D reconstruction is not even possible with only 2D data. The fusion of a 2D laser scanner and an Asus Xtion depth sensor is also used.
Object Recognition in Point Clouds
The main problem of classification based on single-layer 2D point clouds is the lack of surface information, i.e. the lack of characteristic features. In this table, the last row contains the proposed method based on local pattern recognition, as explained in the next section.
The Proposed Method
- Preprocessing
- Local Surface Definition
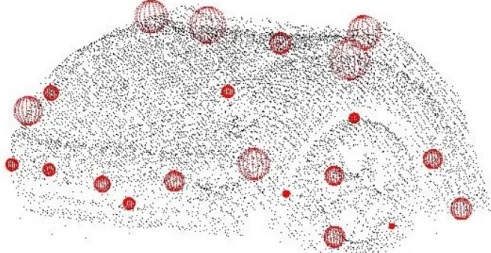
- Keypoint Search and Characteristic Radius
- Local Descriptor
- Keypoint Cluster Extraction
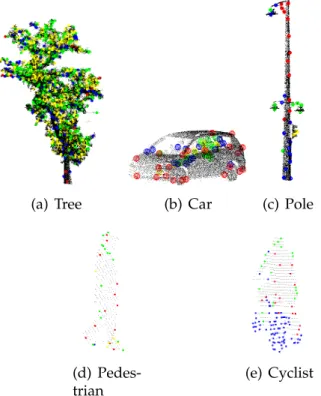
- Local Pattern Definition
- Bag of Graphs
Four points were chosen to build gi so that volume can be assigned as another feature of the subgraph. By counting the frequency of the similar local patterns defined in the previous step, I get a BoF [44] like descriptor.
Validation on Known Public Reference Database
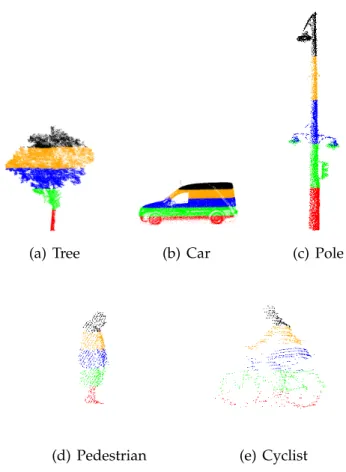
TABLE 4.3: Categorization results (in %) on the partial one-view test clouds; about 20% of the entire 3D object is visible. FIGURE 4.11: Examples of test clouds generated from public database with clustered key points; from one point of view, we can never see all the core points of a body, and what's more, we don't have scale information without scanning the full height.
Real-life Experiments
Data Extraction
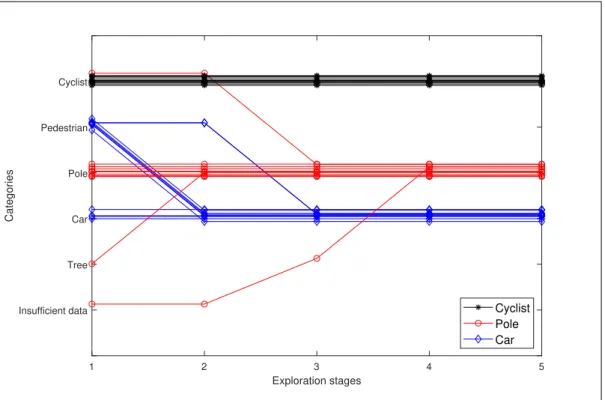
For objects shorter than 2 m, level 5 resulted in a step size of 20% of the object height, for objects taller than 2 m (trees and pillars) the step size was exactly 0.4 m. Tall objects were also explored to full height in another test where I used the ISS method to reduce the number of keypoint candidates and double the search radius.
Computational Complexity and Running Speed Eval-
The screen evaluated contains 60 consecutive measurements with a 2D LIDAR sensor (with 10 Hz scan frequency), and the number of object points on the screen is the average given above. Running speed depends on the number of points, and the MLS point clouds I used for the evaluation are locally dense.
Results on Developing Point Clouds
The measurement error means how far the object is (measured in Euclidean distance) from each category. The corresponding ratio shows how far the second closest class error measurement is from the true category.
Conclusion
The method performs at least as well as state-of-the-art algorithms in the near-field case, and also extends the range of detection. This chapter is organized as follows: Section 5.2 reviews the literature on the current state of the art on this topic.
Related works
Properties and disadvantages of available methods
In most cases, they are based on geometric features and either Ad-aboost method or neural network methods to build a strong classifier. The above methods are mostly designed for the classification of indoor (eg industrial hall) objects scanned with indoor sensors with limited range (it depends on the sensor's range and horizontal angular resolution).
Advantages offered by the proposed method
The proposed method
- Preprocessing of LIDAR clouds
- Descriptor of planar object segment
- Classification of planar segments
- Maximum likelihood for object level decision
- Object classification pipeline
Objects are divided into planar curves, which are consistently matched in successive frames (using features from simple geometry). The blur is caused by the movement of the vehicle (sensor), because they are in the coordinate system of the sensor.
Sensor resolution and datasets
Sensor resolution
As an example, I examine the scanning efficiency for Velodyne HDL-64E sensor aircraft and the detection range for pedestrians. Based on the sensor's vertical resolution, which is approximately 0.4 degrees, in an optimal situation it is possible to detect the human in two scanning planes even approximately in 110 m distance (the official sensor range is 120 m).
KITTI dataset
Although reducing the scanning imaging speed allows a horizontal angular resolution of 0.08 degrees, other LIDARs with even higher horizontal angular resolution can be found on the market (SICK LD-LRS5- 0.0625 degrees, Quanergy M86 - 0.03 degrees). These objects were cropped based on their marked 3D bounding boxes and then segmented based on the scanner planes.
Budapest dataset
Object tracking is one of the preprocessing steps in the latter case, its performance can affect the classification accuracy (the best reported Multiple Object Tracking Accuracy - MOTA in this database is around 90 % for cars). However, I only need a few frames (5 in these tests) for evaluation, so I assume that the classification is not significantly affected by the detection performance.
Comparison in case of spatial series (initial estimation from
Their results can be seen in Table 5.2, which can be compared to the results of my initial assessment in Table 5.3 on the same database. Using object-level tracking and evaluation as I propose (Table 5.13), I outperform [24] on all measures.
Classification results of time series (from initial to tracking
KITTI dataset
In Tables 5.8, 5.9 and 5.10, the planar curves were evaluated at the object level with the proposed maximum likelihood scheme based on the specified number of frames. Time series classification results (from initial to trailing) 99 TABLE 5.5: Comparison of methods (proposed and [24]) in the example.
Budapest dataset
Far field objects
TABLE 5.6: Confusion matrix for planar curves using the proposed maximum likelihood scheme method for single-frame mcurves in the Budapest dataset (IM1BC).
Conclusion
AHP Hierarchy [2]
While you can get promising alternatives and partial classifications with ELECTRE I, ELECTRE II is capable of full classification. The essential difference between the two methods is in the aggregation approaches, with VIKOR only the distance from the ideal solution is represented in the aggregation function, while with TOPSIS also the distance from the negative ideal.
MCDM papers in construction [95]
Linguistic variable age [88]
For example, the fuzzy TOPSIS [58] or fuzzy AHP [40] methods, and my method are also similar in this sense. The advantages of the method are the ability to consider the opinion of more than one decision maker, it is mathematical method for evaluation that also offers analysis possibilities.
Fuzzy decision support system [49]
My method uses the Guilford method to determine the weighting numbers of the evaluation criteria instead of soft AHP. Guilford's method has been shown to be effective in KIPA, so their combined use is often referred to as "extended KIPA".
Layout version L2 in HFS-KIPA example [141]
Layout version L4 in HFS-KIPA example [141]
Layout version L6 in HFS-KIPA example [141]
Example for the evaluation of plans: In terms of C4 (distance traveled by human labor), the difference is obvious. AGPS (Assisted GPS): uses auxiliary software to know the exact positions of satellites, requires an active data connection.
System proposed by [132]
These decisions are based on the distance and the static or dynamic nature of the obstacle (differentiating static and dynamic obstacles is not an easy task in itself [228]). The proposed method 87 CNNs are often used for various purposes (detection, segmentation, classification, etc.) in image processing, an overview of which can be found in [73].
Examples of 3D (left) and 2D (right) LIDARs and point clouds
Tilted sensor installation for overhang detection. Source: SICK
Sidney Urban Object dataset [48]
Examples for partial point clouds
The performance of the proposed method is not affected by range and is comparable to the state-of-the-art (2D and 2.5D). In: Proceedings of the 2nd International Conference on Machine Control and Guidance, 9-11. March University of Bonn.
Registered 2D LIDAR sequences about a pedestrian; in
Example of accumulated scanning during the AGV motion,
Linguistic values for linguistic terms
Aggregated preference table
KIPA-matrix
Basic AVL types
Base table for urban transport
KIPA-matrix for urban transport
Base table for long-distance transport
Base table for construction industry
Preference order of locating hardware technologies
Categorization results (in %) on the full one-view test clouds
Categorization results (in %) on the partial one-view test
Run time evaluation on average point number
Recognition results in different view angle stages (bottom-up
Example descriptor (transpose matrix) about the car in Fig. 5.7
Confusion matrix for planar curves by the method proposed in