Student Assessment of Desirable Technical Skills: A Correspondence Analysis Approach
András Farkas, Viktor Nagy
Faculty of Economics, Budapest Tech
Tavaszmező út 17, H-1084 Budapest, Hungary
E-mails: farkas.andras@kgk.bmf.hu, nagy.viktor@kgk.bmf.hu
Abstract. The importance rating of the technical skills and their related knowledge of industrial engineering and business management graduates are developed. A survey was conducted at the Faculty of Economics of the Budapest Tech to measure and evaluate 17 technical skills required by employers. The study utilized questionnaires to rate and rank these skills based on student assessment. The research was supported by a multivariate statistical method referred to as correspondence analysis. Details of the mathematical background of this method and the interpretation of the findings are also discussed.
Keywords: correspondence analysis, survey method, importance ranking
1 Introduction
Higher education needs to be aware of the changing nature of the workplace and of the requirements of employing organizations. Universities/Colleges need to be responsive to these changes and demands. Institutions have a great responsibility to its principal stakeholders (students) to equip them with more than a profound knowledge of an academic subject area. Therefore, they should continually examine their curriculum in order to enhance the educational experience and achieve continuous quality improvement. To assure a viable curriculum, some academic departments are developing closer contacts with their stakeholders (employers). They are also attempting to adapt curriculum to meet the changing needs and skills required by employers. As they begin to develop closer ties with industry, the academic community becomes more aware of the needs of the business community. The intent is to close the gap in understanding between the academic and the business communities.
At the Faculty of Economics of the Budapest Tech, this business outreach includes developing strategic alliances and partnerships with local companies, surveying employers and receiving input from students. In the latter respect we have focused on to survey the employment of our graduates thus far and, also, we have extended
our investigations to the entire school [6], [7]. One of the central questions of our interest is as to whether is it more beneficial to emphasize technical skills and knowledge over general skills, or vise versa. In addition, we wonder whether gaps are existing between perceptions of students and the business environment regarding the value of certain skills and traits. When we have been evaluating qualities relevant for securing employment in our fields of studies we have identified three categories based on whether the item relates more to a qualitative, quantitative, or personal attribute. We called them competencies of graduates expected by the employers [6].
In this paper we are only concerned with one of these categories. This group in that graduates need to be successful at work can be called as quantitative attributes which tend to deal more with technology- or discipline-based knowledge. We will refer to these issues as technical skills. They include knowledge and application capabilities in computer use, programming languages, database management, optimization and the major areas of managerial accounting, finance and operations management.
The main purpose of this study is to find the technical skills and the major areas of knowledge that are sought by employers for our industrial engineering and business management students entering the job market. Student assessment for the importance of these attributes will be made based on representative samples of student bodies. Student perceptions about the importance of these skills must be comparable to those of employers in order to measure the actual performance of our graduates as well.
In Section 2 a detailed description of the correspondence analysis method will be presented, in Section 3 the steps of determining the importance of the technical skills of our engineering and economics students at the Budapest Tech will be given, and, finally, the major results will be presented.
2 Correspondence Analysis Technique
This study relies on descriptive empirical research by using quantitative methods for observable phenomena. The tools discussed involve collecting survey information and summarizing data. The term survey means the process of looking at the problem in its entirety. For our goals, the survey is a study that uses questionnaires and interviews to discover descriptive characteristics of the problem. To give more insight into the characteristics of our data sets descriptive statistical measures and some graphical displays are applied. Levels of measurement are ordinal and interval.
To analyze the relationships between a great number of variables in a subtle way the multivariate statistical method called correspondence analysis can be used. In
this Section an overview of this multivariate statistical method is presented. For a comprehensive description of this technique we refer to the classic texts by Greenacre [10] and Benzecri [2]. Cross-tabulation of categorical data is perhaps the most commonly encountered simple form of analysis in applied research.
Correspondence analysis (CA) is a descriptive technique of factoring categorical variables and displaying them in a property space which maps their association in two or more dimensions. It can be used where the contingency table approach is less effective due to the very complex large tables. So CA starts with tabular data, usually two-way cross-classifications. A measure of distance between any two points, is defined, where points are values (categories) of the discrete variables.
CA employs chi-square distances to calculate the dissimilarity (or similarity) between the frequencies in each cell of the table. The cross-tabulation table of frequencies is then standardized, so that the relative frequencies across all cells sum to unity. The goal of such an analysis is to represent the entries in the table of relative frequencies in terms of the distances between particular rows and/or columns in a low-dimensional space, in usually two dimensions. This is achieved by factoring the basic structure (through singular value decomposition) of the chi- square distance matrix, resulting in a set of row vectors, column vectors and singular values [10]. In this step, the procedure requires the researcher to choose between different methods of normalization. Finally, the CA scales the vectors to create scores for each participant and each variable. These scores are plotted in a visual display, by showing which category values are close together. The interpretive strength of CA lies with its representation of low-dimensional solutions in these graphical displays, which permit the researcher to make comparisons between row variables and/or between column variables (after principal normalization) and between row and column variables (after symmetrical normalization) in their relative placement in shared low-dimensional space.
The differences between the methods of creating the graphical representations has caused debate in the literature about the most appropriate choice of normalization and methods of interpretation of the visual display [9], [11], [16]. Gabriel [9]
calculated goodness-of-fit for the various forms of graphical representation available in CA. He concluded that researchers who have a specific interest in actual magnitudes of difference between row variables, or between column variables should choose the appropriate row or column principal normalization.
However, researchers whose interest lies in comparing the general orientation of row points and column points in terms of the relative magnitude of the distance, rather than visualizing actual magnitudes, are well served by the symmetrical normalization option. The symmetric biplot, in addition to its optimal fit of the data, proportionally fits the form and the variance almost optimally and is an excellent candidate for general usage, unless one requires representation of the actual magnitudes [9, p. 435].
) 1 ( , and
, where
, ) / 1 ( and , 0 ], [
1 1
T ..
..
∑∑
= =
=
=
≡
≥
≡ I
i J j
ij ij
ij n n n n n
n P N e Ne
N
) 2 ( ,
,..., 1 , 0 and , ,..., 1 , 0 where ,
and ≡ T ri> i= I cj> j= J
≡Pe c Pe
r
) 3 ( ).
( diag and
) (
diagr D c
Dr≡ c≡
) 4 ( .
. . . and
. . .
T T 1
T
T T
⎥⎥
⎥⎥
⎥⎥
⎦
⎤
⎢⎢
⎢⎢
⎢⎢
⎣
⎡
≡
≡
⎥⎥
⎥⎥
⎥⎥
⎦
⎤
⎢⎢
⎢⎢
⎢⎢
⎣
⎡
≡
≡ − −
J c
I r
c c
P D C
r r
P D
R 1
1
1
Examples of applications of CA can be found in various fields of interest, e.g., in medical research [11], for students’ and teachers’ cognitions about good teachers [1], for higher education institution image [15], for personalities [16], and in marketing research [2].
The formal description of the mathematics of CA is now presented (see the excellent book of Greenacre [10] for more details). Suppose that we are given a matrix N of non-negative numbers with I rows and J columns, such that its row and column sums are non-zero. Elements of this matrix are denoted by nij, i=1,…,I, j=1,…,J. The correspondence matrix P is defined as the elements nij
divided by the grand total of N. The vectors of row and column sums of P are denoted by r and c respectively and the diagonal matrices of these sums by Dr and Dc respectively. Thus, the data matrix and the correspondence matrix are defined as
where eT≡[1,…,1]T denotes an I-vector or a J-vector of ones respectively. The row and the column sums are:
and the diagonal matrices are defined as
The row and column profiles of P are defined as the vectors of rows and columns of P divided by their respective sums. The matrices of the row and the column profiles are:
Both the rowprofiles ři, i=1,…,I,and the columnprofiles čj, j=1,…,J,are written in the rows of R and C respectively. These profiles are clearly identical to the rows and columns of N divided by their respective sums, just as r and c are identical to the row and column sums of N divided by the grand total n...
The row and column profiles define two clouds of points in respective J- and I- dimensional weighted Euclidean spaces. The row cloud is the set of points, i.e. the I row profiles ř1,…, řI in J-dimensional space, which has the masses, i.e. the I elements of r and its metric is the weighted Euclidean with dimension weights defined by the inverses of the elements of c (chi-square metric), that is Dc–1. Accordingly, the column cloud is the set of the points, i.e. the J column profiles
) 5 ( .
and T
Tr r C c
R
c= =
) 6 ( ), ( ) ( ) ( ),
( ) ( )
(I =
∑
iiriri−cTD−c1ri−c inJ =∑
jcjcj−rTD−r1cj−rin
) 7 ( ].
) (
) (
[ trace ) ( , ] ) (
) (
[ trace )
(I = Dr R−ecT D−c1 R−ecT T inJ = Dc C−erT D−r1 C−erT T in
) 8 ( ], ) (
) (
trace[
) ) (
( )
( T T T
..
2 2
rc P D rc P
D 1 − 1 −
=
− =
=
=
∑∑
i j −r −cj i
j i ij
n c
r c r J p
in I
in χ
∑∑
−≡ i j ij
ij ij
e e
n ) ,
( 2
χ2
) 9 ( ,
where T T 1
T
T AD B A D A B D B I
rc
P− = μ −r1 = −c =
č1,…,čJ in I-dimensional space, which has the masses, i.e. the J elements of c and its metric is the weighted Euclidean with dimension weights defined by the inverses of the elements of r (chi-square metric), that is Dr–1.
The centroids of the row and column clouds in their respective spaces are c and r respectively:
The overall spatial variation of each cloud of points is quantified by their total inertia, that is the weighted sum of squared distances from the points to their respective centroids, the masses and the metric. They are for the row points and the column points, respectively:
i.e.
The total inertia is the same in both clouds and is equal to the mean-square contingency coefficient calculated on N, that is the chi-square statistic for independence divided by the grand total n.. (calculated as if N were a contingency table):
where
and eij≡ni.n.j/n.., the ‘expected’ value in the (i,j) cell of the matrix based on the row and column marginals ni. and n.j.
The respective K*-dimensional subspaces of the row and column clouds which are closest to the points in terms of weighted sum of squared distances are defined by the K* right and left (generalized) singular vectors respectively of P–rcT, in the metrics Dr–1 and Dc–1, corresponding to the K* largest singular values. In other words the right and left singular vectors define the principal axes of the row and column clouds respectively.
Let the generalized SVD of P–rcT be:
And for the singular values: μ1≥ … ≥ μK>0, then the columns of A and B define the principal axes of the column and row clouds respectively. (In (9) matrix I denotes the matrix of identity.)
) 10 ( )
( and
)
( r1 T I J c1J J J K J K c1 T T J I r1I I I K
K
I − × ×
− ×
×
× ×
× −
× ≡ D−P−ec D B G ≡ D P −er D A
F
) 11 ( .
and 1
1
μ c μ
r AD G D BD
D
F= − = −
) 12 ( .
and 1 T 1 1
1 1
1 − − − − −
− = = =
=D PGDμ RGDμ G D P FDμ CFDμ
F r c
The respective co-ordinates of the row and column profiles with respect to their own principal axes (i.e. the principal co-ordinates) are related to the principal axes of the other cloud of profiles by simple rescaling. Let
be the co-ordinates of the row and the column profiles with respect to principal axes B (in the chi-square metric Dc–1) and A (in the chi-square metric Dr–1) respectively. Then
Expressions (11) define the co-ordinates of the row and column profiles with respect to all the principal axes (the co-ordinates of individual points are contained in the rows of F and G). The co-ordinates of the points with respect to an optimal K*-dimensional subspace are contained in the rows of the first K* columns of F and G.
With respect to the principal axes, the respective clouds of rows and column profiles have centroids at the origin, e.g. the centroid of rows of F is rTF=0T. The weighted sum of squares of the points’ co-ordinates (i.e. the weighted variance or inertia) along the kth principal axis in each cloud is equal to μk2, which will be denoted by λk and called the kth principal inertia, e.g. for the row cloud it is:
FTDrF=Dμ2≡Dλ. In correspondence analysis the centering of the row and column profiles is a symmetric operation which removes exactly one dimension from the original spaces of these profiles. This is embodied in the property that the SVD of the “uncentered” matrix P consists of the SVD of the centered matrix P–rcT. The columns of F and of G are the eigenvectors of the respective matrices RC and CR, standardized by FTDrF=Dλ= Dμ2.
The first one or two vectors of F and G are usually taken into consideration (one or two dimensions are displayed which have the highest contributions to the variance). Then, either the columns or the rows are plotted separately, or they are plotted simultaneously for constructing a biplot to find possible associations between the row and the column variables. Transitions between the columns and the rows might be done easily in the following way:
Expressions (12) can be used directly for the addition of supplementary rows and/or columns.
3 Exploration and Analysis of the Technical Skills
There are innumerable studies that have produced lists of graduate attributes desired by employers. Some of these studies sophisticated in attempting to prioritize these attributes in terms of their importance for employers [5]. The various studies have produced useful indicators of the kinds of skills, abilities and knowledge that graduates need. Increasingly, they are showing enormous similarities across discipline boundaries. A set of ‘transferable’ skills including communication, team-working, problem-solving, leadership, self-confidence and willingness to learn and flexibility are widely required. The set of such skills are often called graduate competencies. The reader may find definitions and the notion of this term in the book [14].
Analytic studies of the labor market have found, however, that there is a skills gap between the labor requirements of an industrially developed society and the outputs from the educational system. One feature of current skills shortage is the widespread lack of important generic skills and social skills such as quality assurance skills, problem-solving skills, learning efficiency, flexibility and communication skills. These are in addition to shortages of critical scientific and technological skills. Harvey with Green [13] argues that the perceived skills gap occurs for four reasons. First, that education is a ‘once-and-for-all’ activity, which ignores the need for life-long learning and skills updating. Second, a lack of communication is experienced between higher education and commerce and industry. Third, a strong indifference and inconsistency of industrialists exist in identifying what they want. Forth, there is a belief of threat to academic autonomy and freedom posed by closer links to commerce and industry.
This research has focused on the recent process of education at the Faculty of Economics (KGK) of the Budapest Tech. In particular, we have investigated the basic technical skills and the related knowledge of our students expected by employers when they enter employment. We considered both of our two undergraduate (BA and BSc) degree programs. Since we also wish to carry out a profound analysis within the specialized braches of our programs we divided our students into four categories. The abbreviations used throughout this paper are:
BM = Full-time BA students in Business Management.
IES = Full-time BSc students in Industrial Engineering with a major in
Systems’ Control.
IEG = Full-time BSc students in Industrial Engineering in different areas (e.g. quality management) of General Management.
PTP = Part-time BA/BSc program students in each of the above streams.
To make our findings enable for international comparisons we have chosen the questionnaire that was developed for similar programs in the United States [8].
The items of the technical skills are as follows:
A = Word processing (Word, etc.)
B = Spreadsheets (Excel, etc.) C = Databases
D = Operating systems design E = Project management
F = Computer software and programming languages G = Inventory management
H = Logistics (transportation, distribution, warehousing, suppliers) I = Quality management
J = Resource planning & control
K = Web designing, IT, Internet operations L = Telecommunication
M = Quantitative analysis (statistics, optimization, etc.)
N = Managerial accounting (budgeting, break-even, cost controlling) O = Finance (balance sheet, cost-benefit, cash-flow, investments) P = Marketing & market research (sales, behaviour, etc.) Q = Entrepreneurship
Students were asked to rate from 1 to 7 on a seven point ascending scale these 17 technical skills according to their importance. These competencies are required on entering employment and also for their professional career. The use of such Likert-scales is common in applied research. They simply gauge the degree to which thereisagreementordisagreementwith statements to reflect clear positions on an issue and represent a desirable goal, a transition from ordinal scales to interval scales [17]. The verbal interpretation of the scale used in the questionnaire is given below:
1 Not at all important
2 Scarcely important
3 Slightly important 4 Moderately important
5 Usually important
6 Significantly important 7 Extremely important
The survey was conducted for the each of the four student groups. The filled questionnaire forms have been exposed to severe inspections to filter them for possible non-sampling errors (data tabulating, coding, etc.). The sample sizes are, in turn:
BM (56) + IES (41) + IEG (59) + PTP (86) = KGK TOTAL (242).
We can ascertain that considering the total number of full-time and part-time students currently completing their studies at the KGK they are well represented by the sample sizes both for the total and for the partitioned (component) samples.
Completing such a questionnaire study involves the measurement of the internal consistency of the measure as a standard requirement. This is called reliability of the measure. Reliability refers to the property of a measurement instrument that causes it to give similar results for similar inputs. The commonly used measure is Cronbach’s α based on the average inter-item correlation [4]. We carried out a reliability analysis for both the total and the partitioned (component) samples.
Reaffirming our suspicion, the responses for each item are not correlated (inter- item correlations are below 0.30, except 10-15 pairs of approx. 5,000 ones with values of around 0.50). Moreover, there is a positive correlation between almost every pair of items, which we expected. These results show the independence of the items and the correct interpretability of the scales for the respondents. As concerns the coefficients of Cronbach’s alpha, they are: for the total sample 0.820, and for the partitioned samples: 0.768, 0.803, 0.839 and 0.818, respectively. These coefficients are close enough to 1 (perfect reliability), indicating strong internal consistency among items within each factor. These findings validate the use of the various sets of questions to represent each factor of the study.
In Table 1, the weighted arithmetic means (mean scores) and the importance rankings (given by their rank numbers) of the student groups as well as the aggregated results are presented. The weighted standard deviations are ranging from 1.110 to 1.555 for the total KGK evaluation and from 1.046 to 1.877 for the group assessments. These latter measures represent a rather moderate variability in the respondent’s judgments. Concerning the rather homogenous opinion of the student body of the KGK it is not surprising how close the scores of the single items are to each other for the different groups, and, similarly in their magnitudes.
Regarding the total scores, the range of the weighted mean scores for the KGK is relatively small: R=5.87–3.26=2.61, whereas the maximum of the ranges for the student groups is for the IES: R=6.07–2.85=3.22.
Table 1
BM IES IEG PTP TOTAL
Technical skills
Mean R Mean R Mean R Mean R Mean R A word processing 5.80 5 5.88 2 5.51 4 5.63 2 5.68 3 B spreadsheet 5.88 4 5.73 3 5.61 3 5.63 2 5.70 2 C database 4.89 16 4.88 12 4.81 14 4.87 7 4.86 13 D operating syst. 5.07 13 4.59 14 4.83 13 4.79 11 4.83 14 E project man. 5.50 8 4.63 13 5.03 12 4.79 11 4.99 11 F comp. software 3.48 17 2.85 17 3.49 17 3.14 17 3.26 17 G inventory man. 5.07 13 4.56 15 4.46 16 4.51 16 4.64 16 H logistics 5.50 8 4.95 10 5.07 11 4.71 14 5.02 10
Importance
2 3 4 5 6 7
F G M D C K E H J L I N O P A B Q
Technical skill
Wt Ave
I quality man. 5.25 10 5.02 9 5.37 8 4.83 9 5.09 7 J res. planning 5.34 9 4.88 12 5.08 10 4.85 8 5.02 10 K web, IT 5.02 14 5.05 8 5.44 5 4.60 15 4.98 12 L telecommunic. 5.16 11 5.17 7 5.42 6 4.73 12 5.07 8 M quant. analysis 4.93 15 4.32 16 4.58 15 4.72 13 4.67 15 N man accounting 5.64 6 5.24 6 5.31 9 5.15 6 5.32 6 O finance 6.18 1 5.49 5 5.37 8 5.15 6 5.50 5 P marketing 6.09 2 5.54 4 5.86 2 5.24 4 5.64 4 Q entrepreneurship 6.07 3 6.07 1 5.93 1 5.60 3 5.87 1 Grand mean 5.35 4.99 5.13 4.89 5.07
For the aggregated student body of the KGK we displayed the size of the weighted averages assessed for importance in Figure 1. Here, the 17 technical skills appear in an ascending order. This bar chart exhibits that the students ranked Entrepreneurship (Q), Spreadsheets (B), Word processing (A) and Marketing/Market Research (P) to be the most important and Computer Software/Programming Languages (F) as being the least important technical skills.
These findings are not unexpected at all and quite similar to those of obtained for the American students. Just at the top of the list, one of these skills is remarkable, namely the Entrepreneurship (Q). This dominant view of the students is probably due to the particular Hungarian economic environment.
Figure 1
Priority ranking of the weighted mean scores of the KGK
The different student groups agree in their importance priority to a great extent.
This statement is well supported by the numerical results when the Spearman’s coefficients of rank correlation (interpreted on an ordinal scale) are computed.
These statistical measures can be generated from the rank numbers of the student ratings given in Table 1. They are ranging from ρ=0.698 (between IEG & PTP) to ρ=0.940 (between IES & IEG). Latter coefficient value reflects the very high degreeofagreement in the rankings within the industrial engineering students. The IES group ranking is the closest to the aggregated KGK ranking: ρ=0.956. Notice also that there are some ties in the rankings as it can be seen in Table 1.
For the strength of the linear relationship s between the magnitudes of the weighted mean scores the Pearson’s product moment coefficients of correlation are calculated (interval scale). These coefficients are even higher than those of the rank correlations and ranging from r=0.871 (between IEG & PTP) to r=0.951 (between IES & PTP). The strongest relationship in the magnitudes of the scores can be found between the IES group and the KGK average: r=0.984.
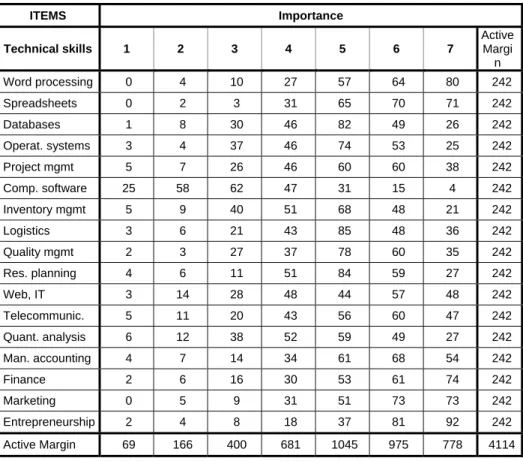
Now we consider the aggregated sample (KGK) and carry out a statistical analysis by applying the method of correspondence analysis. First the frequency of the responses (matrix N) is presented in the contingency table (see Table 2).
Table 2 Contingency Table
ITEMS Importance
Technical skills 1 2 3 4 5 6 7
Active Margi
n Word processing 0 4 10 27 57 64 80 242 Spreadsheets 0 2 3 31 65 70 71 242 Databases 1 8 30 46 82 49 26 242 Operat. systems 3 4 37 46 74 53 25 242 Project mgmt 5 7 26 46 60 60 38 242 Comp. software 25 58 62 47 31 15 4 242 Inventory mgmt 5 9 40 51 68 48 21 242 Logistics 3 6 21 43 85 48 36 242 Quality mgmt 2 3 27 37 78 60 35 242 Res. planning 4 6 11 51 84 59 27 242
Web, IT 3 14 28 48 44 57 48 242
Telecommunic. 5 11 20 43 56 60 47 242 Quant. analysis 6 12 38 52 59 49 27 242 Man. accounting 4 7 14 34 61 68 54 242
Finance 2 6 16 30 53 61 74 242
Marketing 0 5 9 31 51 73 73 242
Entrepreneurship 2 4 8 18 37 81 92 242 Active Margin 69 166 400 681 1045 975 778 4114
In Table 2, one may think of the 7 column values in each row of this cross- tabulation as coordinates in a 7-dimensional space. Due to the enormous difficulties in computing the (Euclidean) distances between the row/column points, we want to find a lower-dimensional space, in which to position the row/column points in a manner that retains all, or almost all of the original information about the differences. Using the frequency values as the necessary input, the correspondence analysis procedure has been run. Then a step-by-step analysis of the statistics follows as is described below:
In terms of the significance of dependencies the value of the chi-square statistic is χ2= 925.794, which at a stated level of α=0.05 indicates a significant dependency between the rows (attributes) and the columns (contributions) (p= 0.000).
The next step concerns the dimensionality of the solution, i.e. to determining the appropriate number of dimensions to use in the solution. This requires the analysis of the singular values, percentages of inertia explained, the cumulative percentages and the contribution to the overall chi-square value. The dimensions are extracted so as to maximize the distances between the row or column points, and successive dimensions (which are orthogonal to each other) will explain less and less of the overall chi-square value. In our problem the first and the second axes account for 72.8% and 21.6% of the inertia, respectively, i.e. a cumulative total of 94.4%. This retention of the solution is very high, as if the data were purely random with no significant dependencies, the average axis should account for 100/(7-1)=16.7% of the inertia and 100/(17-1)=6.25% in terms of the rows.
Since the third axis accounts for only 3.2% of the inertia, hence a 2-dimensional solution is powerful enough to be used.
It may well occur that not all of the rows or columns are equally well represented.
Determining the quality of representation of a particular row or column provides additional richness to the interpretation of the relationships in the contingency table. The quality of representation is evaluated by the sum of the squared correlations of that row and column over the n dimensions. In our problem all score categories and technical skills are well represented in the two dimensions (degree of association between a particular column and a particular axis).
As concerns the compatibility of row and column coordinates it is customary to summarize the row and column coordinates in a single plot. In such plots, however, one can only interpret the distances between row points, and the distances between column points, but not the distances between row points and column points. But our concern is to interpret the meaning of the dimensions extracted in the low-dimensional solution and the placement of the technical skills relative to those dimensions. We, therefore, utilize a symmetrical normalization for the graphical representations.
The major result of our analysis is shown in Figure 2. This biplot is a perceptual map containing almost 95% of the original information in two dimensions. In addition, as supplementary points, we displayed the student group averages in the
same plot to be capable of making a subtle analysis of the results (a complex evaluation of the curriculum and the academic content of its constituting courses with respect to each technical skill and knowledge based area). From this chart, one may be readily determine that which are the most important technical skills, how the relative magnitudes look like for the distances between the skills and what sort of associations are among these student competencies.
Dimension 1
3 2
1 0
-1
Dimension 2
1.5
1.0
0.5
0.0
-0.5
-1.0
-1.5
TOT PTP
IEG BM IES
entre mark
fin acc
quant tele
web res
quallog inv
comp proj
opsys dbase
spread
word 7 6
54
3
2 1
Row and Column Points
skill score
Symmetrical Normalization
Figure 2
Symmetric biplot of the importance of the technical skills
It is also seen in Figure 2 that business management (BM) students rated the technical skills closest to the maximum grade (7) on the average by giving them the highest importance among the student groups. This result conforms perfectly to that of given in Table 1 (see there the grand means).
Conclusion
In this paper the technical skills and the related knowledge of Budapest Tech graduates have been evaluated with respect to importance. Efforts must be made by the school to minimize any gaps between our engineering and economics students’ perceptions of marketable skills and actual skills expected by employers.
The results of this study furnish a good basis for supervising and fur ther developing the present curricula into this direction. Correspondence analysis has proven a versatile and easily implemented tool in handling categorical data and, also, in detecting and explaining relationships among this complex phenomenon.
Further investigations will reflect to the employer ratings of importance expected of graduate employees. This task, however, is subject to future research.
Acknowledgement
The authors express their thanks to Csaba Iván for his valuable help in gathering and preparing the data for the analyses.
References
[1] Beishuizen, J. J., Hof, E., Putten, C. M. v., Bouwmeester, S., Ascher, J. J., Students' and Teachers' Cognitions about Good Teachers. British Journal of Educational Psychology, 71, (2001), 185-201
[2] Bendixen, M., A Practical Guide to the Use of Correspondence Analysis in Marketing Research. (electronic version). Marketing Research On-Line, 2003, (1996), 16-38
[3] Benzecri, J.-P., Correspondence Analysis Handbook. New York: Marcel Dekker. 1992
[4] Cronbach, L. I., Coefficient Alpha and the Internal Structure of Tests.
Psychometrica, 16, (1951), 297-334
[5] Diplomával a munkaerőpiacon. [szerk. Györgyi Zoltán] (2006) (With a Degree on the Labor Market). Tanulmány. NKTH projekt. PH Felsőoktatási Kutatóintézet. Budapest, 2006, p. 128 (in Hungarian)
[6] Farkas, A., On the Competency Profiles of Graduates. Proceedings of the 5th International Conference on Management, Enterprise and Benchmarking, Budapest, Hungary, June 1-2, 2007, Budapest Tech, Hungary, (2007), 153-166
[7] Farkas, A., Competitiveness of Graduates on the Job Market, Proceedings of the Symposium for Young Researchers in Business Sciences, Budapest, Hungary, November 16, 2007, Budapest Tech, Hungary, (2007), 9-18 [8] Gabric, D., McFadden, K I., Student and Employer Perceptions of
Desirable Entry-Level Operation Management Skills. Journal of Education for Business, 16, (2001), 1-10
[9] Gabriel, K. R., Goodness of Fit of Biplots and Correspondence Analysis.
Biometrika, 89, (2002), 423-436
[10] Greenacre, M. J., Theory and Applications of Correspondence Analysis.
Academic Press. London, 1984
[11] Greenacre, M. J., Correspondence Analysis in Medical Research. Statistical Methods in Medical Research, 1, (1992), 97-117
[12] Greenacre, M., Correspondence Analysis and its Interpretation. In: M.
Greenacre, J. Blasius (Eds.), Correspondence Analysis in the Social Sciences, pp. 3-22, London: Academic Press, 1994
[13] Harvey, L. with Green, D., Employer Satisfaction. Birmingham, Higher Education Quality Council QHE, 1994
[14] Henczi, L., Zöllei, K., Kompetencia menedzsment. (Competence management). Perfekt Kiadó, Budapest, 2007 (in Hungarian)
[15] Ivy, J., Higher Education Institution Image: a Correspondence Analysis Approach. The International Journal of Educational Management, 15, (2001), 276-282
[16] Nishisato, S., Elements of Dual Scaling: An Introduction to Practical Data Analysis. Hillsdale, NJ: Erlbaum, 1994
[17] Torgerson, W. S., Theory and Methods of Scaling. New York, Wiley, 1967