This manuscript was accepted for publication by Energy & Fuels, a journal of the American Chemical Society. Publication data of the accepted work:
Wang, L.; Li, T.; Várhegyi, G.; Skreiberg, Ø.; Løvås, T. CO2 Gasification of chars prepared by fast and slow pyrolysis from wood and forest residue. A kinetic study. Energy Fuels 2018, 32, 588-596 doi: https://doi.org/10.1021/acs.energyfuels.7b03333
CO 2 Gasification of Chars Prepared by Fast and Slow Pyrolysis from Wood and Forest Residue. A Kinetic Study
Liang Wang,
†Tian Li,
‡Gábor Várhegyi,
§* Øyvind Skreiberg,
†Terese Løvås
‡†SINTEF Energy Research, Postboks 4761 Torgarden, NO-7465 Trondheim, Norway
‡Department of Energy and Process Engineering, Faculty of Engineering, Norwegian University of Science and Technology, NO-7491 Trondheim, Norway
§Institute of Materials and Environmental Chemistry, Research Centre for Natural Sciences, Hungarian Academy of Sciences, PO Box 286, Budapest, Hungary 1519
*Corresponding author.
KEYWORDS: Spruce, forest residue, biomass, pellets, char, fast pyrolysis, kinetics, reactivity, thermogravimetry, CO2 gasification.
ABSTRACT. The CO2 gasification of chars was investigated by thermogravimetry (TGA). The chars were prepared from spruce and its forest residue. Prior to the gasification the raw materials were pelletized and pulverized. Part of the samples was directly gasified in the TGA when the char was formed at low heating rates before the gasification. Another sort of char was prepared in a drop tube reactor (DTR) at a heating rate of around 1×10⁴ °C/s and a residence time of 0.2 s at 1200°C. The kinetic evaluation was based on TGA experiments with linear, modulated, and constant-reaction rate (CRR) temperature programs. The gasification of the DTR chars took place at temperatures 80–100°C lower than the chars formed at low heating rates. The chars formed at low heating rates exhibited a side reaction that occurred 80 – 100 °C below the main peak of the mass-loss rate curves during the gasification. Accordingly the gasification kinetics of these chars was described by assuming two pseudo-components. The thermal annealing (thermal deactivation) of the chars during the gasification experiments was taken into account by the pre-exponential factors which were allowed to have different values at different temperature programs. A strong compensation effect was observed between the activation energy (E) and the rest of the kinetic parameters. Nevertheless, the obtained E values varied in a narrow interval (from 219 till 227 kJ/mol) and were very close to the ones obtained for other chars with similar kinetic evaluation procedures (Wang et al., Energy & Fuels 2013, 27, 6098-6107 and 2014, 28, 7582-7590.)
1. INTRODUCTION
Woody biomass is a main biomass source for bioenergy production. However, the availability of these raw materials is limited and their prices have increased in the last decades.1 Presently, forest residues are entering the renewable energy market while wood is considered as a raw material for higher-value products. Forest residues are derived from the crown of trees, including usually branches, needles and foliage. The economic potential for forest residues in Norway alone is estimated at 2.7 million solid m3 annually.2 In contrast to conventional woody biomass, forest residues have more heterogeneous properties in terms of biological components and inorganic elements,3 which influence their pyrolysis and gasification reactions. CO2
gasification is one of several pathways for converting biomass resources into energy and different valuable products. The fundamental understanding of the CO2 gasification kinetics of biomass chars of different origin is important to understand and be able to predict CO2 gasification reactivities.4
The use of biomass charcoal instead of raw biomass has several advantages in the gasification.5 For example, much less tar is formed, decreasing the problems caused by tar deposition in the equipment. The energy efficiency is also higher, compensating partly for the energy requirements of the charcoal production.5 The raw biomass has usually high transport cost and poor grindability, while the chars have higher energy density and much improved grindability.6 Accordingly the conversion of the forest residues into chars may be a feasible possibility to improve the mechanical properties, reduce the logistic costs, and carry out the gasification by simpler and more efficient technologies.
Numerous studies have been published on CO2 gasification kinetics of woody biomass chars at various operating conditions and with different char preparation methods. A major part of the existing knowledge on the kinetics of CO2 gasification of biomass chars is summarized in the extensive review of Di Blasi.7 A newer general review is also available,8 while a related field, the CO2 gasification of coals, was surveyed in details in 2011.9 Several papers were published in the last two years, too, in this field.10-16 The results of these works, however, do not show a coherent picture. Among others they report activation energies from 93 till 355 kJ/mol.
A detailed analysis of the causes of this wide range is out of the scope of the present work. Nevertheless, we would like to emphasize two aspects. One is connected to the experiments. The majority of the works were based on such isothermal thermogravimetric (TGA) experiments where the samples are heated in inert gas flow till the selected isothermal temperatures. After reaching this temperature the gas flow is switched to CO2 or to a N2 –CO2 mixture. However, the stabilization of the CO2 concentration in the furnace is not instantaneous. In our opinion, the results of Naredi et al.17 should be taken into account in such works. Naredi et al. showed that a complete flushing of the inert gas from the apparatus typically takes around 20 minutes. They studied the CO2 gasification of coal chars at 850°C. When the gas flow was switched from N2 to CO2, the CO2
concentration started to increase, which caused an increase in the reaction rate. The time to reach the maximum reaction rate depended on the gas flow rate; it was 30, 22 and 10 min at gas flow rates of 50, 100 and 300 mL/min, respectively. Their observations are in accordance with the practice of the thermobalance – mass spectrometer experiments in other fields. The time needed to flush out a TGA furnace may be quite long;
sometimes flushing for 45 minutes is used.18 Though there are other techniques for the isothermal experiments, some transient time appears to be inevitable before a stable temperature and CO2 concentration is reached. In our opinion, a heat-up in CO2 (or in a CO2 containing gas flow) might be better if the heat-up periods are also evaluated together with the isothermal sections. The corresponding numerical methods are less simple than for the isothermal evaluation, but that should not be a problem in the 21st century. On the other hand, if we do not insist on the simple evaluation methods then we can employ a larger variety of T(t) functions in the
experiments. A good model must describe the behavior of the samples at any T(t) function. The aim should be to base the kinetic model and its parameters on a larger variety of experimental information. Particularly one can employ the special T(t) programs offered by the modern TGA instruments, including the ones based on sinus waves or the T(t) functions regulated by the instrument so that the reaction rate would not exceed a preset limit. (See more details in Section 2.2.) Two such papers have already been published in these directions regarding the CO2 gasification of chars.19,20 The present paper aims to extend this approach to the gasification of other, different chars. The goal is to obtain a dependable kinetic model where each model parameter is based on a large amount of experimental information.
2. SAMPLES AND METHODS
2.1 Samples. The raw materials were stem wood and forest residues containing branches, tops and needles and were obtained from a Norway spruce forest in South Norway. The work started with the pelletization of the raw materials. This pretreatment has in general considerable advantages in biomass utilization: the transportation, storage and handling of the pellets are easier. The lower moisture content and the decreased heterogeneity of the densified biomass also contribute to improved conversion technologies.21 The pelletization of forest residues look particularly attractive from these points of view. Accordingly the collected samples were ground and pressed to pellets of 6 mm diameter by a laboratory pelletizer without adding binders. Biswas et al.22 showed that pelletization alters both the structure of chars produced from biomass and the combustion properties. Based on their observations, changes in the gasification properties can also be expected.
The samples obtained from spruce wood and its forest residue are denoted as S and R. The pellets were ground and sieved to the size range 212 – 300 µm for the TGA measurements as well as for the char preparation in the drop tube reactor.
An electrically heated drop tube reactor (DTR)23 was used to produce char particles for kinetic evaluation. It was located in the Combustion Research Facility of the Sandia National Laboratory, USA. The particles were fed with a rate of 50 g/h and were heated in a nitrogen flow by a heating rate of about 104 °C/s till 1200°C. The residence time at 1200°C was around 0.2 s. The details about the drop tube reactor experiments can be found in our previous work. The chars produced in this way at 1200°C from S and R are denoted by S1200 and R1200 in the treatment. Table 1 shows proximate and ultimate analyses. The average particle sizes, measured by a Beckman Coulter LS230 Laser Diffraction Particle Size Analyzer, are also displayed in Table 1.
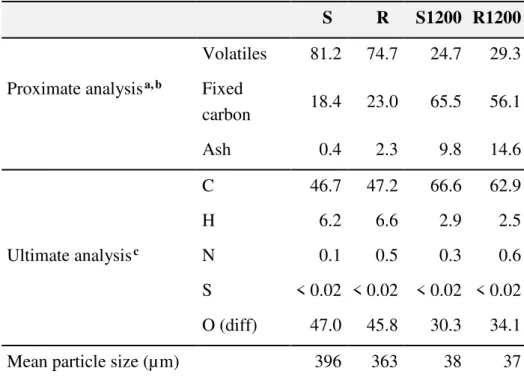
Table 1. Proximate and Ultimate Analysis and Mean Particle Size of the Pulverized Pellets and the Chars Produced in the DTR
S R S1200 R1200 Volatiles 81.2 74.7 24.7 29.3 Proximate analysisa, b Fixed
carbon 18.4 23.0 65.5 56.1
Ash 0.4 2.3 9.8 14.6
C 46.7 47.2 66.6 62.9
H 6.2 6.6 2.9 2.5
Ultimate analysisc N 0.1 0.5 0.3 0.6
S < 0.02 < 0.02 < 0.02 < 0.02 O (diff) 47.0 45.8 30.3 34.1
Mean particle size (µm) 396 363 38 37
a % (m/m), dry basis. b The proximate analysis of samples S1200 and R1200 was carried out by TGA.
c Measured by an Eurovector EA 3000 CHNS-O Elemental Analyser
The surface area of the samples plays a crucial role in the gasification reactions. Obviously the areas of the pores forming during the devolatilization are also interesting, hence the BET areas were measured after a devolatilization. This devolatilization was carried out in a TGA, under nitrogen flow, so that the heating rate and layer thickness would be close to the devolatilization of the samples in the actual gasification experiments.
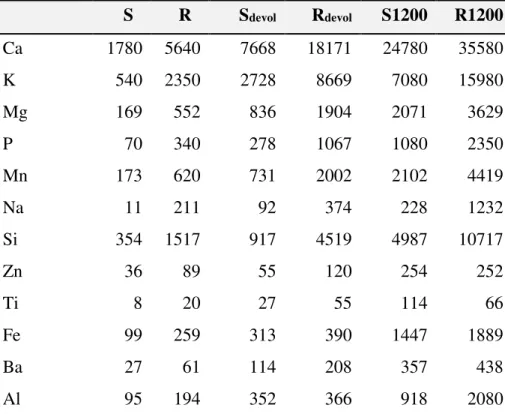
As shown in Section 3.1, the devolatilization and the gasification overlaps a bit. As a compromise 750°C was selected for the devolatilization temperature. The samples devolatilized in this way are denoted by the subscript “devol”. A BET analyzer, Micromeritics Tri Star 3000, was used for these measurements, at - 195.8°C with N2 as adsorbate after a degassing of 48 hours at room temperature. 333 ± 9, 264 ± 7, 306 ± 9 and 229 ± 6 m2/g BET areas were obtained for samples Sdevol, Rdevol, S1200devol and R1200devol, respectively. Table 2 shows the analysis of the inorganics in the samples, which was measured by ICP-OES according to standard CEN/TS 15290:2006. (The latter analysis was not carried out for samples S1200devol and R1200devol; the corresponding data can approximately be obtained from the concentrations of S1200 and R1200 by a multiplication of 1.3 and 1.4, respectively, where the multipliers are calculated from the volatile matter of S1200 and R1200.)
Table 2. The Concentration of Ash Forming Elements in the Samplesa
S R Sdevol Rdevol S1200 R1200
Ca 1780 5640 7668 18171 24780 35580
K 540 2350 2728 8669 7080 15980
Mg 169 552 836 1904 2071 3629
P 70 340 278 1067 1080 2350
Mn 173 620 731 2002 2102 4419
Na 11 211 92 374 228 1232
Si 354 1517 917 4519 4987 10717
Zn 36 89 55 120 254 252
Ti 8 20 27 55 114 66
Fe 99 259 313 390 1447 1889
Ba 27 61 114 208 357 438
Al 95 194 352 366 918 2080
amg/kg, dry basis. Only those elements are shown which were present in a concentration above 100 mg/kg in at least one of the samples.
2.2 TGA Experiments. The CO2 gasification was studied by a Q5000 IR analyzer from TA instruments which has a sensitivity of 0.1 µg. High purity CO2 was used as purge gas with a gas flow rate of 150 mL/min.
Particular care was taken to avoid the presence of oxygen traces because a char + O2 side reaction would result in disturbed TGA signals. The initial sample masses were chosen so that the amount of char at the beginning of the gasification would be around 1 – 1.5 mg. This caution is essential because the CO2 gasification has a high endothermic reaction heat.
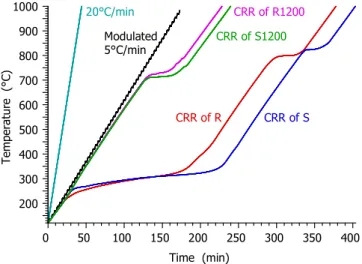
Three different temperature programs were employed: linear T(t) with a heating rate of 20°C/min; modulated experiments where a sine function with 5°C peak amplitude and 200 s wavelength was added to a 5°C/min linear T(t); and constant reaction rate (CRR) T(t). In the CRR experiments the equipment regulated the heating of the samples so that the reaction rate would remain below a preset limit.24 Figure 1 shows the employed temperature programs. Whenever the reaction rate reaches the preset limit, the heating rate of the CRR program is decreased. Note that samples R and S release high amount of volatiles, hence the corresponding T(t) curves (red and blue lines) have a long, flat section around 300°C. The next flat sections occur around 700- 800°C, where the gasification of the formed chars takes place. (See more details in Section Results and Discussion.)
Figure 1. The temperature programs employed in the study in the interval of 120 – 1000°C. Note that the CRR temperature programs, represented here by magenta, green, red and blue colors, depend on the reactions of the given sample, as described in the text.
The modulated and CRR temperature programs were employed to increase the information content of the data, as shown in earlier work.19-20
As the temperature was raised in the experiments, first a devolatilization took place which was followed by the gasification of the remaining chars. (See Section 3.1.) Only the gasification part of the experiments was evaluated.
2.3. Evaluation by the Method of Least Squares and Characterization of the Fit Quality.
Fortran 95 and C++ programs were used for the numerical calculations and for graphics handling, respectively.
The employed numerical methods have been described in details earlier.25 The kinetic evaluation was based on the least squares evaluation of the -dmobs/dt curves, where mobs is the sample mass normalized by the initial dry sample mass. The method used for the determination of -dmobs/dt does not introduce considerable systematic errors into the least squares kinetic evaluation of experimental results.26 The kinetic models were solved numerically along the empirical temperature – time functions. The minimization of the least squares sum was carried out by a direct search method, as described earlier.25 This was based on the Hook-Jeeves algorithm, which is a slow, but “very reliable” numerical method.27
Such values were searched for the unknown model parameters that minimized the following objective function (of):
of = ∑$ !" !#∑ 1
Here Nexper is the number of experiments evaluated together, Npoints denotes the number of ti time points on a given curve, and m is the sample mass normalized by the initial dry sample mass. The division by ℎ$' served to counterbalance the high magnitude differences of the experiments. hk was chosen to be the highest observed value of the given experiment:
hk = max -.- $/01 2
Time (min)
Temperature (°C)
20°C/min Modulated 5°C/min
CRR of R1200 CRR of S1200
CRR of R CRR of S
0 50 100 150 200 250 300 350 400
200 300 400 500 600 700 800 900 1000
The normalization by the highest observed values in the least squares sum assumes implicitly that the relative precision is roughly the same for the different experiments. This assumption has proved to be useful in numerous works on non-isothermal kinetics since 1993.28
The obtained fit quality can be characterized separately for each of the experiments evaluated together. For this purpose the relative deviation (reldev, %) was used. The root mean square difference between the observed and calculated values is expressed as percent of peak maximum. For experiment k we get:
reldev % = 100
{
∑}
0.5 3)The fit quality for a given group of experiments was characterized by the root mean square of the corresponding relative deviations. The overall fit quality of a group of experiments is characterized by the root means square of the reldev values of the individual experiments. The number of the experiments is indicated by a subscript in such cases: reldev3 or reldev12. (See Sections 3.3 and 3.4.)
2.4. Reaction Kinetic Models. When the gasification reaction is far from the equilibrium, the kinetics can usually be well described by the following type of equations:7
dα/dt = A exp(-E/RT) f(α) (4)
where A is the pre-exponential factor, α is the reacted fraction predicted by the kinetic model, and function f(α) approximates the reactivity change of the sample as the gasification proceeds. A obviously depends on the partial pressure of the CO2. In the present study the A values belong to pure CO2 at atmospheric pressure.
α has the following connection with mcalc:
? @ =..A .
A .B (5a)
-dmcalc/dt = (CDEFGE-CHEFGE) α(t) = cdα/dt (5b)
Here CDEFGE and CHEFGE are the predicted sample mass values at the beginning and at the end of the gasification. The numerical solution of eq 4 along an experimental T(t) provides dα/dt as function of t at a given set of kinetic parameters. The multiplication of dα/dt by c=CDEFGE-CHEFGE yields the calculated mass loss rate for the method of least squares. c cannot be read directly from the TGA curves exactly because the gasification is not separated perfectly from the devolatilization, as shown in the next section. Accordingly c is one of the model parameters to be determined by the method of least squares.
Two empirical approximations were used for the f(α) functions in the present work. The simplest is the n- order kinetics:
f(α) ≅ (1-α)n (6)
However, the n-order kinetics cannot describe the self-accelerations caused by the opening and growth of the internal pores during the gasification. To check the occurrence of such an effect and to describe it approximately the following equation was employed:
f(α) ≅ normfactor (1-α)n(α+z) (7)
Eq 7 is a special case of a formula that has been used in several gasification and combustion studies since 1996.29 In this approximation n and z are formal parameters that define the shape of the corresponding f(α).
The use of eq 7 can be termed nz kinetics. There are theoretical models to describe the roles of the internal pores which have been deduced for ideal cases, assuming pure carbon particles of regular shape.30,31 The gasification of a real char, however, differs from the ideal behavior by several complicating factors, including the presence of the mineral matter and the irregular geometry.
As discussed in the next sections, a side reaction was observed during the gasification of samples S and R.
Consequently two parallel reactions were needed for the description of these samples. The heterogeneity of the chars formed from S and R were described by assuming two parts (two pseudo-components) with differing reactivities. Each pseudo-component had its own reacted fraction, respectively α1 and α2, and its own kinetic equation:
dαi/dt = Ai exp(-Ei/RT) f(αi) i= 1, 2 (8)
The predicted mass loss rate, -dmcalc/dt, is a weighted sum of the two partial reaction rates:
-dmcalc/dt = c1dα1/dt + c2dα2/dt (9)
Here the weight factors c1 and c2 are parameters to be determined by the method of least squares together with the other model parameters.
3. RESULTS AND DISCUSSION
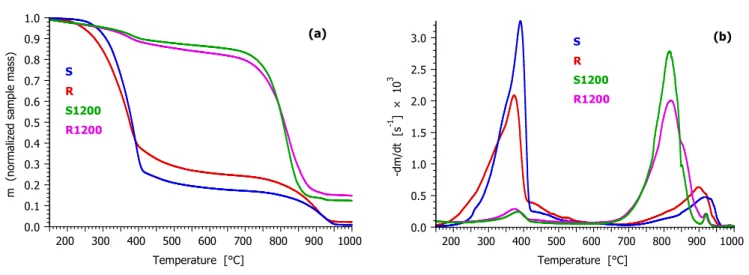
3.1. Major Differences between the Reactivity of the Chars. Figure 2 compares the behavior of the samples at 20°C/min heating rate. As one can expect, samples S and R release a high amount of volatiles during the heating till the domain of gasification. As Figure 2b shows, the gasification becomes the dominant reaction around 700°C for these samples. Samples S1200 and R1200 undergo devolatilization to a lesser extent, with around 15 and 18% of the initial mass released till 650°C, respectively. This devolatilization indicates that the heating of the individual particles in the drop tube reactor was not uniform; i.e. that a smaller internal part of especially the larger particles did not, or did not fully, carbonize. This inhomogeneity is probably due to the high heating rate (104 °C/s) and short residence time (0.2s).
Figure 2. Comparison of the mass loss and mass loss rate of the samples at 20°C/min heating rate.
(a)
S R S1200 R1200
Temperature [°C]
m (normalized sample mass)
200 300 400 500 600 700 800 900 1000 0.0
0.1 0.2 0.3 0.4 0.5 0.6 0.7 0.8 0.9 1.0
S (b)
R S1200 R1200
Temperature [°C]
-dm/dt [s-1 ] × 103
200 300 400 500 600 700 800 900 1000 0.0
0.5 1.0 1.5 2.0 2.5 3.0
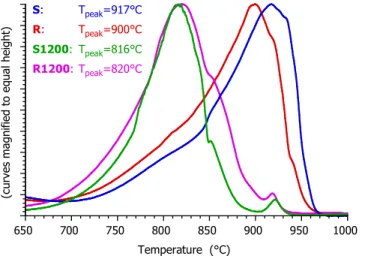
Figure 3. Comparison of the gasification of the samples in the domain of 650 – 1000 °C at 20°C/min heating rate. Here the –dm/dt curves are magnified to equal height for a better view.
Figure 3 zooms in the gasification region, from 650°C till 1000°C. Here the mass loss rate curves are magnified to equal height for an easier overview. It is interesting to note that the chars produced in the drop tube reactor, R1200 and S1200, are much more reactive than the chars formed from R and S from slow pyrolysis. The difference between the peak temperatures is around 100°C for the stem wood samples (S and S1200) while it is around 80°C for the for the forest residue samples (R and R1200). The pyrolysis heating rate is known to affect the char reactivity.32-34,10,11 In the remaining part of this section the data of the present work are examined in this respect.
As the values in Section 2.1 show, the BET areas cannot explain the higher reactivity of the DTR chars.
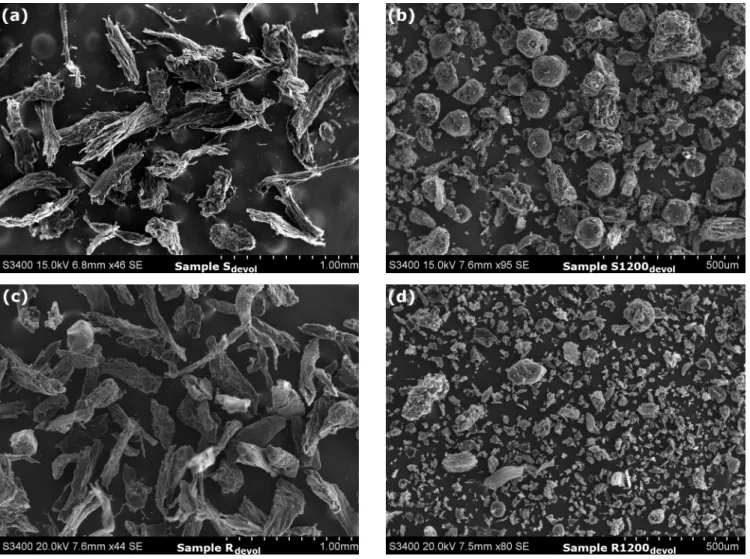
However, the slow pyrolysis mainly produces chars with micropore structure while the pyrolysis with high heating rates results in larger internal cavities and a more open microstructure due to the internal overpressure and the coalescence of the smaller pores during the fast volatile release.33,34 Besides, the particle size also plays a crucial role in the char gasification.35,36 In this respect Table 1 indicates 10-times differences between the mean particle size of the ground pellets and the drop tube reactor char particles. However the pyrolysis of these samples in the TGA may alter the original particle sizes. To clarify the situation, SEM pictures were obtained on the chars after the devolatilization procedure described in Section 2.1. The results, shown in Figure 4, indicate considerably smaller particles for samples S1200devol and R1200devol than for samples Sdevol and Rdevol. (Note that samples S1200devol and R1200devol are shown at higher magnification in Figure 4 than samples Sdevol
and Rdevol.)
Besides the structural differences, the higher mineral content may also contribute to the higher reactivity of the DTR chars. The catalytic effect of minerals on the gasification is well known.7,8
Temperature (°C)
(curves magnified to equal height)
S:
R:
S1200:
R1200:
Tpeak=917°C Tpeak=900°C Tpeak=816°C Tpeak=820°C
650 700 750 800 850 900 950 1000
Figure 4. SEM images of the samples after devolatilization in nitrogen at 750°C. Note that the magnification of samples S1200devol and R1200devol (panels (b) and (d) on the right) are around twice as high as that of samples Sdevol and Rdevol (panels (a) and (c) on the left).
3.2. Inhomogeneities as Reflected by the Mass-Loss Rate curves. As Figure 3 shows, the gasification of Samples S and R occurs in much wider temperature intervals than that of samples S1200 and R1200. A smaller part of the S and R samples react between ca. 700 and 850°C at the heating rate of Figure 3 while the main part of these chars gasifies at higher temperatures with peak temperatures between 900 and 950°C. This observation is taken into account in the kinetic description, as shown in the next section.
Figure 3 also shows that gasification of Samples S1200 and R1200 is followed by a small, sharp peak around 920°C. This side peak appears whenever the gasification terminated below ca. 900°C. It can be attributed to calcium carbonate decomposition. In the presence of CO2 the calcium carbonate decomposes above 900°C, as it was reported many years ago,37 while the calcium oxide and the organic calcium salt content of the samples transform into CaCO3 until this temperature. A calcium carbonate decomposition can be assumed in all of our experiments, though it is not visible when the main gasification peak occurs at higher temperatures. The thermal decomposition of CaCO3 is a well-known reversible reaction,38 and its modelling is out of the scope of the present study. Accordingly the domain of the kinetic evaluation was limited to below the CaCO3 peak whenever this peak was not concealed by the main peak of the gasification.
3.3. Results of the Kinetic Evaluation. As mentioned above, the gasification of samples S and R occurred in a rather wide interval. This phenomena did not occur in our earlier work on an untreated Norway spruce sample.20 Presumably it can be attributed to the effects of the pelletization. Note that the pelletization alters the structure of the formed chars, as mentioned in Section 2.1.22 The gasification kinetics of samples S and R could not be described by a single reaction: The approximation by a single kinetic equation resulted in poor fit quality and unrealistically low activation energies. Accordingly the gasification of S and R was described by two kinetic equations: one for the main peak, and one for the more reactive part that gasified at lower temperatures than the main peak. Hence, the formed char was assumed to contain two parts (two pseudo- components) with differing reactivity. The corresponding mathematical equations were described in Section 2.4, above.
The results obtained in this way are presented in the following order: First the partial curves and the fit qualities are shown in Figure 5 for all temperature programs. This is followed by further details, including the type and shape of the f(α) functions; the handling of the thermal annealing in the model; and the values of the obtained kinetic parameters. As Figure 5 shows, the side peaks, denoted by blue color, are highly overlapped by the main peaks (denoted by red color). As a consequence, the kinetic parameters of the side peaks are not defined uniquely. To solve this problem we considered the findings of our earlier work on CO2
gasification.19,20 These works showed that the kinetic evaluation of different chars resulted in practically identical activation energies, while the reactivity differences could be described by different pre-exponential factors and f(α) parameters. Accordingly, identical activation energies were assumed for the main and side reactions, i.e. the Emain=Eside constraint was employed in the evaluation. As a further simplification, only n- order kinetics was employed here.
The gasification of samples S1200 and R1200 occurred in a narrower temperature domain. The shape of the resulting peaks contained some irregularities but they did not hinder the description of the gasification of S1200 and R1200 by one kinetic equation, as shown in Figure 5.
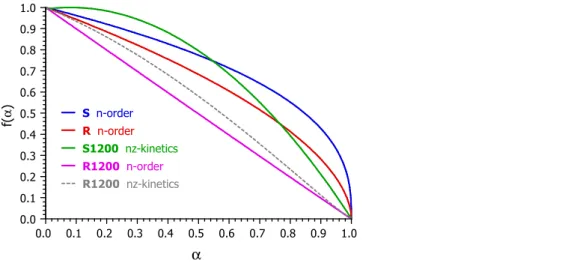
Figure 6 shows the obtained f(α) functions. The evaluation of the experiments on S1200 by eq 7 resulted in an autocatalytic type of kinetics with a slight acceleration for the lower values of α. (See the green curve in Figure 6.) In this case the evaluation by n-order kinetics gave only a rough approximation with considerably higher reldev3.
The evaluation of the R1200 experiments by eq 7 resulted in an f(α) without a self-acceleration section. (See the slightly curved, gray, dashed line in Figure 6, which has not been used in the presented results.) Hence n- order kinetics was employed here, which resulted in a practically first order reaction kinetics (n=1.01). The corresponding f(α) is represented by magenta color in Figure 6.
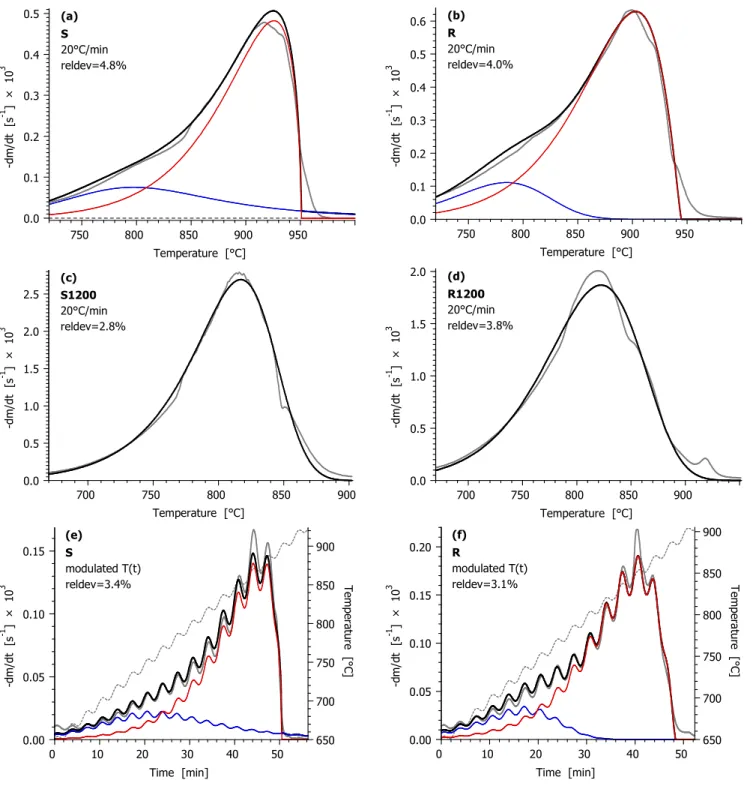
Figure 5. The results of the kinetic evaluation for the temperature programs used in the study. Notation:
experimental DTG curves normalized by the initial sample mass (gray solid line); their calculated counterpart (black solid line); modulated and CRR temperature programs (gray dashed line). For samples S and R the partial curves of the main and side reactions are also indicated by thin lines of red and blue colors. (To be continued on the next page.)
(a) S 20°C/min reldev=4.8%
Temperature [°C]
-dm/dt [s-1 ] × 103
750 800 850 900 950
0.0 0.1 0.2 0.3 0.4
0.5 (b)
R 20°C/min reldev=4.0%
Temperature [°C]
-dm/dt [s-1 ] × 103
750 800 850 900 950
0.0 0.1 0.2 0.3 0.4 0.5 0.6
(c) S1200 20°C/min reldev=2.8%
Temperature [°C]
-dm/dt [s-1 ] × 103
700 750 800 850 900
0.0 0.5 1.0 1.5 2.0 2.5
(d) R1200 20°C/min reldev=3.8%
Temperature [°C]
-dm/dt [s-1 ] × 103
700 750 800 850 900
0.0 0.5 1.0 1.5 2.0
(e) S
modulated T(t) reldev=3.4%
Time [min]
-dm/dt [s-1 ] × 103 Temperature [°C]
0 10 20 30 40 50
0.00 0.05 0.10 0.15
650 700 750 800 850 900
(f) R
modulated T(t) reldev=3.1%
Time [min]
-dm/dt [s-1 ] × 103 Temperature [°C]
0 10 20 30 40 50
0.00 0.05 0.10 0.15 0.20
650 700 750 800 850 900
(Figure 5 continued.)
(g) S1200 modulated T(t) reldev=2.6%
Time [min]
-dm/dt [s-1 ] × 103 Temperature [°C]
100 110 120 130 140 150
0.0 0.1 0.2 0.3 0.4 0.5 0.6 0.7 0.8 0.9
600 650 700 750 800 850
900 (h)
R1200 modulated T(t) reldev=3.2%
Time [min]
-dm/dt [s-1 ] × 103 Temperature [°C]
100 110 120 130 140 150
0.0 0.1 0.2 0.3 0.4 0.5 0.6
600 650 700 750 800 850 900
(i) S CRR reldev=3.6%
Time [min]
-dm/dt [s-1 ] × 103 Temperature [°C]
0 10 20 30 40 50 60 70 80
0.00 0.02 0.04 0.06
650 700 750 800 850
900 (j)
R CRR
reldev=4.1%
Time [min]
-dm/dt [s-1 ] × 103 Temperature [°C]
0 10 20 30 40 50 60 70 80 90
0.00 0.02 0.04 0.06
650 700 750 800 850
(k) S1200 CRR
reldev=4.2%
Time [min]
-dm/dt [s-1 ] × 103 Temperature [°C]
120 140 160 180 200
0.00 0.05 0.10 0.15 0.20
600 650 700 750 800 850
900 (l)
R1200 CRR
reldev=4.3%
Time [min]
-dm/dt [s-1 ] × 103 Temperature [°C]
120 140 160 180 200
0.00 0.05 0.10 0.15 0.20
600 650 700 750 800 850
Figure 6. The shape of the obtained f(α)functions
3.4. Activation Energies. Strong compensation effects were observed during the evaluation: the effect of a small alteration of the activation energy on the fit quality could be highly compensated by the rest of the kinetic parameters. This is a mathematical characteristic of the models employed at the given range of parameters.
The compensation effects hindered the precise operation of the numerical optimization method that served for the minimization. The numerical problems could be solved so that the evaluations were carried out at 25 fixed E values, from 218 to 232 kJ/mol with an increment of 1 kJ/mol. (If E is a fixed value in a given least squares optimization, then, obviously, the compensation effects between E and the rest of the parameters cannot appear within that particular optimization.) In this way the relative deviations were obtained as a function of E, and their lowest value could be selected. Obviously this procedure is also the application of the method of least squares; the outlined strategy served only to improve the precision of the numerical minimization under the given circumstances.
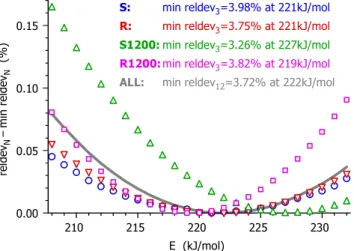
Figure 7 shows how the reldev3 values depend on the activation energy. In order to plot several curves in a single figure with a proper visibility, the alteration from the optimal values were plotted, i.e. the reldev3 – min reldev3 differences. The subtracted min reldev3 values are listed in the figure together with the E values that belong to these minima. Figures 5 and 6 correspond to the optimal E values listed in Figure 7: 221, 221, 227 and 219 kJ/mol for samples S, R, S1200 and R1200, respectively. The rest of the parameters belonging to these optima are given in the next section.
It is possible to evaluate the four samples by assuming a common activation energy value, as shown by the gray curve in Figure 7. In this case the relative deviations were calculated for all the 12 experiments, and the reldev12 – min reldev12 differences were plotted as function of E. The results obtained in this way are not shown in the paper; as they proved to be similar to the ones presented.
S n-order R n-order S1200 nz-kinetics R1200 n-order R1200 nz-kinetics
α
f(α)
0.0 0.1 0.2 0.3 0.4 0.5 0.6 0.7 0.8 0.9 1.0 0.0
0.1 0.2 0.3 0.4 0.5 0.6 0.7 0.8 0.9 1.0
Figure 7. The dependence of the fit quality on the activation energy. The alterations of the reldev3 values from their minimum were plotted for the four samples at each integer E from 208 till 232 kJ/mol. The corresponding reldev12 data, characterizing the overall fit for the 12 experiments of the four samples, were also plotted at each integer E. These points were connected by a thick gray line for a better visibility.
Figure 7 indicates that the fit quality only slightly depended on the choice of E. Nevertheless, the minima of the curves were close to each other. E=221 kJ/mol was obtained for both S and R, while 227 and 219 kJ/mol were found for S1200 and R1200. Note that these values fell in a narrow range, the difference between the highest and the lowest value was only 8 kJ/mol (less than 4%). As a comparison, a round-robin study can be considered.39 In that work the thermal decomposition of a well-defined, high-purity cellulose sample was studied, and the obtained activation energies scattered in intervals of around 20 kJ/mol widths.
The E values obtained in the present study show a notable agreement with the former studies carried out by similar experimental and evaluation methods. Wang et al. obtained 218 – 225 kJ/mol activation energies for chars that were prepared from untreated Norway spruce and its forest residue by a slow heating till 950°C and a 7 min residence time there.19 In another work activation energy values between 219 and 227 kJ/mol were obtained for spruce and birch chars prepared by various low heating rate programs.20
3.5. Thermal Annealing. At elevated temperatures the chemical structures of the chars gradually rearrange with the loss of a low amount of volatiles.40-42 This process, called thermal annealing or thermal deactivation, takes place simultaneously with the CO2 gasification.40 The rate of the gasification sharply increases with the temperature while the annealing remains a slow process. Hence the annealing occurs to a higher extent when the experimental conditions lead to a slower gasification. Accordingly the kinetics cannot be described by exactly the same parameters at different T(t) programs. The reactivity differences can be expressed by different pre-exponential factors while the rest of the parameters are assumed to be identical in the experiments on a given sample.20 This method was used in the present work, too. Table 3 displays the kinetic parameters obtained. The pre-exponential factors belonging to the heating at 20°C/min were listed. The differences between the pre-exponential factors of these experiments and a slower T(t) were also indicated. For this purpose the modulated experiments were chosen, because the T(t) of the CRR experiments vary from experiment to experiment. Note that the mean heating rate of the modulated experiments is one fourth of the heating rate of the linear T(t) experiments, as outlined in Section 2.2. The pre-exponential factors are lower at slower T(t), as a consequence of the thermal deactivation. The differences vary from 0.06 to 0.13. If the higher
E (kJ/mol) reldevN–min reldevN (%)
S: min reldev3=3.98% at 221kJ/mol R: min reldev3=3.75% at 221kJ/mol S1200:min reldev3=3.26% at 227kJ/mol R1200:min reldev3=3.82% at 219kJ/mol ALL: min reldev12=3.72% at 222kJ/mol
210 215 220 225 230
0.00 0.05 0.10 0.15
pre-exponential factors are used for simulation at the T(t) function of the modulated experiment, the simulated curves shift to lower temperatures. The differences were listed at the middle points of the curves, where α=0.5.
(T0.5). As the last row of Table 3 indicates, the ∆T0.5 differences fell between -7 and -18°C. ∆T0.5 had lower absolute values for the DTR chars.
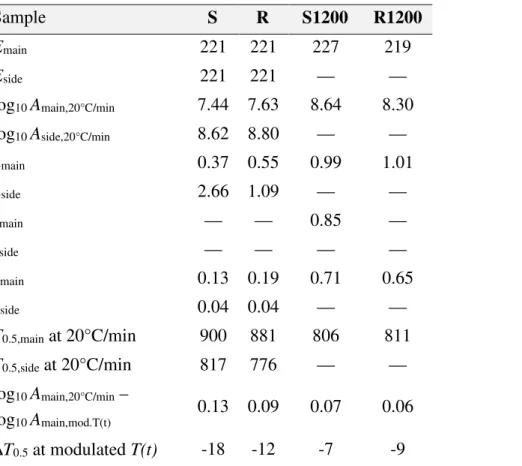
Table 3. Kinetic Parametersa, Reaction Temperaturesb, and Thermal Annealingc
Sample S R S1200 R1200
Emain 221 221 227 219
Eside 221 221 — —
log10 Amain,20°C/min 7.44 7.63 8.64 8.30
log10 Aside,20°C/min 8.62 8.80 — —
nmain 0.37 0.55 0.99 1.01
nside 2.66 1.09 — —
zmain — — 0.85 —
zside — — — —
cmain 0.13 0.19 0.71 0.65
cside 0.04 0.04 — —
T0.5,main at 20°C/min 900 881 806 811
T0.5,side at 20°C/min 817 776 — —
log10 Amain,20°C/min – log10 Amain,mod.T(t)
0.13 0.09 0.07 0.06
∆T0.5 at modulated T(t) -18 -12 -7 -9
a The dimensions of E and A are kJ/mol and s-1. n, z and c are dimensionless. (See equations 5 – 9.)
b The reaction temperatures were characterized by the temperatures at which the simulated curves reached the α=0.5 points (T0.5, °C).
c The effect of the thermal annealing on the reactivity was described by a dependence of the pre-exponential factors on the temperature programs, as outlined in the text. This dependence was characterized by the difference of the log10 A values obtained at 20°C/min and at the much slower modulated T(t). The effect of the thermal annealing on the reaction temperature was characterized by the ∆T0.5 difference of the curves simulated by Amain,20°C/min and Amain,mod.T(t) at the modulated T(t) function of the study.
4. CONCLUSIONS
The CO2 gasification of chars was studied in this work. The chars were prepared by high and low heating rates from spruce and its forest residue. The kinetic evaluation was based on the least squares evaluation of TGA experiments with linear, modulated, and constant-reaction rate temperature programs.
In accordance with the literature, the DTR chars had higher reactivity than the chars formed at low heating rates, as one could expect. The difference was high: the gasification of the DTR chars took place at 80–100°C lower temperatures. The pelletization of the raw materials had a marked effect on the gasification of the low heating rate chars: a side reaction appeared at 80 – 100 °C below the main peak of the gasification. Accordingly
the gasification of the low temperature chars was based on a kinetic model with two partial reactions. This complication was not observed for the DTR chars.
The thermal annealing of the chars during the gasification experiments was taken into account by the pre- exponential factors that were allowed to have different values at different temperature programs, similarly to an earlier work of the authors.20 A particularly strong compensation effect was observed between the kinetic parameters. Despite the strong compensation effects, the obtained E values varied in a narrow interval (from 219 till 227 kJ/mol) and were practically identical to the ones obtained in works employing similar kinetic evaluation procedures on other chars.19,20 Accordingly chars with different origin and method of preparation can be modelled by a common activation energy and the reactivity differences can be described by the other kinetic parameters.
ACKNOWLEDGMENT
The authors acknowledge the financial support by the Research Council of Norway and a number of industrial partners through the projects GasBio (“Gasification for Biofuels”) and BioCarb+ (“Enabling the Biocarbon Value Chain for Energy”).
NOMENCLATURE
α = reacted fraction (dimensionless) A = pre-exponential factor in eq 4 (s-1)
c = conversion factor between dα/dt and –dm/dt in eq 5b, and weight factor of a partial curve in eq 9.
E = activation energy (kJ/mol)
f = an empirical function in eq 4 expressing the change of the reactivity as the reactions proceed (dimensionless)
h = the height of an experimental –dm/dt curve (s-1)
m = the sample mass normalized by the initial sample mass (dimensionless) n = reaction order with respect of 1-α (dimensionless)
of = the objective function minimized in the least squares evaluation (dimensionless) Nexper = number of experiments evaluated together by the method of least squares Npoints = number of evaluated data on a given experimental curve
R = gas constant (8.3143×10⁻³ kJ mol-1 K-1)
reldev = the root mean square difference between the predicted and observed data expressed as percent of the corresponding peak height (eq 3)
reldev3 and reldev12 = the root mean square of the reldev values of 3 or 12 experiments evaluated together.
t = time (s)
T = temperature (°C, K)
z = formal parameter in eq 7 (dimensionless)
REFERENCES
1. Wang, L.; Skjevrak, G.; Hustad, J. E.; Grønli, M. G. Effects of sewage sludge and marble sludge addition on slag characteristics during wood waste pellets combustion. Energy Fuels 2011, 25, 5775-5785.
2. Brough, P.; Rørstad, P. K.; Breland, T. A.; Trømborg, E. Exploring Norwegian forest owner's intentions to provide harvest residues for bioenergy. Biomass and Bioenergy 2013, 57, 57-67.
3. Werkelin, J.; Skrifvars, B.-J.; Zevenhoven, M.; Holmbom, B.; Hupa M. Chemical forms of ash-forming elements in woody biomass fuels. Fuel 2010, 89, 481-493.
4. Ahmed, I. I.; Gupta, A. K. Kinetics of woodchips char gasification with steam and carbon dioxide. Appl. Energy 2011, 88, 1613-1619.
5. Prins, M. J.; Ptasinski, K. J.; Janssen, F. J. J. G. From coal to biomass gasification: Comparison of thermodynamic efficiency. Energy 2007, 32, 1248-1259.
6. Abdullah, H.; Wu, H. Biochar as a Fuel: 1. Properties and Grindability of Biochars Produced from the Pyrolysis of Mallee Wood under Slow-Heating Conditions. Energy Fuels 2009, 23, 4174-4181.
7. Di Blasi, C. Combustion and gasification rates of lignocellulosic chars. Prog. Energy Combust. Sci. 2009, 35, 121-140.
8. Lahijani, P.; Zainal, Z. A.; Mohammadi, M.; Mohamed, A. R. Conversion of the greenhouse gas CO2 to the fuel gas CO via the Boudouard reaction: A review. Renew. Sustain. Energy Rev. 2015, 41, 615–632.
9. Irfan, M. F.; Usman, M. R.; Kusakabe, K. Coal gasification in CO2 atmosphere and its kinetics since 1948: A brief review. Energy 2011, 36, 12-40.
10. Kirtania, K.; Bhattacharya, S. CO2 gasification kinetics of algal and woody char procured under different pyrolysis conditions and heating rates. ACS Sustain. Chem. Eng. 2015, 3, 365-373.
11. Alvarez, J.; Lopez, G.; Amutio, M.; Bilbao, J.; Olazar, M. Kinetic study of carbon dioxide gasification of rice husk fast pyrolysis char. Energy Fuels 2015, 29, 3198-3207.
12. Perander, M.; DeMartini, N.; Brink, A.; Kramb, J.; Karlström, O.; Hemming, J.; Moilanen, A.; Konttinen, J.;
Hupa, M. Catalytic effect of Ca and K on CO2 gasification of spruce wood char. Fuel 2015, 150, 464-472.
13. Bui, H. H.; Wang, L.; Tran, K. Q.; Skreiberg, Ø. CO2 gasification of charcoals produced at various pressures.
Fuel Processing Technology 2016, 152, 207-214.
14. Gao, X.; Zhang, Y.; Li, B.; Zhao, Y.; Jiang, B. Determination of the intrinsic reactivities for carbon dioxide gasification of rice husk chars through using random pore model. Biores. Technol. 2016, 218, 1073-1081.
15. Wang, G.; Zhang, J.; Shao, J.; Liu, Z.; Wang, H.; Li, X.; Zhang, P.; Geng, W.; Zhang, G. Experimental and modeling studies on CO2 gasification of biomass chars. Energy 2016, 114, 143-154.
16. Kirtania, K.; Axelsson, J.; Matsakas, L.; Christakopoulos, P.; Umeki, K.; Furusjö, E. Kinetic study of catalytic gasification of wood char impregnated with different alkali salts. Energy 2017, 118, 1055-1065.
17. Naredi, P.; Yeboah, Y. D.; Pisupati, S. V. Effect of furnace purging on kinetic rate parameter determination using isothermal thermogravimetric analysis. Energy Fuels 2011, 25, 4937−4943.
18. Várhegyi, G.; Czégény, Zs.; Jakab, E.; McAdam, K.; Liu, C. Tobacco pyrolysis. Kinetic evaluation of thermogravimetric – mass spectrometric experiments. J. Anal. Appl. Pyrolysis 2009, 86, 310-322.
19. Wang, L.; Sandquist, J.; Várhegyi, G.; Matas Güell, B. CO2 Gasification of Chars Prepared from Wood and Forest Residue. A Kinetic Study. Energy Fuels 2013, 27, 6098–6107.
20. Wang, L.; Várhegyi, G.; Skreiberg, Ø. CO2 Gasification of torrefied wood. A kinetic study. Energy Fuels 2014, 28, 7582-7590.
21. Erlich, C.; Björnbom, E.; Bolado, D.; Giner, M., Fransson, T. H. Pyrolysis and gasification of pellets from sugar cane bagasse and wood. Fuel 2006, 85, 1535-1540.
22. Biswas, A. K.; Rudolfsson, M.; Broström, M.; Umeki, K. Effect of pelletizing conditions on combustion behaviour of single wood pellet. Applied Energy 2014, 119, 79-84.
23. Li, T.; Wang, L.; Ku, X.; Güell, B.M.; Løvås, T.; Shaddix, C. R. Experimental and modeling study of the effect of torrefaction on the rapid devolatilization of biomass. Energy Fuels 2015, 29, 4328-4338.
24. High resolution thermogravemetric analysis - A new technique for obtaining superior analytical results. TA Instruments report TA-023. Available at: http://www.tainstruments.com/pdf/literature/TA023.pdf
25. Várhegyi, G.; Sebestyén, Z.; Czégény, Z.; Lezsovits, F.; Könczöl, S. Combustion kinetics of biomass materials in the kinetic regime. Energy Fuels 2012, 26, 1323-1335.
26. Várhegyi, G.; Chen, H.; Godoy, S. Thermal decomposition of wheat, oat, barley and Brassica carinata straws. A kinetic study. Energy Fuels 2009, 23, 646-652.
27. Kolda, T. G.; Lewis, R. M.; Torczon, V. Optimization by direct search: New perspectives on some classical and modern methods. SIAM Rev. 2003, 45, 385-482.
28. Várhegyi, G.; Szabó, P.; Mok W. S. L., Antal, M. J., Jr. Kinetics of the thermal decomposition of cellulose in sealed vessels at elevated pressures. Effects of the presence of water on the reaction mechanism. J. Anal. Appl. Pyrolysis 1993, 26, 159-174.
29. Várhegyi, G.; Szabó, P.; Jakab, E.; Till, F.; Richard J-R. Mathematical modeling of char reactivity in Ar-O2 and CO2-O2 mixtures. Energy Fuels 1996, 10, 1208-1214.
30. Bhatia; S. K; Perlmutter, D. D. A random pore model for fluid–solid reactions: I. Isothermal kinetic control.
AIChE J. 1980, 26, 379-386.
31. Gavals, G. R. A random capillary model with application to char gasification at chemically controlled rates.
AIChE J. 1980, 26, 577-585.
32. Kurosaki, F.; Ishimaru, K.; Hata, T.; Bronsveld, P.; Kobayashi, E.; Imamura, Y. Microstructure of wood charcoal prepared by flash heating. Carbon 2003, 41, 3057-62.
33. Cetin, E.; Moghtaderi, B.; Gupta, R.; Wall T. F. Influence of pyrolysis conditions on the structure and gasification reactivity of biomass chars. Fuel 2004, 83, 2139-50.
34. Cetin, E.; Gupta, R.; Moghtaderi, B. Effect of pyrolysis pressure and heating rate on radiata pine char structure and apparent gasification reactivity. Fuel 2005, 84, 1328-34.
35. Gómez-Barea, A.; Ollero, P.; Fernández-Baco, C. Diffusional Effects in CO2 Gasification Experiments with Single Biomass Char Particles. 1. Experimental Investigation. Energy Fuels 2006, 20, 2202-10.
36. Mani, T.; Mahinpey, N.; Murugan, P. Reaction kinetics and mass transfer studies of biomass char gasification with CO2. Chem. Eng. Sci. 2011, 66, 36-41.
37. Duval, C. Inorganic Thermogravimetric Analysis. Second and Revised Edition, American Elsevier, New York, 1963.
38. Jüntgen, H.; Van Heek, K. H. Non-isothermal kinetics of reversible reactions taking as an example the thermal decomposition of CaCO3. Proc. 3rd Internat. Conf. Thermal Analysis, Vol. 2, Ed. Wiedemann, H. G., Birkhäeuser Verlag, Basel, 1972, 423-428.
39. Grønli, M.; Antal, M. J., Jr.; Várhegyi, G. A round-robin study of cellulose pyrolysis kinetics by thermogravimetry. Ind. Eng. Chem. Res. 1999, 38, 2238-2244.
40. Senneca, O.; Russo, P.; Salatino, P.; Masi, S. The relevance of thermal annealing to the evolution of coal char gasification reactivity. Carbon 1997, 35, 141-151.
41. Zolin, A.; Jensen, A.; Dam-Johansen, K.; Jensen, L. S. Influence of experimental protocol on activation energy in char gasification: the effect of thermal annealing. Fuel 2001, 80, 1029-1032.
42. Yip, K.; Xu, M.; Li, C-Z.; Jiang, S. P.; Wu, H. Biochar as a fuel: 3. Mechanistic understanding on biochar thermal annealing at mild temperatures and its effect on biochar reactivity. Energy Fuels, 2011, 25, 406-414.