Judit Sági – István Engelberth
Regional Development and Well-Being
of Regions in Hungary 1
Summary
The purpose of this study is to formulate policy views from the perceived trends in re- gional development, as measured by the change in regional well-being indicators and urban prosperity factors. The theoretical foundations of these development policies are formulated by place-based regional strategies. Based on the OECD database on well-being indicators, ranking by the Global Urban Competitiveness Research Centre and the International Congress and Convention Association, the authors have found that despite regional disparities and the centrum-periphery gaps, well-being in Hun- garian regions has improved. Moreover, Budapest has good potentials in strength- ening connections and accelerating development, and may display its advantages in attracting global production factors.
Journal of Economic Literature (JEL) codes: R11, R12, R13, O47, O18
Keywords: regional development, regional well-being, Hungarian regions, centrum- periphery, regional governmental policy, urban prosperity
Dr Judit Sági, Associate Professor, Finance Department, Institute of Finance and Accounting, Budapest Business School (Sagi.Judit@uni-bge.hu); Dr István Engel- berth, Associate Professor, Department of Economics, Institute of Finance and Accountancy, Budapest Business School (Engelberth.Istvan@uni-bge.hu).
Introduction
The main purpose of this study is to depict the trends of development and regional well-being of the Hungarian regions, and to formulate policy views, by reviewing inno- vative theories and countermeasures for regional strategies. During the past decades great concern have been shared among scholars about the sufficiency of regional place-based strategies which employ tailor-made recommendations to obtain a solu- tion designed for the local particularities. Such particularities can be shared or dif- ferentiated in regional development (Storper, 2011, pp. 333-346).
The process of regional development is necessarily spatial, and requires an appre- ciation of the geographical concepts of space, territory, place and scale (Pike et al., 2007). The authors assume that regional well-being and urban prosperity are closely related, as they represent two complementary sides of sustainable development. On one hand, the material and quality well-being of regions (including to investment to physical infrastructure and human capital) lays the foundation of prosperity. On the other hand, more competitive cities attract skills and capital, thus creating a virtuous cycle of prosperity for all (Henderson, 2010, pp. 515-540).
This paper is structured as follows: The main theory about the relevance of place- based regional strategies is depicted in the next session. Then, the discussion part detects the main characteristics of the Hungarian regions’ development; from two aspects of measurement: the trend variables of well-being indicators and urban pros- perity indicators are to be evaluated and explained. Among the material conditions, and the downside risks of the prevailing peripheral disadvantages are to be assessed.
Finally, there are the conclusions and the references.
Literature background for regional place-based development
According to Barca et al. (2012), the place-based approach has the aspect that geo- graphical context really matters, in terms of its social, cultural, and institutional char- acteristics. Besides, the place-based approach also focuses on the issue of knowledge in policy intervention. As described, the place-based approach assumes that the in- teractions between institutions and geography are critical for development, as these interactions foster development. In order to assess the likely impacts of a policy, the interactions between institutions and geography therefore require us to explicitly consider the specifics of the local and wider regional context (Gill, 2010).
The place-based approach concludes that development strategies should target mechanisms which build on local capabilities (both human and industrial ones) and promote innovative ideas through the interaction of local and general knowledge and of endogenous and exogenous actors in the design and delivery of public policies (Rodrik, 2005).
Noguera (2009) admits that public action conditions a range of processes and activities that continuously influence the intensity and direction of development;
among which, the study considered (a) the implementation and use of Information and Communication Technologies (ICT), (b) the development of innovation pro- cesses related to the proper functioning of business networks; (c) the nature and conditions of social capital, or the effectiveness of relations between local society; (d) the model of governance; and (e) the integration of tourism in development strategy.
It is important to note that place-based incentives only succeed when they are accom- panied by efforts to strengthen institutions and infrastructure.
Camagni and Cappello (2014, pp. 1-20) points out that the winning strategy in regional development is neither to focus on champion places and regions, in search of the highest efficiency, nor on lagging areas only, in search of equity. It is rather centred on the development potential of all places, represented by its territorial capital, material, human, cognitive, social and relational. Our paper is also track- ing these territorial issues, as well as their availability and efficiency potentials. As many literature suggests,2 policies should be tailored on each region’s specificities, competitive advantage and needs, engaging all possible assets and enlarging exist- ing excellences.
Regional development, measured by well-being indicators Measuring well-being is indispensable when place-based governmental policies are considered for development. Measures of well-being can help policy makers to en- hance the design and targeting of regional policies. They can also empower citizens to demand placed-based policy actions that respond to their specific expectations.
The OECD conceptual framework for measuring well-being is considering both on individuals and on place-based characteristics (OECD, 2016). It starts with the consid- eration that making better policies for better lives means understanding what matters to people. Its questions are: “What do people perceive and value about their local conditions? How do they behave when they are not satisfied with one aspect or more of their life? Do local inequalities in the accessibility of services matter in shaping citi- zens’ choices and do they have an impact on national well-being? How much does the place where we live predict our future well-being?”
Currently, regional measures are available for OECD countries in eleven related topics: income, jobs, housing, education, health, environment, safety, civic engage- ment and governance, access to services, community, and life satisfaction.3 These are comparable internationally and thus, provide tools for assessment of the development of regions in concern. Also, they serve as guidance for policy-makers on the use of well-being metrics for improving policy results (Gardiner et al., 2004). Strategic plan- ning and strategic management, as activities of innovative cities and local govern- ments play an important role in the well-being of citizens (Barati-Stec, 2015).
Sub-national data offer a more detailed picture of how life is lived, than national averages do (Eurostat, 2017). Although no country appears to have regions that enjoy simultaneously high or low levels of well-being in every dimension, evaluating the trends could contribute to proper policy responses (Garcilazo et al., 2010).
Table 1: OECD well-being topics
Dimensions Topics Indicators
Financial conditions
Income Disposable household income per capita (in real USD PPP)
Jobs Employment / unemployment rate (%) Housing Number of rooms per person (ratio)
Quality of life
Health Life expectancy at birth (years)
Age adjusted mortality rate (per 1 000 people) Education Share of labour force with at least secondary edu-
cation (%)
Environment Estimated average exposure to air pollution in PM2.5 (μg/m³), based on satellite imagery data Safety Homicide rate (per 100 000 people)
Civic
engagement Voter turnout (%) Accessibility
of services Share of households with broadband access (%)
Subjective well-being
Community Percentage of people who have friends or relatives to rely on in case of need
Life satisfaction Average self-evaluation of life satisfaction on a scale from 0 to 10
Source: OECD, 2016
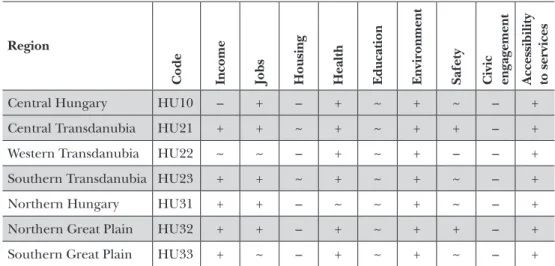
Table 2: Score trends by topic, as of regions in Hungary (2000-2014)
Region
Code Income Jobs Housing Health Education Environment Safety Civic engagement Accessibility to services
Central Hungary HU10 – + – + ~ + ~ – +
Central Transdanubia HU21 + + ~ + ~ + + – +
Western Transdanubia HU22 ~ ~ – + ~ + – – +
Southern Transdanubia HU23 + + ~ + ~ + ~ – +
Northern Hungary HU31 + + – ~ ~ + ~ – +
Northern Great Plain HU32 + + – + ~ + + – +
Southern Great Plain HU33 + ~ – + ~ + ~ – +
Note: + : the region has shown progress in this topic; ~ : the region has not changed greatly in this topic; – : the region has shown decline in this topic. For the topics of community and life satisfaction, due to missing data, change cannot be shown.
Source: OECD, 2016
The trends show improvement across most regions in Hungary in terms of in- come, jobs, health, environment and accessibility to services. Considering the ma- terial conditions (income, jobs and housing), there are more recent data available for housing. According to the Hungarian Spatial Development and Planning Data- base, TEIR, the number of newly built flats exceeded by far the one of demolished flats in each region, so therefore the housing indicator has improved in the previ- ous years.4
The high-performing Hungarian regions fare better than the OECD average in five of the well-being indicators (jobs by unemployment rate, share of households with broadband access, safety by homicide rate, education by labour force with a sec- ondary degree, and community by perceived social network). Regions in Europe with similar well-being indicators are Central Slovakia, East Slovakia and West Slovakia (in the Slovak Republic), Moravia-Silesia and Northwest (in the Check Republic), Ma- zowieckie, Slaskie and Swietokrzyskie (in Poland).
Besides the overall picture about the regions’ development, a more differentiated, nuanced approach can be achieved via considering the disparities among regions (Boldrin and Canova, 2001). In this regard, regional disparities in a country for each topic is computed comparing the ratio between top and bottom 20 per cent regional values of a country to the ratio of top and bottom 20 per cent regional values in the OECD area. In case of Hungary, the largest regional disparities are observed for ac- cess to services, jobs, education and safety (OECD, 2016). As the authors analysed in their previous study (Engelberth and Sági, 2016), especially the Northern Hungary is stressed by deteriorating demographical situation, high rate of unemployment, and the prevailing peripheral disadvantages.5
The development of the peripheral regions in Hungary, like Northern Hungary is hindered by the aging population, the re-settlement of the young habitants to the centre region, and, as a result, the spatial segregation of these regions. Counteracting to the further outflow of financial and human resources from the peripheral regions, and also retaining locally generated incomes within the region should be a target for place-based regional development strategies. Guiso et al. (2010, pp. 1-49) argue that civic capital is the missing ingredient in explaining the persistence of economic devel- opment. Although social and civic capital remain roughly constant over long periods of time, one of the potential sources of accumulation of civic capital is education.
Therefore, in regional development policies’ emphasis should be placed on educa- tion, training and on a shift in mentality.
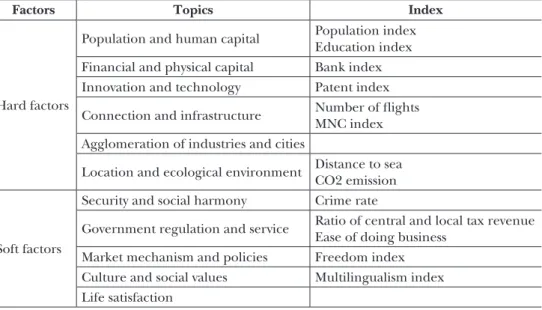
Regional development measured by urban prosperity A city’s ability to create value is manifest as the comprehensive long-term growth in the urban economy and the economic density, and depends on the conditions of a city’s elements and environment. Ni (2017, pp. 1-23) has built the Bowstring Model to analyse the driving factors of urban prosperity, as measured by hard and soft factors of prosperity.6
Table 3: Factors of urban prosperity in the Bowstring Model
Factors Topics Index
Hard factors
Population and human capital Population index Education index Financial and physical capital Bank index Innovation and technology Patent index Connection and infrastructure Number of flights
MNC index Agglomeration of industries and cities
Location and ecological environment Distance to sea CO2 emission
Soft factors
Security and social harmony Crime rate
Government regulation and service Ratio of central and local tax revenue Ease of doing business
Market mechanism and policies Freedom index Culture and social values Multilingualism index Life satisfaction
Source: Ni, 2017, pp. 1-23
Budapest was ranked 120th and 132nd in 2010 and 2011, respectively, in the Glob- al Urban Competitiveness Report (Ni, 2011, p. 4). In these years the capital was classi- fied as cluster IV city, showing small GDP per capita and population (Ni, 2011, p. 118).
Since then, Budapest had not been mentioned among the top 200 cities around the world. However, its role has gained importance as a result of its connection to the Silk Road Initiative; within Central Europe7 it has recently been ranked as of the 40th top Silk Road city in aggregate connections (Ni et al., 2017a, p. 139). The level of connec- tion between Budapest and other Silk Road cities could be highly beneficial for the economic development of the city and its region (Central Hungary), for allocating resources as a result of the connections.
Further on we should note that an affirmative relationship exists between con- nections and the income level of a city. Ni et al. (2017a, p. 141) found a positive cor- relation between the income of Silk Road cities (measured by both GDP per capita and GNI per capita) and their performance in the global connection index. Higher income level is a driving factor, but also the result (the positive outcome) of connec- tions. Knowing the magnitude of the investments to physical infrastructure alongside the Silk Road, and the capital expenditures to logistic centres financed from the Ini- tiative, Budapest will be able to benefit in terms of income growth.
With regards to Silk Road cities, there is also a positive correlation between global connections and GDP per land area, whereas the later measures the total amount of wealth accumulated per unit of land area in a city (Ni et al., 2017b, p. 153): cities with higher GDP per land area correspond to higher levels of connection. Taking into con- sideration the improvements in housing in the previous years (as mentioned in the
previous chapter), Budapest has good potentials in strengthening connections and development, and may display its advantages in attracting global production factors.
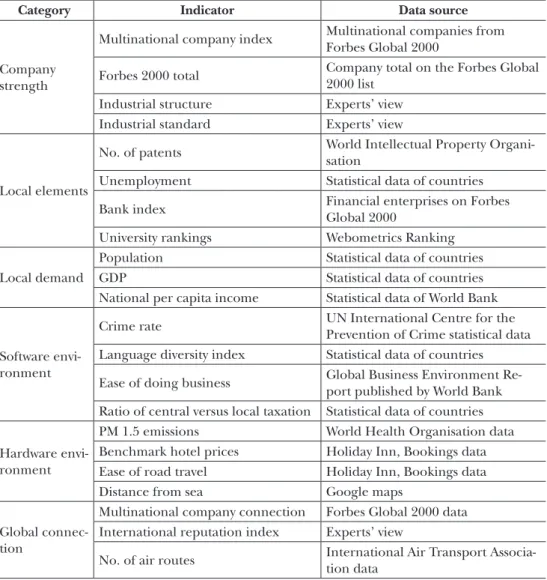
Table 4: Global urban competitiveness indicator system
Category Indicator Data source
Company strength
Multinational company index Multinational companies from Forbes Global 2000
Forbes 2000 total Company total on the Forbes Global 2000 list
Industrial structure Experts’ view Industrial standard Experts’ view
Local elements
No. of patents World Intellectual Property Organi- sation
Unemployment Statistical data of countries
Bank index Financial enterprises on Forbes
Global 2000
University rankings Webometrics Ranking
Local demand
Population Statistical data of countries
GDP Statistical data of countries
National per capita income Statistical data of World Bank
Software envi- ronment
Crime rate UN International Centre for the
Prevention of Crime statistical data Language diversity index Statistical data of countries Ease of doing business Global Business Environment Re-
port published by World Bank Ratio of central versus local taxation Statistical data of countries
Hardware envi- ronment
PM 1.5 emissions World Health Organisation data Benchmark hotel prices Holiday Inn, Bookings data Ease of road travel Holiday Inn, Bookings data
Distance from sea Google maps
Global connec- tion
Multinational company connection Forbes Global 2000 data International reputation index Experts’ view
No. of air routes International Air Transport Associa- tion data
Source: Ni et al., 2017a, p. 21
The above indicator system concentrates on the overall merits (quality) of a city, expressed in the enterprise quality. Budapest is ranked 20th in the company strength category,8 which is rationalised by the fact that several multinational companies have their seats of operation (i.e. shared service centres) in the city. The authors believe that along with the further development of the global value chains, a city like Buda- pest, connecting the Silk Road, has great prospects in advancing its economic devel-
opment and its position in the global ranking. In this respect, identical place-based governmental strategies (i.e. corporate tax initiatives, enhanced focus on innovative- ness, and institutional reforms) are recommended (Lentner, 2015). Anttiroiko (2014, p. 36) points out that business promotion activities stand at the core of urban attrac- tion strategy, with incentives offered to businesses. Better business environment per se is not sufficiently enough for a city to catch up with high-income cities, since global connections necessitate favourable settings for innovation and the dissemination of innovation (Anholt, 2005).9
When only capitals are taken into account, in 2017 Budapest was ranked as the 24th global capital city (Ni et al., 2017b, p. 61). In general, the urban competitiveness of capital cities in Europe pushes them higher in rankings (see for example London, Paris, Dublin, Vienna, Stockholm, Copenhagen, and Budapest). In this regard, politi- cal connections also bring comparative advantage (Eurostat, 2014).
Budapest is among the most prominent arena for international meetings: accord- ing to the International Congress and Convention Association, in 2016, the city was ranked for the 16th by the number of meetings organised within the year (ICCA, 2017, p. 20).10 Besides business networking, branding is a promising means to over- come the structural (size-) limits of a city like the Hungarian capital. The city has encouraging opportunities to create a brand, to manage the branding process and to offer brand value to international audiences and businesses to benefit from branding, as well as gaining media attention (Anttiroiko, 2014, p. 33).
Conclusions
Regional development policies must reasonably be place-based depending on the is- sues and aspirations of the particular regions struggling with constraints of the de- mographic, housing and employment trends. Also, while reflecting specific regional needs and traits, the development strategies must encounter the common aspects of well-being.
Measures of regional development include material conditions, factors effecting the quality of life, and subjective elements of well-being. Despite the regional dispari- ties and the centrum-periphery gaps, Hungarian regions improved in many aspects throughout the past couple of years and their well-being is perceived as similar to a few other Central European regions.
Urban prosperity and competitiveness is measured by hard and soft factors as well. In this regard, the Hungarian capital has good potentials in strengthening con- nections and development. In essence, the principles of human- and physical factor- derived strategies are the key in framing regional development. They should place emphasis on innovation and business connections, and should be coupled with the particular values of the regions.
Notes
1 This study was made with support from the Research Fund of the Budapest Business School, University of Applied Sciences.
2 See, for example, Foddi et al., 2013. Also the different paths of development are emphasised by Cor- tright, 2002, pp. 2-16.
3 The above OECD indicators of the perceived development of regions and sub-regions are measured by a questionnaire of 11 socio-economic issues of the regions in concern. Here follows the questions of the questionnaire (in relation to well-being, without those questions which serve the statistical clustering): 1) Is your household’s income lower/ around/ above the Hungarian minimum wage?
Does your household receive governmental subsidy regularly? Do you think that the disposable in- come of your household belongs to the low/ average/ high levels in your place of living? Did the dis- posable income of your household decrease/ stay the same/ increase throughout the past five years?
2) How many of your active family members are employed? How many of them are unemployed? 3) How many rooms (above 12 square metres) are there in your house? Is your family (or a member of your family) the owner of the house? 4) Do you perceive that the health services in your home town or village are below/ at/ above the levels in your place of living? 5) How many of your family members have passed at least secondary education? 6) Do you perceive that the air pollution in your home town or village is below/ at/ above the levels in your place of living? 7) Do you perceive that the safety of your home town or village is below/ at/ above the levels in your place of living? 8) How many of your family members voted during the last national election? 9) Do you have broadband internet connection in your house? 10) If you were in trouble, do you have relatives or friends you can count on to help you whenever you need them, or not? (OECD well-being question) 11) Please imagine a ladder, with steps numbered from 0 at the bottom to 10 at the top. The top of the ladder represents the best possible life for you and the bottom of the ladder represents the worst possible life for you. On which step of the ladder would you say you personally feel you stand at this time?
(OECD well-being question)
4 Housing data are available at the website https://www.teir.hu/idosoros-elemzo/.
5 The centrum-periphery dilemma is not unknown in the Hungarian history. It has been prevailing throughout the past decades, freezing the socio-economic structures even after the millennium. See also Lőcsei, 2012, pp. 31-43; Engelberth, 2016, pp. 31-51.
6 Tests from the indices showed that a city’s economic development strongly results from improved mar- ket mechanism and higher degree of economic freedom; meanwhile improved education and increased accumulation of human capital in a city also presented high positive effect on urban growth. Better busi- ness environment has invaluable effect on a city’s ability to attract investment. In addition, technological innovation represented by patent licensing and diverse culture represented by multilingualism are both essential to a city’s economic development.
7 In Central Europe 10 cities obtained ranking: Frankfurt (11), Warsaw (17), Vienna (18), Zurich (19), Munich (25), Prague (26), Hamburg (30), Dusseldorf (32), Budapest (40) and Berlin (41).
8 It has been ranked back according to the local demand and to the hardware environment (278th and 305th, respectively), which is reasonable, considering the distribution of the world GDP. See Ni el al., 2017a, p. 293.
9 Besides their direct effects, knowledge and innovation, which can be significantly enhanced by positive spillover effects among private firms and other players in the local economy, provide opportunities for a broader scope of governmental interventions (Zhang, 2014, p. 1). See also Lever, 2014, pp. 8-16; Molnár and Hegedűs, 2017, pp. 185-186.
10 There have been 108 meetings held in Budapest in 2016, the most of the country.
References
Anholt, Simon (2005): The Anholt-GMI City Brand Index: How the World Sees the World`S Cities. Place Branding, Vol. 2, No. 1, pp. 18-31, https://doi.org/10.1057/palgrave.pb.5990042.
Anttiroiko, Ari-Veikko (2014): The Political Economy of City Branding. Routledge Advances in Regional Eco- nomics, Science and Policy, No. 2, Routledge, pp. 1-216.
Barati-Stec, Izabella (2015): Strategic Planning in Hungarian Municipalities. Transylvanian Review of Admin- istrative Sciences, Special Issue, pp. 5-14, http://rtsa.ro/tras/index.php/tras/article/view/461.
Barca, Fabrizio; McCann, Philip and Rodriguez-Pose, Andrés (2012): The Case for Regional Development Intervention: Place-Based Versus Place-Neutral Approaches. Journal of Regional Science, Vol. 52, No. 1, pp. 134-152, https://doi.org/10.1111/j.1467-9787.2011.00756.x.
Boldrin, Michele and Canova, Fabio (2001): Inequality and Convergence in Europe’s Regions: Recon- sidering European Regional Policies. Economic Policy, Vol. 16, No. 32, pp. 207-253, https://doi.org/
10.1111/1468-0327.00074.
Camagni, Roberto and Capello, Roberta (2014): Rationale and Design of EU Cohesion Policies in a Period of Crisis with Special Reference to CEECs. GRINCOH Working Paper Series, No. 1, www.grincoh.eu/me- dia/policy/grincoh_wp_policy_1_camagni_capello.pdf.
Cortright, Joseph (2002): The Economic Importance of Being Different: Regional Variations in Tastes, Increasing Returns, and the Dynamics of Development. Economic Development Quarterly, Vol. 16, No. 1, pp. 2-16, https://doi.org/10.1177/0891242402016001001.
Engelberth István (2016): Gazdasági és társadalmi útkeresés Észak-Nógrádban: a Szécsényi kistérség. [Eco- nomic and social pathfinding in Northern Nógrád county, with special focus to Szécsény micro-region].
In: Vágány, Judit and Fenyvesi, Éva (eds.): Multidiszciplináris kihívások, sokszínű válaszok. BGE KVIK Köz- gazdasági Intézeti Tanszéki Osztály, Budapest, pp. 31-51.
Engelberth, István and Sági, Judit (2016): Catching Up or Lagging Behind? The Case of a Hungarian Sub- Region at the Slovakian Border: The Szécsény Sub-Region. In: Mura, Ladislav et al. (eds.): Sustainability of Rural Areas in Practice: Conference Proceedings from International Scientific Conference. Slovak University of Agriculture in Nitra, pp. 156-164.
Eurostat (2014): GDP per capita in the EU in 2011: seven capital regions among the ten most prosperous. Eurostat Release, No. 29/2014, http://ec.europa.eu/eurostat/documents/2995521/5173650/1-27022014-AP- EN.PDF/a46ded44-83cf-4368-9315-27f96bcc3a0e (accessed 27 February 2017).
Eurostat (2017): Eurostat Regional Yearbook. Regions and Cities Regions and Cities Illustrated, p. 16, https://
doi.org/10.2785/568258.
Foddi, Marta; Marrocu, Emanuela; Paci, Raffaelle and Usai, Stefano (2013): Knowledge, Human Capital and Regional Performance. In: Capello, Roberta and Lenzi, Camilla (eds): Territorial Patterns of Innova- tion: An Inquiry on the Knowledge Economy in European Regions. Routledge, London, pp. 183-209.
Garcilazo, Jose Enrique; Oliveira Martins, Joaquim and Tompson, William (2010): Why Policies May Need to be Place-Based in Order to be People-Centred. VoxEU.org, 20 November, www.voxeu.org/.
Gardiner, Ben; Martin, Ron and Tyler, Peter (2004): Competitiveness, Productivity and Economic Growth Across the European Regions. Regional Studies, Vol. 38, No. 9, pp. 1045-1067, https://doi.org/10.1080 /0034340042000292638.
Gill, Indermit (2010): Regional Development Policies: Place-Based or People-Centred? OECD Regional Devel- opment Policy Division, Paris, http://voxeu.org/article/regional-development-policies-place-based-or- people-centred.
Guiso, Luigi; Sapienza, Paola and Zingales, Luigi (2010): Civic Capital as the Missing Link. NBER Working Paper Series, No. 15845, pp. 1-82, https://doi.org/10.3386/w15845.
Henderson, J. Vernon (2010): Cities and Development. Journal of Regional Science, Vol. 50, No. 1, pp. 515- 540, https://doi.org/10.1111/j.1467-9787.2009.00636.x.
ICCA (2017): ICCA Statistics Report Country & City Ranking 2016. International Congress and Convention Association, www.iccaworld.org/dcps/doc.cfm?docid=2082.
Lentner, Csaba (2015): The New Hungarian Public Finance System – in a Historical, Institutional and Scientific Context. Public Finance Quarterly, Vol. 60, No. 4, pp. 447-461, www.asz.hu/storage/files/files/
public-finance-quarterly-articles/2015/a_lentner_2015_4.pdf
Lever, William F. (2014): Innovation in Urban Policy; Collaboration Rather Than Competition Between Cities.
Global Urban Competitiveness Research Center for City and Competitiveness, www.gucp.org/SITES/
Uploaded/File/2014/3/Innovation%20in%20urban%20policy.pdf.
Lőcsei, Hajnalka (2012): A konjunktúramutatók területi egyenlőtlenségei az ezredforduló után Magyaror- szágon [Territorial disparities in business cycle indicators in Hungary after the turn of the millennium].
In: Nemes-Nagy, József (ed.): Térfolyamatok, térkategóriák, térelemzés [Spatial processes, spatial categories and space analysis]. Regionális Tudományi Tanulmányok, No. 16, ELTE Regionális Tudományi Tanszék, Budapest, pp. 31-43.
Molnár, Petronella and Hegedűs, Szilárd (2017): Analysis of the Bankruptcy Risk of Companies Owned by Local Governments in Hungary. In: Vágány, Judit et al. (eds.): Multidiszciplináris kihívások, sokszínű válaszok [Multidisciplinary challenges and varied responses]. 9. Scientific Symposium, Budapesti Gaz- dasági Egyetem, Budapest, pp. 185-186.
Ni, Pengfei (2011): The Global Urban Competitiveness Report 2011. Erward Elgar, Cheltenham, https://doi.
org/10.4337/9781781008928.
Ni, Pengfei (2017): Driving Factors of Urban Prosperity: An Empirical Analysis of Cities Worldwide. Global Ur- ban Competitiveness Research Center for City and Competitiveness, www.gucp.org/Sites/Uploaded/
File/2017/11/Driving%20Factors%20of%20Urban%20Prosperit(1).pdf.
Ni, Pengfei; Kamiya, Marco and Ding, Ruxi (2017a): Cities Network Along the Silk Road: The Global Urban Com- petitiveness Report 2017. Springer, Singapore, https://doi.org/10.1007/978-981-10-4834-0.
Ni, Pengfei; Kamiya, Marco and Haibo, Wang (2017b): House Prices, Changing the City World. The Global Urban Competitiveness Report 2017-2018 (Short version). Chinese Academy of Social Sciences, https://un- habitat.org/wp-content/uploads/2017/11/GUCR2017-2018-Short-Version.pdf.
Noguera, Joan (2009): An Analysis on the Subjective Perception of Policy Action on Peripherality: A Com- parative Assessment in Accessible and Peripheral Areas of Six Countries of the EU. Regional Science Policy
& Practice, Vol. 1, No. 2, pp. 159-176, https://doi.org/10.1111/j.1757-7802.2009.01011.x.
OECD (2016): Regional Well-Being Database. www.oecdregionalwellbeing.org.
Pike, Andy; Rodríguez-Pose, Andres and Tomaney, John (2007): What Kind of Local and Region- al Development and for Whom? Regional Studies, Vol. 41, No. 9, pp. 1253-1269, https://doi.
org/10.1080/00343400701543355.
Rodrik, Dani (2005): Growth Strategies. In: Aghion, Philippe and N. Durlauf, Steven (eds.): Handbook of Economic Growth. Vol. 1A, Elsevier, North Holland, Amsterdam, pp. 967-1014, https://doi.org/10.1016/
s1574-0684(05)01014-2.
Storper, Michael (2011): Why Do Regions Develop and Change? The Challenge for Geography and Eco- nomics. Journal of Economic Geography, Vol. 11, No. 2, pp. 333-346, https://doi.org/10.1093/jeg/lbq033.
Zhang, Ming (2014): What Can Cities Do to Enhance Competitiveness? Local Policies and Actions for Innovation.
Urban Competitiveness and Innovation, https://doi.org/10.4337/9781781007921.00014.