Fatigue properties of EP/A356 aluminium matrix syntactic foams with different densities
A Szlancsik1, B Katona1, I N Orbulov1,2, M Taherishargh3, T Fiedler3
1Department of Materials Science and Engineering, Budapest University of Technology and Economics, Budapest, Hungary
2MTA–BME Lendület Composite Metal Foams Research Group, Budapest, Hungary
3The University of Newcastle, School of Engineering, University Drive, Callaghan, Australia
E-mail: szlancsik@eik.bme.hu
Abstract. The fatigue properties of EP/A356 aluminium matrix syntactic foams were measured.
Four different type of syntactic foam were produced in order to determine the relation between the density and the fatigue properties. The density range was set to be between 0.7 – 1.1 g/cm3. The measured values indicated that, both the fatigue limit and the slope of the Wöhler curve increased with the density. However, the comparison of Globocer filled aluminium matrix syntactic foams with EP filled aluminium matrix syntactic foams suggested that this trend only applicable to foams with identical filler materials.
1. Introduction
Metal matrix syntactic foams (MMSFs) are materials with porous structure. This makes them a light weight material which is really important nowadays. Taking advantage of this property machine parts can be lighter what makes them more energy efficient, which is one of the main goals of the modern designers [1].
Based on the structure of this material it is mostly used as energy absorber. The compressive behaviour has been widely investigated in the literature [2-10]. It is well known that the compressive strength and the energy absorption of metal matrix syntactic foams (MMFs) are good. The wear and the thermal properties of these materials are also been studied [11-16].
Regarding the compressive properties of MMSFs only a few research contributions can be found in the databases. An interesting work on composite metallic foams (CMFs) that contain steel hollow spheres in aluminium alloy matrix (produced and manufactured by simple gravity casting) or in steel matrix (produced by a simple powder metallurgy method) was published by the research group of Vendra et al. Under repeated compression load, the CMFs proved high cyclic stability and the deformation of the CMF samples could be separated into three stages: (i) linear increment in strain with fatigue cycles, (ii) minimal deformation accumulation through relatively large number of cycles and (iii) fast deformation accumulation during a few cycles up to complete fracture. The deformation of the MMSFs occurred to be more uniform compared to regular metal foams, which deform by forming collapse bands at weaker sections [17].
On the other hand, Katona et al. [18] published on MMSFs, consisting of two grades of aluminium alloys (Al99.5 and AlSi12) and a set of specific oxide ceramic hollow spheres. The MMSFs were studied in the viewpoint of repeated loading. The final results of the repeated compressive load with the load asymmetry factor of R=0.1 provided full reliability design data for the studied materials in the whole lifetime part of the Wöhler curve, besides the fatigue limits were determined by the so called staircase method. Based on the experiments the Wöhler curves of the foams were plotted, considering the median curves, their given confidence statistical boundaries and the fatigue limit. Considering the matrix materials, the softer matrix proved higher load levels for the fatigue limit than the more rigid AlSi12 matrix. Regarding the average diameter of the filler ceramic hollow spheres, larger spheres proved to be better than the quite easily vulnerable smaller ones. Considering the failure modes, only one common fracture mode was separated for the studied foams: the samples were crashed along a single shear band, similar to the quasi-static case.
Other publications are available on the fatigue of ‘conventional’ metallic foams [19-21], from which a few generalities can be summarized: most of the investigations apply R=0.1 stress asymmetry factor, with pure compression load, however the test frequencies can differ significantly, however, its effect on the fatigue properties was not considered.
2. Materials and methods 2.1. Materials
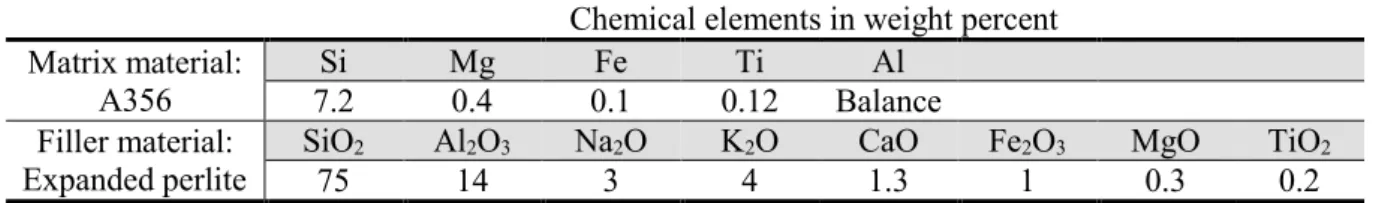
A356 alloy was applied as matrix material, its chemical composition is listed in Table 1. As filler, expanded perlite was applied which was obtained from Australian Perlite Pty. and they had a size range of 3 – 4 mm. The chemical composition of the filler is also listed in Table 1.
Table 1. The chemical composition of A356 aluminium alloy and the expanded perlite in weight percent Chemical elements in weight percent
Matrix material:
A356
Si Mg Fe Ti Al
7.2 0.4 0.1 0.12 Balance
Filler material:
Expanded perlite
SiO2 Al2O3 Na2O K2O CaO Fe2O3 MgO TiO2
75 14 3 4 1.3 1 0.3 0.2
The counter gravity infiltration process which was used to produce the EP/A356 syntactic foam is described in details in Taherishargh et al [22]. However, a modification was used: namely the compaction procedure, which is used to tailor the density values of the produced syntactic foams. This procedure is detailed in Broxtermann et al [23]. Four different density range were created using compaction masses. 5, 10 and 15 kg compaction masses were used, and also a reference type also created without compaction mass. The sample names refer to the producing process, samples with “1st batch”
means that these samples were created with 15 kg compaction mass, samples with “2nd batch”
designation refers to the 10 kg compaction mass, while “3rd batch” means 5 kg compaction mass, and finally “4th batch” refers to those samples which were created without compaction mass.
2.2. Fatigue test procedure
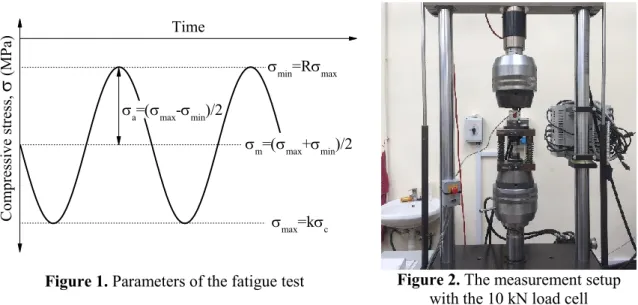
The produced syntactic foams were firstly investigated under quasi-static compression tests. These results are also detailed in Boxtermann et al [23]. This was necessary because the 1% compression strength is the base for the calculations of the load levels for the fatigue tests. Figure 1. depicts the scheme of the fatigue cycle with the most important test parameters.
a=(max-min)/2
Compressive stress, (MPa)
Time
min=Rmax
m=(max+min)/2
max=kc
Figure 1. Parameters of the fatigue test Figure 2. The measurement setup with the 10 kN load cell
The maximal stress was calculated from the 1% compressive stress (σc) – determined from the quasi- static tests –, by multiplying it with k, that is the load ratio which was varied between 70 – 100%. R is the asymmetry factor which was always set to R = 0.1. The frequency of the test was f = 10 Hz and the fatigue limit was taken as 2·106 cycle. The failure criterion was 2% engineering deformation according to the literature [24, 25]. The samples’ diameter was D = 27 mm, and the height was H = 42 mm (the aspect ratio was H/D = 1.56). The fatigue tests were performed on a MTS 810 hydraulic testing machine, with a 10 kN load cell if the maximal load was under 8 kN. Otherwise a 250 kN load cell was used. The displacement was measured with the crosshead displacement due to the relatively large sample dimensions. Figure 2. shows the measurement setup.
3. Results and discussion
First, we had to determine the maximum stress for the fatigue tests. In order to get this data for every density a plot had to be created. Figure 3. depicts the density – compressive stress diagram, where the stress values are equal to the 1% compressive stress from the quasi-static measurement.
0,70 0,75 0,80 0,85 0,90 0,95 1,00 1,05 1,10 0
5 10 15 20 25 30 35
1st batch 2nd batch 3rd batch 4th batch Fitted line
1% compressive stress, c (MPa)
Density, (g/cm3)
Figure 3. 1% compressive stress in function of the density
The 1% compressive strength showed linear relationship to the density, the fitted line’s equation is
𝜌 = −48.28 + 72.86𝜎𝑐 (1)
With this equation the maximum stress was calculated individually, considering the load ratio too.
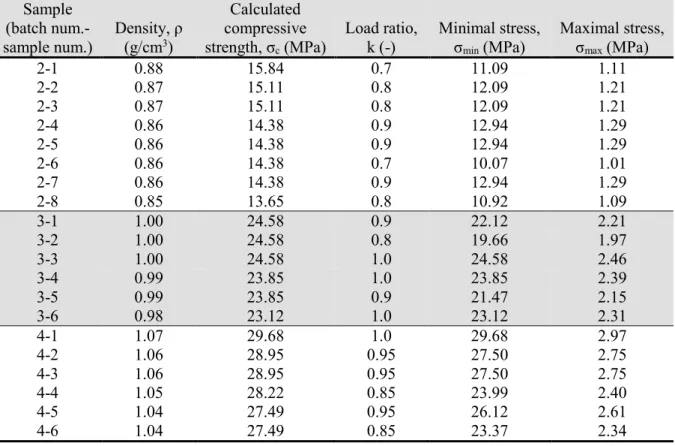
From the maximal stress and R value, all of the other cyclic load parameters can be easily derived. Table 2. summarizes the properties of the specimens and the calculated parameters for the fatigue test.
Total duration of the measurements was ~ 700 h. Two types of failure mechanism were detected.
These failure modes are similar to what Taherishargh et al. [26] found in their research. Type I failure mode means that a shear band appears across the cylindrical specimen with an angle of ~45° and the specimens usually completely fell apart along this shear band. Type II has a different method. The first part is similar to type I, namely a 45° shear band appears, but after a relatively small deformation the failure slows down because of the hardening of the material. This deceleration of the failure creates a plateau in the engineering deformation – number of cycles diagram. After this plateau a new shear band appears, which is perpendicular to the previous one. After the second shear band appears the samples completely fall apart. Figure 4. shows the mechanism of the failure types [26]. Type I typically occurred at those samples which survived at least 10.000 cycles, while type II occurred at lower lifetime. Type I only has one peak at the deformation speed diagram, while type II has a plateau zone after the first peak.
The Wöhler curves were plotted in a load ratio – failure cycle number graph (Figure 5.).
Figure 4. The cross-section of samples showing the deformation mechanism at low and high loading ratios (type I and type II) [26]
Table 2. Sample properties and the individual parameters for the fatigue test Sample
(batch num.- sample num.)
Density, ρ (g/cm3)
Calculated compressive strength, σc (MPa)
Load ratio, k (-)
Minimal stress, σmin (MPa)
Maximal stress, σmax (MPa)
1-1 0.78 8.55 0.9 7.70 0.77
1-2 0.75 6.36 0.8 5.09 0.51
1-3 0.74 5.64 0.8 4.51 0.45
1-4 0.73 4.91 0.9 4.42 0.44
1-5 0.73 4.91 0.7 3.44 0.34
1-6 0.71 3.45 0.9 3.11 0.31
1-7 0.69 1.99 0.8 1.59 0.16
Table 2. Sample properties and the individual parameters for the fatigue test (continued) Sample
(batch num.- sample num.)
Density, ρ (g/cm3)
Calculated compressive strength, σc (MPa)
Load ratio, k (-)
Minimal stress, σmin (MPa)
Maximal stress, σmax (MPa)
2-1 0.88 15.84 0.7 11.09 1.11
2-2 0.87 15.11 0.8 12.09 1.21
2-3 0.87 15.11 0.8 12.09 1.21
2-4 0.86 14.38 0.9 12.94 1.29
2-5 0.86 14.38 0.9 12.94 1.29
2-6 0.86 14.38 0.7 10.07 1.01
2-7 0.86 14.38 0.9 12.94 1.29
2-8 0.85 13.65 0.8 10.92 1.09
3-1 1.00 24.58 0.9 22.12 2.21
3-2 1.00 24.58 0.8 19.66 1.97
3-3 1.00 24.58 1.0 24.58 2.46
3-4 0.99 23.85 1.0 23.85 2.39
3-5 0.99 23.85 0.9 21.47 2.15
3-6 0.98 23.12 1.0 23.12 2.31
4-1 1.07 29.68 1.0 29.68 2.97
4-2 1.06 28.95 0.95 27.50 2.75
4-3 1.06 28.95 0.95 27.50 2.75
4-4 1.05 28.22 0.85 23.99 2.40
4-5 1.04 27.49 0.95 26.12 2.61
4-6 1.04 27.49 0.85 23.37 2.34
1 10 100 1000 10000 100000 1000000 70
80 90 100
1st batch 2nd batch 3rd batch 4th batch Fitted line Fitted line Fitted line Fitted line
Load ratio, k (%)
Failure cycle number, Nf (-)
Figure 5. Load ratio – failure cycle number diagram
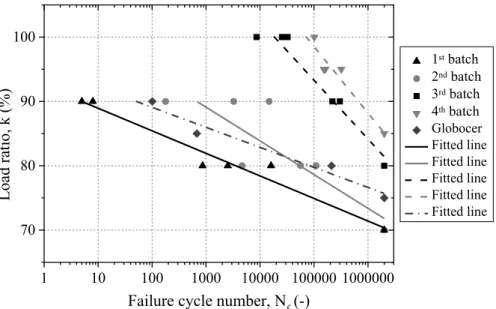
It can be seen that the slope of the Wöhler curves are increasing with the density, and the fatigue limit also increasing with the density. The Wöhler curves were compared to another type of syntactic foams, namely AlSi12 matrix filled with Globocer balloons [18]. The results of the two fatigue tests can be compared and proves that Wöhler curves dependency on the density only works with the same type of syntactic foam, because this type of syntactic foam has a density of 1.8 g/cm3 (Figure 6.) and does
not fit into the trends of the EP filled composites. This phenomenon indicates that the filler has significant effect on the fatigue properties of the MMSFs.
1 10 100 1000 10000 100000 1000000 70
80 90 100
Load ratio, k (%)
Failure cycle number, Nf (-)
1st batch 2nd batch 3rd batch 4th batch Globocer Fitted line Fitted line Fitted line Fitted line Fitted line
Figure 6. Load ratio – failure cycle number diagram supplemented with an AlSi12-Globocer syntactic foam’s results
A large difference between the two type of syntactic foam is in the filler material, and in the shape of the quasi-static compressive curve [27-29]. The Globocer filled syntactic foams have a defined peak stress, which means if these type of materials go through that stage, it will collapse, but in the other hand, the EP filled syntactic foams do not have such a peak in their quasi-static curves, which means that if they exceed the 1% compression stress point they will only be stronger. This can cause, that the dependency from the density not apply for the Globocer filled syntactic foams.
4. Conclusions
From the investigation which was described above, the following conclusions can be drawn:
The compaction method is a proper way to produce different density range syntactic foams from expanded perlite and A356 aluminium alloy.
The slope of the Wöhler curves depends on the density of the syntactic foam.
The fatigue limit depends on the density of the syntactic foams.
The slope of the Wöhler curves and the fatigue limit dependency from the density only applies for the syntactic foams made from the same filler material.
Acknowledgment
This paper was supported by the János Bolyai Research Scholarship of the Hungarian Academy of Sciences and by the ÚNKP-17-3-I New National Excellence Program of the Ministry of Human Capacities.
References
[1] Gupta N and Rohatgi P K 2014 Metal Matrix Syntactic Foams DEStech Publications, Inc., Lancaster, Pennsylvania, USA
[2] Mondal D P, Goel M D and Das S 2009 Compressive deformation and energy absorption characteristics of closed cell aluminum-fly ash particle composite foam Mat. Sci. Eng. A 507 pp 102–109
[3] Katona B and Orbulov I N 2017 Structural Damages in Syntactic Metal Foams Caused by Monotone or Cyclic Compression Periodica Polytechnica Mechanical Engineering 61(2) pp 146–152
[4] Mondal D P, Jha N, Badkul A, Das S and Khedle R 2012 High temperature compressive deformation behaviour of aluminum syntactic foam Mater. Sci. Eng. A 534 pp 521–529 [5] Zhang L P and Zhao Y Y 2007 Mechanical Response of Al Matrix Syntactic Foams Produced by
Pressure Journal of Composite Materials 41 (17) pp 2105–2117
[6] Taherishargh M et al 2014 On themechanical properties of heat-treated expanded perlite–
aluminium syntactic foam Mater Des. 63 pp 375–383
[7] Luong D D, Shunmugasamy V C, Gupta N, Lehmhus D, Weise J and Baumeister J 2015 Quasi- static and high strain rates compressive response of iron and Invar matrix syntactic foams Mater. Des. 66 pp 516–531
[8] Peroni L, Scapin M, Avalle M, Weise J, Lehmhus D, Baumeister J and Busse M 2012 Syntactic iron foams – on deformation mechanisms and strain-rate dependence of compressive properties Adv. Eng. Mater. 14 pp 909–918
[9] Zou L C, Zhang Q, Pang B J, Wu G H, Jiang L T and Su H 2013 Dynamic compressive behavior of aluminum matrix syntactic foam and its multilayer structure Mater. Des. 45 pp 555–560 [10] Goel M D, Mondal D P, Yadav M S and Gupta S K 2014 Effect of strain rate and relative density
on compressive deformation behavior of aluminum cenosphere syntactic foam Mater. Sci.
Eng. A 590 pp 406–415
[11] Mondal D P, Jha N, Badkul A, Das S and Khedle R 2012 High temperature compressive deformation behaviour of aluminum syntactic foam Mater. Sci. Eng. A 534 pp 521–529 [12] Májlinger K, Bozóki B, Kalácska G, Keresztes R and Zsidai L 2016 Tribological properties of
hybrid aluminum matrix syntactic foams Tribology International 99 pp 211–223
[13] Májlinger K 2015 Wear properties of hybrid AlSi12 matrix syntactic foams Int. Jour. of Mat. Res.
106 (11) pp 1165–1173
[14] Szalóki I and Viharos Zs J 2018 Surface Structure Analysis of Syntactic Metal Foams Machined by Milling Periodica Polytechnica Mechanical Engineering 62 (1) pp 26–32
[15] Fiedler T, Belova I V and Murch G E 2015 On the thermal properties of expanded perlite – Metallic syntactic foam International Journal of Heat and Mass Transfer 90 pp 1009–1014 [16] Bidar B, Shahraki F and Kalhori D M 2016 3D Numerical Modelling of Convective Heat Transfer
through Two-sided Vertical Channel Symmetrically Filled with Metal Foams Periodica Polytechnica Mechanical Engineering 60 (4) pp 193–202
[17] Vendra L, Neville B and Rabiei A 2009 Fatigue in aluminum–steel and steel–steel composite foams Mater. Sci. Eng. A 517 pp 146–153
[18] Katona B, Szebényi G and Orbulov I N 2017 Fatigue properties of ceramic hollow sphere filled aluminium matrix syntactic foams Materials Science & Engineering A 679 pp 350–357 [19] Kafka O L, Ingraham M D, Morrison D J et al 2014 Characterization of fatigue fractures in closed-
cell aluminum foam using X-ray micro-computed tomography J Mater Eng Perform 23 pp 759–765
[20] Zhou J and Soboyejo W O 2004 Compression-compression fatigue of open cell aluminum foams:
macro-/micromechanisms and the effects of heat treatment Mater Sci Eng A 369 pp 23–35 [21] Vendra L, Neville B and Rabiei A 2009 Fatigue in aluminumsteel and steel-steel composite foams
Mater Sci Eng A 517 pp 146–153
[22] Taherishargh M B, Murch G E and Fiedler T 2014 Low-density expanded perlite–aluminium syntactic foam Mater Sci Eng A 604 pp 127–134
[23] Broxtermann S, Taherishargh M, Belova I V, Murch G E and Fiedler T 2017 On the compressive behaviour of high porosity expanded Perlite-Metal Syntactic Foam (P-MSF) Journal of Alloys and Compounds 691 pp 690-697
[24] Sugimura Y, Rabiei A, Evans A G et al 1999 Compression fatigue of a cellular Al alloy Mater Sci Eng A 269 pp 38–48
[25] Harte A M, Fleck N A and Ashby M F 1999 Fatigue failure of an open cell and a closed cell aluminum alloy foam. Acta Mater 47 pp 2511–2524
[26] Taherishargh M, Katona B, Fiedler T and Orbulov I N 2017 Fatigue properties of expanded perlite/aluminum syntactic foams Journal of Composite Materials 51 (6) pp 773–781
[27] Taherishargh M, Sulong M A, Belova I V, Murch G E and Fiedler T 2015 On the particle size effect in expanded perlite aluminium syntactic foam Materials and Design 66 pp 294–303 [28] Orbulov I N 2012 Compressive properties of aluminium matrix syntactic foams Materials Science
and Engineering: A 555 pp 52–56
[29] Májlinger K and Orbulov I N 2014 Characteristic compressive properties of hybrid metal matrix syntactic foams Materials Science and Engineering: A 606 pp 248–256
Dear Editors,
Thank you for the positive review, the noted missing punctuations have been corrected and the highlighted paragraph has been justified as suggested by the Reviewer.
The corrected manuscript has been uploaded to the Journal’s system.
Best regards, Attila Szlancsik Corresponding Author
![Figure 4. The cross-section of samples showing the deformation mechanism at low and high loading ratios (type I and type II) [26]](https://thumb-eu.123doks.com/thumbv2/9dokorg/1426475.121074/4.892.117.783.553.812/figure-section-samples-showing-deformation-mechanism-loading-ratios.webp)