in terms of immune microenvironment and checkpoint molecule distribution
David Dora1 , Christopher Rivard2, Hui Yu2, Paul Bunn2, Kenichi Suda3, Shengxiang Ren4, Shivaun Lueke Pickard2, Viktoria Laszlo5,6,7, Tunde Harko5, Zsolt Megyesfalvi5,6,7, Judit Moldvay5, Fred R. Hirsch2,8, Balazs Dome5,6,7and Zoltan Lohinai5
1 Department of Anatomy, Histology and Embryology, Faculty of Medicine, Semmelweis University, Budapest, Hungary 2 Division of Medical Oncology, University of Colorado Anschutz Medical Campus, Aurora, CO, USA
3 Division of Thoracic Surgery, Department of Surgery, Faculty of Medicine, Kindai University, Osaka-Sayama, Japan 4 Shanghai Pulmonary Hospital, Tongji University, Shanghai, China
5 National Koranyi Institute of Pulmonology, Budapest, Hungary
6 Department of Thoracic Surgery, Semmelweis University and National Institute of Oncology, Budapest, Hungary
7 Division of Thoracic Surgery, Department of Surgery, Comprehensive Cancer Center, Medical University of Vienna, Austria 8 Tisch Cancer Institute, Center for Thoracic Oncology, Mount Sinai Health System, New York, NY, USA
Keywords
neuroendocrine; proteomics; SCLC; tumor microenvironment; tumor-infiltrating immune cells
Correspondence
B. Dome, Division of Thoracic Surgery, Department of Surgery, Comprehensive Cancer Center, Medical University of Vienna; Waehringer Guertel 18-20, A-1090 Vienna, Austria
Tel: +4314040073742
E-mail: balazs.dome@meduniwien.ac.at and
Z. Lohinai, Department of Tumor Biology, National Koranyi Institute of Pulmonology, H-1121, Piheno ut 1., Budapest, Hungary Fax: +36 1 3913357
Tel: +36 1 3913310
E-mail: zoltan.lohinai@koranyi.hu
(Received 2 February 2020, revised 8 May 2020, accepted 3 June 2020, available online 18 July 2020)
doi:10.1002/1878-0261.12741
Small cell lung cancer (SCLC) has recently been subcategorized into neuroen- docrine (NE)-high and NE-low subtypes showing ‘immune desert’ and ‘im- mune oasis’ phenotypes, respectively. Here, we aimed to characterize the tumor microenvironment according to immune checkpoints and NE sub- types in human SCLC tissue samples at the protein level. In this cross-sec- tional study, we included 32 primary tumors and matched lymph node (LN) metastases of resected early-stage, histologically confirmed SCLC patients, which were previously clustered into NE subtypes using NE-associated key RNA genes. Immunohistochemistry (IHC) was performed on formalin-fixed paraffin-embedded TMAs with antibodies against CD45, CD3, CD8, MHCII, TIM3, immune checkpoint poliovirus receptor (PVR), and indolea- mine 2,3-dioxygenase (IDO). The stroma was significantly more infiltrated by immune cells both in primary tumors and in LN metastases compared to tumor nests. Immune cell (CD45+ cell) density was significantly higher in tumor nests (P =0.019), with increased CD8+ effector T-cell infiltration (P=0.003) in NE-low vs NE-high tumors. The expression of IDO was con- firmed on stromal and endothelial cells and was positively correlated with higher immune cell density both in primary tumors and in LN metastases, regardless of the NE pattern. Expression of IDO and PVR in tumor nests was significantly higher in NE-low primary tumors (vs NE-high,P< 0.05).
We also found significantly higher MHC II expression by malignant cells in NE-low (vs NE-high,P =0.004) tumors. TIM3 expression was significantly increased in NE-low (vs NE-high, P <0.05) tumors and in LN metastases (vs primary tumors, P <0.05). To our knowledge, this is the first human study that demonstrates in situ that NE-low SCLCs are associated with increased immune cell infiltration compared to NE-high tumors. PVR, IDO,
Abbreviations
APC, antigen-presenting cell; DC, dendritic cell; FFPE, formalin-fixed paraffin-embedded; IDO, indoleamine 2,3-dioxygenase; LN, lymph node; MHC II, major histocompatibility complex II; NE, neuroendocrine; NK, natural killer; OS, overall survival; PFS, progression-free survival;
PVR, poliovirus receptor; SCLC, small cell lung cancer; TIL, tumor-infiltrating lymphocytes; TIM3, T-cell immunoglobulin and mucin domain- containing 3; TMA, tissue microarray.
MHCII, and TIM3 are emerging checkpoints in SCLC, with increased expression in the NE-low subtype, providing key insight for further prospec- tive studies on potential biomarkers and targets for SCLC immunotherapies.
1. Introduction
Very recently, substantial milestones have been achieved in the understanding of small cell lung cancer (SCLC) biology. Two recent randomized trials com- paring etoposide-platinum doublet therapy alone to the same therapy plus a checkpoint inhibitor (ate- zolizumab or durvalumab) as first-line therapy showed significant increases in progression-free survival (PFS;
4.3–5.2 month), response rate, and overall survival (OS; 12.3–13 vs 10.3 months) with the immunotherapy [1,2]. However, these benefits are limited, and biomarkers, such as smoking status, tumor mutation burden (TMB), and programmed cell death-ligand 1 (PD-L1) expression, did not predict outcome. The lack of a biomarker and the limited benefit for a small por- tion of patients points toward the idea that SCLC might be associated with a different immunological microenvironment [3,4]. Furthermore, a lack of tumor tissue availability due to disease aggressiveness limits our understanding of crucial immunological mecha- nisms, including immune cell infiltration, intertumor and intratumor heterogeneity, and is one reason behind the long-term failure of immunotherapies.
Moreover, in many patients, lymph node (LN) metas- tases are the primary motivators for rapid disease pro- gression, and their immunological environment is far less understood.
Small cell lung cancer is no longer considered as a single-disease entity, and subtypes are defined by dis- tinct RNA gene expression profiles which can be clas- sified into neuroendocrine (NE)-high and NE-low tumors, which may have different immunogenicity [5].
NE-high is characterized by decreased immune cell infiltration defined as a cold or ‘immune desert’ pheno- type, based on low levels of immune cell-related RNA expression. In contrast, NE-low was associated with tumors with increased immunogenicity, in other words
‘hot’ or ‘immune oasis’ phenotype [4–7]. Consequently, NE-low SCLC patients may more likely respond to immunotherapies [9,10]. The immune infiltrate is com- prised of innate and adaptive immune cells, whose populations are heterogeneous across tumor types and patients and include nonspecific immune cell types, such as macrophages, neutrophil granulocytes, den- dritic, mast and natural killer (NK) cells, or effector cells of specific immunity, like B- and CD3+ T cells
(CD4+ T helper, CD8+ cytotoxic T, and regulatory T [Treg] cells), localized in tumor nests, or adjacent tumor stroma [11]. A high number of dendritic cells (DCs), NK cells, B cells, and CD8+T cells were associ- ated with improved prognosis, while the presence of Treg cells correlates with decreased survival time in NSCLC [12,13]. The invasion of tumor nests by immune cells confers better OS in lung cancer and other malignancies [14,15].
In addition to the presence of tumor-infiltrating immune cells, the expression of specific immune check- points is also a crucial immune-suppressing factor in many cancers. Poliovirus receptor (PVR), an impor- tant factor in the SCLC microenvironment, is an adhe- sion molecule involved in cell motility, as well as NK cell and T-cell-mediated immunity. PVR is relatively absent in normal tissues, but regularly overexpressed in malignancies promoting tumor cell invasion and migration [16]. PVR expression was detected at low levels in multiple cell types of epithelial origin and overexpressed in cancers of epithelial and neural ori- gins [17–19]. PVR was also proved to play a crucial role in oncoimmunity, as a ligand of coinhibitory receptor TIGIT and CD96 on NK and T cells [20].
Recently, it was reported that PVR is highly expressed in SCLC cell lines with minimal expression observed on immune cells in the tumor microenvironment [21].
Indoleamine-2,3-dioxygenase 1 (IDO) is a key factor in defining cancer immunogenicity [22] and is a cytoso- lic enzyme catalyzing the first and rate-limiting step of tryptophan (Trp) catabolism. Multiple studies revealed that the accumulation of Trp metabolites promotes the differentiation of Treg cells and induces the apoptosis of effector T cells with consequent immunosuppression [23,24]. IDO is overexpressed in many tumor types exploiting immunosuppressive mechanisms to promote their spread and survival [25].
While antigen-presenting cells (APCs) constitutively express major histocompatibility complex (MHC) class II; many other cell types, including malignant cells, are also capable of expressing MHC II [26]. Tumor-speci- fic expression of the MHC II molecule was shown to increase tumor recognition by immune cells and conse- quently may play a pivotal role in immunotherapy [27]. Of note, MHC II expression by tumor cells has been associated with improved prognosis and response to immunotherapy in breast cancer [28] and melanoma
[29]. Lymphocyte exhaustion is a common cause of anergy in antitumor immune responses [30]. TIM-3, also known as HAVCR2, is a negative regulatory immune checkpoint and is detected in different types of immune cells, including T and B cells, macrophages, DCs, NK, and mast cells [31]. Its negative role in anti- cancer immunity was shown in mediating T-cell exhaustion [32,33], where T-cell immunoglobulin and mucin domain-containing protein 3 (TIM3)+ CD8+ T cells exhibited impaired Stat5 and p38 signaling.
This study focuses on the evaluation and quantifica- tion of immune cell infiltration by localization and dis- tribution patterns in the stroma and tumor nests according to SCLC NE subtypes. In addition, SCLC tumors were evaluated for the expression of MHC II, emerging immune checkpoints PVR, IDO, and lympho- cyte exhaustion markers, including TIM3 to allow for new trials of immune therapy in these SCLC subsets.
2. Materials and methods
2.1. Ethics statement
Research was conducted in accordance with the guide- lines of the Helsinki Declaration of the World Medical Association. The approval of the Hungarian Scientific and Research Ethics Committee of the Medical Research Council, (ETTTUKEB-7214-1/2016/EKU) was obtained and waived the need for individual informed consent for this study. After the collection of clinical data, patient identifiers were removed so that patients may not be identified either directly or indi- rectly.
2.2. Study population
A total of 32 histologically confirmed early-stage SCLC patients with available primary tumor tissue and matched LN metastases were included in our study as previously described [34]. All patients under- went surgical resection in the period from 1978 to 2013 at the National Koranyi Institute of Pul- monology. Formalin-fixed, paraffin-embedded (FFPE) tissue samples from primary tumors and LN metas- tases were obtained at the time of lung resection sur- gery. Clinicopathological characteristics were described earlier [34].
2.3. Tissue processing
Small cell lung cancer patient tumors were obtained by surgical resection and were fixed and processed
into paraffin blocks. Tissue microarray (TMA) con- struction from FFPE blocks was performed as previ- ously described [35]. Briefly, 4-micron sections from each tissue block were prepared using a HM-315 microtome (Microm, Boise, ID, USA) and placed on charged glass slides (Colorfrost Plus, #22-230-890;
Fisher, Racine, WI, USA). Slides were stained for H&E on an automated Tissue-Tek Prisma staining platform (Sukura, Osaka, Japan). H&E slides were reviewed by a laboratory pathologist for tumor area and the tumor border marked. Marked-stained sec- tions were used to guide the technician as to the location for punch tissue removal. Two 1-mm punches of tissue were taken from each donor tissue block for primary tumors, and one 1-mm punch from LN metastases blocks and seated into a recipi- ent paraffin block in a positionally encoded array format (MP10 1.0 mm tissue punch on a manual TMA instrument; Beecher Instruments, Sun Prairie, WI, USA).
2.4. Molecular analysis
RNA expression data from primary and LN FFPE tumor tissue samples were obtained using the HTG EdgeSeq Targeted Oncology Biomarker Panel as previ- ously described [34]. Tumors were clustered into NE- low (n=21) and NE-high (n= 43) subtypes according to their NE gene expression patterns as previously reported [34].
2.5. Immunohistochemistry
Four-micron-thick sections were cut from FFPE TMA blocks for IHC staining. Slides were stained on a Leica Bond RX autostainer using rabbit monoclonal anti- body for IDO (#86630), CD45 (#13917), CD3 (#85061), CD8 (#8112), MHC II (#68258), PD-L1 (13684S), and PVR (#81254) from Cell Signaling (Danvers, MA, USA) and diluted 1 : 200 with Cell Signaling antibody diluent (#8112) prior to staining.
Antibodies TIM3 (PA0360), LAG3 (PA0300), and PD-1 (PA0216) were from Leica Biosystems (Wetzlar, Germany) diluted 1 : 200 with Leica antibody diluent.
Slides were stained using the Bond Polymer Refine Detection kit (#DS9800) with Leica IHC Protocol F and exposed to epitope retrieval 1 (low pH) for 20 min. Following staining, slides were cleared and dehydrated on an automated Tissue-Tek Prisma plat- form and cover-slipped using a Tissue-Tek Film cover slipper. The detection of protein expression was opti- mized in human tonsil and thymus tissue as a positive control.
2.6. Cell counting and morphometry
Images of TMA sections were captured via a BX53 upright Olympus microscope and a DP74 color CMOS camera with 109 magnification objectives in 20MP resolution for scoring and cell counting and with 209 magnification for representative images from tumor tissues. Morphometry based on stromal and tumor nest area measurements was performed by OLYMPUS CELLSENS DIMENSIONS Software package by manual annotation of measured areas, as previously described [36]. In the case of primary tumors, for one patient, two different TMA specimens were analyzed (A and B), retrieved from different regions of resected tumors.
In the case of LN metastases, one TMA specimen was prepared from each LN sample. From all TMA blocks, two separate four-micron-thick sections (with a minimum of 100-lm distance inZbetween them) were quantified using high resolution (20MP) 109 magnifi- cation images. Positive cells for immune markers CD45, CD3, CD8, IDO, and TIM3 were identified by the presence of brown DAB precipitation around hematoxylin-stained cell nuclei by a systematic quanti- tative method based on software-assisted, manual cell counting by two independent observers using the cell counter plug-in of IMAGEJ software [37]. PVR and MHCII expression was assessed semiquantitatively, where 0=negative, 1=low, 2=moderate, 3=strong, 4=very strong expression scores were given for each specimen. Immune cells and tumor cells regarding MHC II—positivity were identified according to nuclear and cellular morphology. Quantification of IDO and TIM3 expression was based on positive cell numbers in stroma and tumor nests in the whole visual field (109 magnification) of two separate sections of one TMA core. No DAB signs without the character- istic cellular shape or without the co-presence of nuclear staining were included in the calculations.
Stromal and tumor nest total areas were measured using the area measurement tool in the OLYMPUS CELL- SENS DIMENSIONSsoftware package. Square micrometers (lm2) were converted to square millimeters (mm2) for calculation of cell density parameters in statistical analyses. Regions of apoptosis, necrosis, and damage or disruptions in the sections were not included in the measurements. Results (cell numbers and areas) from separate sections of the same TMA punches were aver- aged before statistical assessment.
2.7. Statistical methods
First, we used the Kolmogorov–Smirnov test to deter- mine which variable follows a normal distribution,
where CD45, CD3, CD8, IDO, PVR, TIM3, and MHC II do not, but CD3/CD45 and CD8/CD3 cell density ratios followed a normal distribution. Next, we used the Wilcoxon matched-pairs signed ranks test to test whether core A and B population mean rank differ.
However, we found no significant differences regarding any variables. Accordingly, we used average core A and B values in further statistical analyses. We used the Mann–Whitney U-test to compare CD45, CD3, CD8, IDO, and TIM3 expressions between primary tumors and LN metastases and between NE-low and NE-high subtypes in the stroma or tumor compartments. To compare NE-low and NE-high subtypes in the case of ordinal variables, PVR and MHCII, we used Mann– WhitneyU-test.P-values<0.05 indicate the significance and all P-values were two-sided. We found significant differences for all variables between tumor core A and stroma core A, or between tumor core B and stroma core B (Wilcoxon matched-pairs signed ranks test).
Accordingly, Wilcoxon matched-pair test was further used to compare CD45, CD3, and CD8 expression between stroma and tumor nests in primary tumors or LN metastases. We used unpaired Student’s t-test to analyze variables with normal distribution. Spearman’s rank correlation was used for continuous variables such as CD45, CD3, CD8, and IDO and Kendall’s Tau-b (Kendall rank correlation coefficient) for ordinal vari- able, PVR. The correlation coefficient (r) can vary between 1 and 1. We define no correlation (0< r<0.2), weak positive correlation (0.2< r< 0.4), moderate positive correlation (0.4<r <0.6), and strong positive correlation (0.6 <r <1). All statistical analyses were implemented using the PASW STATISTICS
22.0 package (SPSS Inc., Chicago, IL, USA).
3. Results
In our study, we aimed to reveal the precise distribution pattern of immune cellsin situon SCLC tissue samples.
For this, we performed IHC on serial sections of FFPE TMA samples and demarcated the histological compart- ments of tumor stroma (stroma) and epithelial tumor nests (tumor) with consequent software-aided area mea- surement, followed by cell counting in every sample.
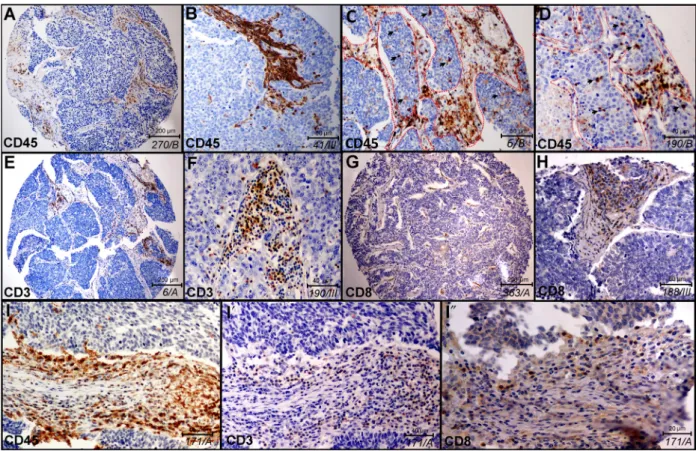
First, we analyzed the histological distribution of immune cells in stroma vs tumor nests in representative samples shown in Fig. 1. CD45 immunolabeling identi- fies a high number of immune cells in the stroma (Fig 1A,B), but a limited number of cells in epithelial tumor nests (Fig. 1C,D). Borders of fibrous stromal strands and tumor nests are shown with dashed lines, and immune cells inside tumor nests are indicated with arrowheads in Fig.1C,D on representative TMA
sections. CD3 labels all mature T-cell populations of round cellular morphology (Fig.1E,F), whereas CD8 represents the general marker for cytotoxic (effector) T cells (Fig.1G,H). Successive sections from the same pri- mary tumor sample of SCLC patient show the expres- sion of CD45 (Fig.1I), CD3 (Fig.1I0) and CD8 (Fig1I
″) on consecutively narrower cell populations (immune cells, T cells, CD8+T cells) in the same area of the TMA specimen. Based on ourin situHE-stained sections, the stroma and tumor area ratio were similar in primary tumors and LN metastases (Fig. S1A), and there were no statistically significant differences according to NE subtypes (Fig. S1B).
3.1. Immune cell distribution in primary tumors and lymph node metastases
Next, we compared the presence of immune cells according to anatomic localization. Immune cell marker
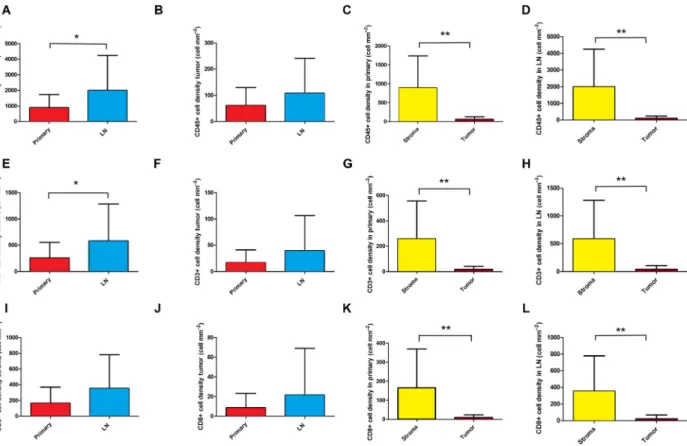
expression according to primary tumors vs LN metas- tases is shown in Fig.2. We found that CD45+ (Fig.2A,B), CD3+ (Fig.2E,F), and CD8+ (Fig.2I,J) immune cell density was significantly higher in the stroma of LN metastases compared to primary tumors, but there was no significant difference in the case of tumor nests (tumor). Moreover, the stroma of primary tumors were significantly more infiltrated by major immune cells vs tumor nests, in primary tumors (Fig.2, G,K; P <0,001) and in LN metastases (Fig.2D,H,L;
P<0,001). Figure S2 shows the relative distribution of major immune cells in stroma vs tumor nests, according to primary tumors and LN metastases.
3.2. Immune cell distribution according to NE subtypes and tumor compartments
Table S1 shows the key tumor microenvironmental protein expression data according to NE-low vs NE-
Fig. 1.Histological localization of major immune cells in SCLC in representative tissue samples. Qualitative in situ IHC data on the histological distribution of immune cells show high immune cell density in the stroma and a low number of labeled cells in tumor nests (A, B magnified image) stained with anti-CD45 antibody and hematoxylin (ID of samples in italics). Infiltration of CD45+immune cells in tumor nests can be low (A, B) or moderate (C, D), where dashed line signs the border of stroma and epithelial tumor nests (C, D) and arrowheads show immune cells inside tumor nests (D). Sections of whole TMA specimens stained with anti-CD3 and anti-CD8 antibodies show the presence of CD3+T cells (E, F) and CD8+cytotoxic T cells (G, H) in low (E, G) and high (F, H) magnification images in tumor stroma and sparsely in tumor nests. High magnification images of consecutive sections from the same TMA specimen and region of interest show CD45 (I), CD3 (I0) and CD8 (I″) labeling of tumor-infiltrating immune cells.
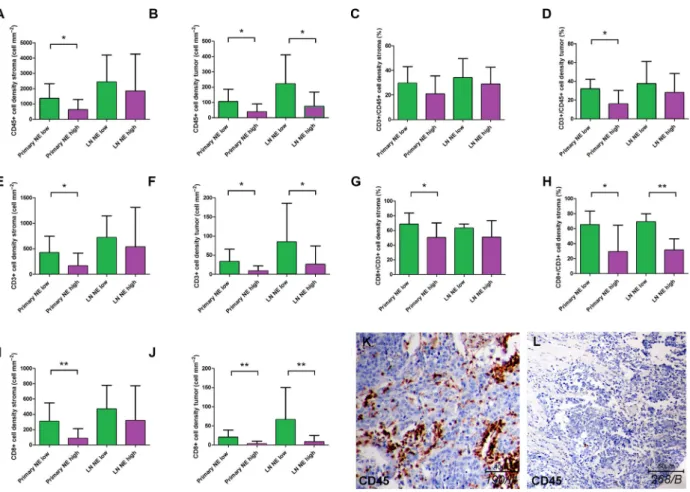
high SCLC subtypes. In primary tumors, we found a significantly increased stromal density of CD45+ cells (Fig.3A; P =0.02), CD3+ cells (Fig. 3E; P= 0.022), and CD8+ cells (Fig.3I; P= 0.006) in NE-low com- pared to NE-high subtypes. Similarly, there were sig- nificantly increased cell densities of CD45+ cells (Fig.3B; P= 0.019), CD3+ cells (Fig. 3F; P= 0.035), and CD8+ cells (Fig.3J; P=0.003) in tumor nests as well. Next, we analyzed LN metastases in terms of NE subtypes and immune cell distribution, where we found a significantly increased density of CD45+, CD3+, and CD8+ cells in NE-low compared to NE-
high LN metastases in tumor nests (Fig. 3B,F,J), but not in the stroma (Fig. 3A,E,I). Figure3C,D,G,H show the relative immune cell distributions according to NE subtypes, where CD3/CD45 and CD8/CD3 ratios were significantly increased in NE-low (vs NE- high), tumors (P <0.05) in tumor nests, but not in stroma. Figure3K shows a representative sample of NE-low SCLC subtype stained with CD45, where mas- sive infiltration of stroma and a relatively high number of immune cells in tumor nests are characteristic. On the contrary, a typical ‘immune desert’ or infiltrate-ex- cluded phenotype with scattered CD45+ cells both in
Fig. 2.Immune cell distribution in primary SCLC tumors and matched LN metastases according to stroma and tumor nests. Significantly higher cell density was determined in the stroma of LN metastases compared to primary tumors, for CD45 (893.1159.4 vs 1993426.6 cellmm2,P=0.049,n=59, A), CD3 (258.556.47 vs 585.4132.2 cellmm2,P=0.033,n=56, E), but not for CD8 (165.938.46 vs 356.080.07 cellmm2,P=0.075,n=58, I). Immune cell density showed no significant difference in tumor nests (tumor) in LN metastases compared to primary tumors, for CD45 (61.5213.21 vs 107.926.25 cellmm2,P=0,215,,n=59, B), CD3 (17.134.62 vs 39.5013.13 cellmm2,P=0.251,n=56, F), and CD8 (8.662.78 vs 21.629.295 cellmm2,P=0.332,n=58, J).
Moreover, the stroma of primary tumors are significantly more infiltrated by major immune cells vs tumor nests, for CD45 (893.1159.4 vs 61.5213.21 cellmm2, P<0.001, n=31, C), CD3 (258.556.47 vs 17.134.62 cellmm2, P<0.001, n=29, G), and CD8 (165.938.46 vs 8.672.78 cellmm2,P<0.001,n=30, K). The stroma of LN metastases are significantly more infiltrated by major immune cells vs tumor nests, for CD45 (1993426.6 vs 107.926.25 cellmm2, P<0.001, n=28, D), CD3 (585.4132.2 vs 39.5013.13 cellmm2,P=0.002,n=26, H), and CD8 (356.080.07 vs 21.629.295 cellmm2,P<0.001,n=28, L). Wilcoxon matched-pair test was used to compare immune cell densities in the stromal vs intratumoral compartments. Mann–Whitney U-test was used to compare immune cell densities in the stroma and tumor compartments of primary tumors vs LN metastases. Metric data were shown as mean and corresponding SEM, and graphs indicate the mean and corresponding 95% CI. Statistical significance *P<0.05;
**P<0.01.
Fig. 3.Immune cell distribution in primary SCLC tumors and matched LN metastases according to stroma and tumor nests based on NE tumor subtypes. Stained specimens revealed increased CD45+cell densities in NE-low primary tumor subtypes compared to NE-high ones including both stroma (1371300.5 vs 627.5156.8 cellmm2, respectively, P=0.02, n=31, A) and tumor nests (tumor;
106.226,67 vs 39,1712.04 cellmm2, respectively,P=0.019,n=31, B). We found a significantly increased density of CD45+cells in NE-low LN metastases compared to NE-high subtypes in tumor nests (221.07.06 vs 73.9520.86 cellmm2, respectively,P=0.035, n=28, B) but not in stroma (2436668.1 vs 1845527.7 cellmm2, respectively, P=0.071, n=28, A). There were significantly increased densities of CD3+ cells in NE-low primary tumor compared to NE-high subtypes in stroma (423.7103 vs 166.858.09 cellmm2, respectively, P=0.022, n=29, E) and in tumor nests (33.2210.89 vs 9.083.11 cellmm2, respectively, P=0.035,n=29, F). We found a significantly increased density of CD3+cells in NE-low LN metastases compared to NE-high subtypes in tumor nests (84.6741.47 vs 25.9510.83,P=0.032,n=26, F) but not in stroma (721.9160.4 vs 539.9168.8,P=0.527,n=26, E). There were significantly increased densities of CD8+cells in NE-low primary tumor compared to NE-high subtypes both in stroma (307.577.11 vs 87.2829.77 cellmm2,P=0.006,n=30, I) and in tumor nests (20.566.11 vs 2.721.66,P=0.003,n=30, J).
We found a significantly increased density of CD8+ cells in NE-low LN metastases compared to NE-high subtypes in tumor nests (66.1734.30 vs 8.253.76 cellmm2, respectively, P=0.006, n=28, J) but not in stroma (469.4117.6 vs 318.299.36 cellmm2, respectively,P=0.063,n=28, I). According to NE-low and NE-high primary tumors the CD3+/CD45+cell ratio was limited to 29.552.25 % and 20.783.67% (P=0.14) in the stroma, and 32.073.84% and 15.863.88% (P=0.016) in tumor nests (C, D). According to NE-low and NE-high primary tumors, the CD8+/CD3+cell ratio was limited to 68.64.84% and 50.335.14%
(P=0.022) in the stroma and 65.216.79% and 29.1413.4% (P=0.033) in tumor nests, respectively (G, H). According to NE-low and NE-high LN metastases the CD8+/CD3+ cell ratio was limited to 63.142.14% and 50.895.11% (P=0.16) in the stroma and 694.41% and 31.274.54%,P<0.001 in tumor nests, respectively (G, H). CD45 immunolabeling on a representative section of NE- low (K) LN metastasis shows highly infiltrated stroma and tumor nests, whereas tumor-infiltrating immune cells are absent both in the stroma and in the tumor nests on the sample of NE-high primary tumor (L). Mann–Whitney U-test was used to compare immune cell densities in the stroma and tumor compartments in NE-high vs NE-low primary tumors and LN metastases. Student’st-test was used to compare CD3/CD45 and CD8/CD3 cell density ratios in NE-high vs NE-low primary tumors and LN metastases. Metric data were shown as mean and corresponding SEM, and graphs indicate the mean and corresponding 95% CI. Statistical significance *P<0.05; **P<0.01.
stroma and in tumor nests is shown in Fig.3Lfrom a representative sample of NE-high SCLC tumor sub- type.
3.3. Immune checkpoint expression and NE subtypes
The expression pattern of emerging immune check- points PVR and IDO in primary tumors and LN
metastases according to NE-high vs NE-low tumors is shown in Fig.4. IHC shows that PVR is expressed by tumor cells, but not by stromal cells in both NE SCLC subtypes (Fig. 4A,B). IDO is expressed by endothelial cells (Fig. 4D) and stromal cells of various morphol- ogy (Fig. 4C), just as by immune cells in tumor nests (Fig. 4E) in both NE SCLC subtypes. PVR expression showed no significant difference in primary tumors vs LN metastases (Fig.4F). However, in NE-low
Fig. 4.Distribution pattern of immune checkpoint PVR and IDO expression. PVR is expressed by tumor cells, but is not present in stromata including both NE SCLC subtypes (A, B). IDO is expressed by endothelial cells (D), stromal cells of various morphology (C), and by immune cells in tumor nests (E) in both NE SCLC subtypes. PVR expression showed no significant difference in primary tumor vs LN metastases (1.450.22 vs 1.210.22,P=0.425,n=50, F), but a significantly higher expression in NE-low vs NE-high was found both in primary tumors (2.110.3 vs 1.030.26,P=0.024,n=27, J) and LN metastases (1.830.47 vs 0.690.2,P=0.032,n=23, J). There were no significant differences between primary tumors and LN metastases regarding the IDO expression in stroma endothelial (8.782.09 vs 8.833.61,P=0.248,n=48, G) and nonendothelial cells (16.023.26 vs 24.799.68,P=0.541,n=48, H), whereas the intratumoral expression of IDO was significantly higher in LN metastases compared to primary tumors (3.171.09 vs 24.799.68,P=0.023,n=47, I). IDO stroma endothelium and nonendothelial cell expression showed no significant difference according to NE-low and NE-high tumor subtypes including primary tumors (11.753.18 vs 7.563.49,P=0.121,n=26, K and 21.815.34 vs 12.934,P=0.256,n=26, L) and LN metastases (10.205.39 vs 8.474.4,P=0.196, n=22, K; and 45.6034.66 vs 19.328.55,P=0.172,n=22, L). In contrast, the intratumoral expression of IDO was significantly higher in NE-low primary tumors (vs NE-high tumors; 7.312.15 vs 1.30.65,P=0.041,n=26, M), but not in LN metastases (45.6034.66 vs 19.328.55,P=0.172,n=21, M). Mann–WhitneyU-test was used to compare PVR and IDO expression in primary tumors vs LN metastases and in NE-high vs NE-low primary tumors and LN metastases. Metric data were shown as mean and corresponding SEM, and graphs indicate the mean and corresponding 95% CI.
Statistical significance *P<0.05.
subtype, a significantly higher expression was found compared in the NE-high subtype both in primary tumors (P =0.024) and in LN metastases (P=0.032;
Fig.4J).
There were no significant differences in IDO expres- sion of stroma endothelial (Fig.4G) and nonendothe- lial cells (Fig.4H) between primary tumors and LN metastases. In contrast, intratumoral expression of IDO was higher by orders of magnitude in LN metas- tases compared to primary tumors (P=0.023;
Fig.4I). We also assessed IDO expression in different NE phenotypes. IDO stroma endothelium and nonen- dothelial cell expression showed no significant differ- ence between NE-low and NE-high tumor subtypes neither in primary tumors nor in LN metastases (Fig.4K,L). On the contrary, intratumoral expression of IDO was significantly higher in NE-low (vs NE- high) primary tumors (P =0.041), but not in LN metastases (Fig.4M).
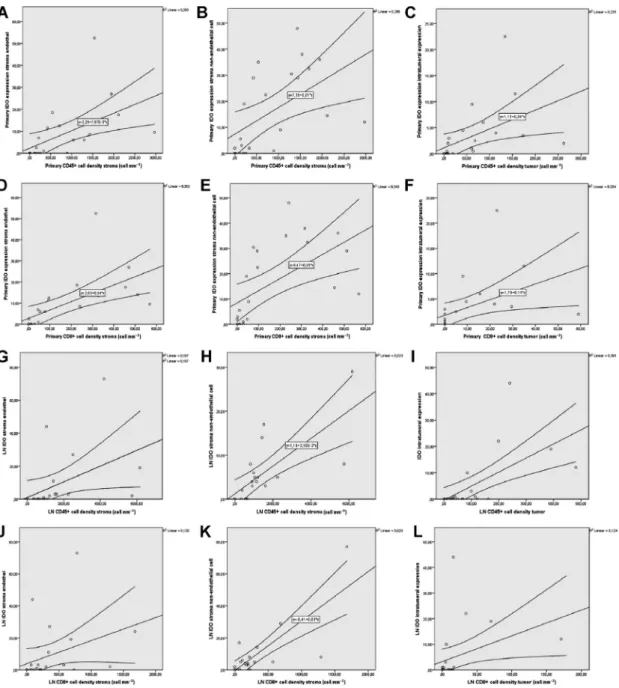
Next, we investigated the associations between the expression of immune checkpoints and immune cell infiltration (Table1), where we found a significantly strong positive correlation between IDO stroma endothelium, stroma nonendothelial cell, and immune cell density in stroma including CD45+ cells (Fig.5A, B) and CD8+ T cells (Fig.5D,E) in primary tumors.
Furthermore, there was a statistically significant strong positive correlation between primary tumor IDO expression and immune cell density in tumor nests, including CD45+ cells (Fig.5C), and CD8+ T cells (Fig.5F). In terms of LN metastases, we found a sta- tistically significant strong positive correlation between IDO stroma endothelium, stroma nonendothelial cell, and stromal CD45+cell density (Fig.5G,H) and a sig- nificant moderate positive correlation between IDO stroma endothelium, stroma nonendothelial cell, and stromal CD8+ T-cell density (Fig.5J,K). Moreover, there was a statistically significant strong positive cor- relation between IDO expression and immune cell den- sity in tumor nests including CD45+cells (Fig.5I) and CD8+ T cells (Fig.5L). Plot charts of statistically sig- nificant correlations between PVR expression and immune cell density are shown in Fig. S3.
3.4. Expressional analysis of MHC II protein and T-cell exhaustion markers TIM3, PD1, and LAG3 In our analysis, we performed immunostainings and in situ expression-based scoring of MHC II molecule, pivotal in antigen presentation and immunological crosstalk in the tumor microenvironment [27]. Stain- ings on representative tissue samples show strong MHC II expression in the majority of SCLC tumors.
Interestingly, apart from immune cells in the stroma and tumor compartments, MHCII is also expressed on cancer cells of tumor nests, especially in NE-low tumors (Fig.6A–E). Of note, in certain samples, tumor cells showed diffuse expression of MHC II (Fig.6B), in some tumors the molecule occurred exclu- sively on clusters of cancer cells, scattered in tumor nests (Fig.6A,C,D). Although there was no significant difference in the immune cell expression of MHC II between NE-low and NE-high tumors (Fig.6H, tumor cells showed significantly higher MHC II expression in NE-low compared to NE-high primary tumors (P =0.004; Fig.6I).
Next, we evaluated the extent of lymphocyte exhaus- tion in SCLC. We performed IHC with antibodies against TIM3, PD1, and LAG3 molecules. None of the tissue samples of our 32 patients’ cohort (neither primary tumors nor LN metastases) displayed positiv- ity for PD1 or LAG3. On the contrary, TIM3 expres- sion was present on lymphocytes of stromal bands and tumor nests as well (Fig.6E,F). Both stromal expres- sion and intratumoral expression of TIM3 were signifi- cantly higher in NE-low vs NE-high primary tumors (P =0.025 andP =0.015, respectively), but not in LN metastases (Fig.6J,K). Of note, the absolute number of TIM3-positive cells in each sample was considerably higher in LN metastases compared to primary tumors (Fig.6J,K). PD-L1 protein expression was not found in any of the samples (data not shown).
4. Discussion
The standard of care therapy for extensive-stage SCLC now includes immunotherapy in the front-line setting.
The addition of atezolizumab or durvalumab to chemotherapy has changed practice recently and is associated with a moderate significantly longer PFS and OS than chemotherapy on its own [1,2]. However, as of yet, no predictive biomarkers have been identi- fied, and the PFS curves seem to overlap during the initial 8 months, showing that most patients do not benefit from immunotherapy. Additionally, there were increased OS benefits for selected patients that might respond to immunotherapy.
Recent advancements in transcriptomics studies highlight the potential of a distinct microenvironment in SCLC NE subtypes. Understanding the immunol- ogy of NE subtypes might affect the clinical outcome and help lay the framework for immunotherapy administration in this devastating cancer [6–8]. How- ever, to date, studies have been performed exclusively on NSCLC samples. Therefore, our study aims to fill this gap of knowledge with a detailed IHC analysis of
Table1.Correlationofimmunecheckpointsexpressionandimmunecellinfiltration.n:numberofpatients;r:CorrelationCoefficient;P:probabilityvalue;Primary:primarytumor;Stroma: tumorstromaarea;Tumor:tumornestincludingintratumoralarea. Primarytumorcelldensity(cellmm2)LNmetastasiscelldensity(cellmm2) CD45+CD3+CD8+CD45+CD3+CD8+ StromaTumorStromaTumorStromaTumorStromaTumorStromaTumorStromaTumor PrimaryPVRexpressionr0.399a0.529b0.360a0.426a0.406a0.500b0.250.120.340.200.300.21 P0.0120.0010.0240.0110.0110.0040.3200.6400.1590.4210.2190.413 n242424242424181819181918 IDOstromaendotheliumr0.782b0.870b0.851b0.907b0.872b0.797b0.250.040.070.010.030.04 P0.0000.0000.0000.0000.0000.0000.3090.8650.7540.9560.9040.878 n232323232323191820182018 IDOstromanonendothelialcellr0.702b0.770b0.757b0.790b0.772b0.697b0.220.060.030.010.020.10 P0.0000.0000.0000.0000.0000.0000.3670.8170.8990.9540.9190.686 n232323232323191820182018 IDOtumorr0.722b0.796b0.767b0.829b0.812b0.801b0.040.240.120.330.160.29 P0.0000.0000.0000.0000.0000.0000.8580.3390.6060.1800.4910.252 n232323232323191820182018 LNPVRexpressionr0.100.030.120.100.120.250.527b0.507b0.355a0.543b0.300.521b P0.6190.9010.5700.6380.5580.2340.0020.0030.0350.0020.0760.004 n252425242524222222222222 IDOstromaendotheliumr0.390.080.200.090.170.070.806b0.641b0.450a0.515a0.542b0.523a P0.0620.7200.3410.6710.4150.7620.0000.0010.0310.0120.0060.010 n242324232423232323232323 IDOstromanonendothelialcellr0.220.060.090.100.020.170.801b0.779b0.636b0.665b0.681b0.679b P0.2990.7720.6860.6340.9140.4320.0000.0000.0030.0010.0000.000 n242324232423232323232323 IDOtumorr0.220.010.060.190.050.050.661b0.689b0.300.558b0.400.581b P0.3060.9810.7760.3860.8090.8150.0010.0000.1710.0060.0530.004 n242324232423222323232323 a Correlationissignificantatthe0.05level(two-tailedSpearmantest). b Correlationissignificantatthe0.01level(two-tailedSpearmantest).
Fig. 5.Plot diagrams of significant moderate-to-strong correlations between immune checkpoints and immune cell infiltration. There was a significant strong positive correlation between primary tumor IDO stroma endothelium, stroma nonendothelial cell, and immune cell density in stroma including CD45+cells (r=0.78 andr=0.7, respectively,P<0.001, A, B), and CD8+T cells (r=0.87 andr=0.77, respectively, P<0.001, D, E). Similarly, there was a statistically significant strong positive correlation between primary tumor IDO intratumoral expression and immune cell density in tumor nests, including CD45+cells (r=0.79,P<0.001, C), and CD8+T cells (r=0.8,P<0.001, F).
A statistically significant strong positive correlation was present between IDO stroma endothelium, stroma nonendothelial cell, and CD45+ cell density in the stroma of LN metastases (r=0.8 andr=0.8, respectively,P<0.001, G, H). There was a significant moderate positive correlation between IDO stroma endothelium (r=0.54,P<0.006) and CD8+T-cell density and a strong positive correlation between stroma nonendothelial cell and CD8+T-cell density (r=0.68,P=0.001) in the stromata of LN metastases (J, K). Moreover, there was a statistically significant strong positive correlation, between primary tumor IDO intratumoral expression and immune cell density in tumor nests, including CD45+cells (r=0.68,P<0.001, I), and a moderate positive correlation between the same parameters, regarding CD8+T cells (r=0.58, P<0.001, L). Spearman’s rank correlation was used for variables CD45, CD3, CD8, IDO, and Kendall’s Tau-b (Kendall rank correlation coefficient) for ordinal variable PVR. Metric data were shown as mean and corresponding SEM, and graphs indicate the mean and corresponding 95% CI.
immune cell populations on human SCLC tissue sam- ples. We aim to provide an in-depth intertumor heterogeneity array of IHC staining on primary tumors vs matched LN metastases on immune cell infiltration and immune activation of stroma and epithelial tumor nests in NE-low and NE-high tumor phenotypes. Importantly, to our knowledge, this is the first human study deliveringin situproteomics data on immune cell populations in LN metastases of SCLC patients.
Our main findings from this study interpret the proteomic profile of the tumor microenvironment to further highlight the relevance of NE-low vs NE- high tumor subtypes in the clinical setting. It is also important to note that the presence of lymphatics-as- sociated genes might influence any transcriptomic study performed on LN metastases. Therefore, our in situ proteomic analysis might overcome the limita- tions above. Others showed that the extent of immunological infiltration in tumor tissue and the expression of immune checkpoints proved to be a reliable marker for response to anti-PD-1 immunotherapy and long-term survival NSCLC [38], and other malignancies, like breast cancer [39], mela- noma [40], colorectal carcinoma [41], and prostatic cancer [42] as well. Another group indicated on NSCLC TMA samples that a high number of stro- mal CD4+ and epithelial and stromal CD8+ cells were independent positive prognostic markers, and CD8+ tumor-infiltrating lymphocytes (TILs) can stratify immunotherapy-treated patients of different clinical outcome [43]. Furthermore, a low level of CD8+ lymphocyte infiltration in tumor stroma was
positively correlated with an augmented incidence of angiolymphatic tumor invasion [38].
In the current study, we first revealed that immune cell infiltration both in primary tumors and in LN metastases is predominant in loosely arranged stromal bands, but not in tumor nests. Even in selected, rela- tively highly infiltrated tumors, only about 7% in pri- mary and 5% in LN metastasis of CD45+ cells and 5% and 6%, respectively, of CD8+T cells are localized in the close microenvironment of tumor cells (Fig.2).
Furthermore, we established that the stroma of LN metastases had significantly higher immune cell density compared to primary tumors; however, this difference was not significant in tumor nests (Fig.2). Our analy- ses demonstrated that both stromal and intratumoral CD3+/CD45+cell ratio is limited to 27% when pooling both primary tumors and LN metastases (Fig. S2A).
This means that TILs make up only about one quarter of all immune cells regardless of their anatomic (macroscopic) localization (primary tumor vs LN).
Consequently, a significant fraction of CD45+ cells belongs to populations of macrophages, DCs, neu- trophils, or other nonspecific immune cells in SCLC.
In contrast to CD3+/CD45+cell ratios, we found a sig- nificant difference in CD8+/CD3+ cell ratio in stroma vs tumor when both primary and LN metastases were pooled, meaning tumor stroma has a significantly higher ratio of effector T cells compared to tumor nests (Fig. S2B).
The same TMA sets clustered NE-high and NE-low SCLC subsets [34] based on the top RNA genes asso- ciated with NE differentiation [9,44,45]. The latest pre- clinical studies suggest that, compared to the NE-high,
Fig. 6.MHC II and lymphocyte exhaustion marker expression in SCLC. Qualitativein situIHC data on representative primary tumor and LN metastasis samples (ID of samples in italics) show strong expression of MHC II protein (A, B). MHC II is expressed in stromal (C arrows), intratumoral immune cells (C asterisk), and in cancer cells of tumor nests similarly (C arrowhead). MHC II staining in tumor nests can be diffuse (B), or mosaical (D encircled area, magnified inset from A). NE-low tumor shows strong expression of MHC II molecule on cancer cells and on stromal and intratumoral immune cells (A–D), whereas NE-high tumor exhibits strong stromal MHC II expression on immune cells, but not in tumor nests or cancer cells (E). TIM3 protein is expressed in stromal lymphocytes and scattered immune cells in tumor nests of NE-low LN metastasis (F). In NE-high tumors, only a low number of TIM3+cells occur sparsely in stromal brands (G). There were no significant differences in immune cell expression (stromal and intratumoral pooled) of MHC II molecule between NE-low and NE-high tumors neither in primary tumors (2.830.22 vs 2.290.19,P=0.086,n=30, H), nor in LN metastases (2.820.16 vs 2.450.19, P=0.289, n=27, H). However, tumor cells show significantly stronger MCII expression in NE-low versus NE-high primary tumors (2.110.45 vs 0.410.25,P=0,004,n=30, I), but not in LN metastases (1.50.67 vs 0.660.18, P=0.298, n=27, I). NE-low tumors show significantly higher expression of TIM3 compared to NE-high tumors in the stroma of primary tumors (12.314.77 vs 4.072.48, P=0.025, n=29, J), but not in LN metastases (22.1710.53 vs 33.912.24, P=0.307, n=27, J). In tumor nests (tumor), expression of TIM3 is significantly higher in NE-low compared to NE-high primary tumors (2.871.15 vs 0.150.1,P=0.015, n=29, K), but the same difference is not significant in LN metastases (42.48 vs 3.441.72,P=0.905,n=27, K). Mann–Whitney U- test was used to compare MHC II and TIM3 expression in primary tumors vs LN metastases and in NE-high vs NE-low primary tumors and LN metastases. Metric data were shown as mean and corresponding SEM, and graphs indicate the mean and corresponding 95% CI.
Statistical significance *P<0.05; **P<0.01.
the NE-low subtype is more likely to respond to immunotherapy due to its ‘immune oasis’ phenotype, emphasizing the necessity and importance of molecular and in situ immunological characterization before the assessment of therapies to this type of recalcitrant can- cer [9]. Therefore, we compared in situthe quantitative and qualitative extent of the immunological microenvi- ronment of SCLC tumors according to NE-low and NE-high subtypes. In line with previously published data, our results confirm that NE-low tumors are sig- nificantly more infiltrated by immune cells, primarily by CD8+ effector T cells [9]. Interestingly, in our study, the CD3+/CD45+cell ratio was not significantly different in NE-low relative to NE-high tumors, sug- gesting that the T-cell population is not predominant, neither in stroma nor in tumor nests of NE-low tumors. In contrast, a substantially higher percentage of CD8-expressing lymphocytes are present both in NE-low primary tumors and in LN metastases (vs NE-high), and the difference is even more considerable in tumor nests (Fig.3).
Next, in order to identify targets and further under- stand the immune microenvironment, we analyzed expression of immune checkpoints. PVR (CD155) has been reported to mediate T cell activationvia CD226, or impede T lymphocytes by binding to TIGIT. PVR overexpression is associated with poor prognosis in melanoma, colorectal, lung, and pancreatic cancers [46–49]. Our data show that strong PVR expression was significantly more frequent in NE-low vs NE-high tumors, both in primary tumors and in LN metastases.
Although PVR overexpression was correlated with poor prognosis in multiple studies [48,49], we found a significant moderate positive correlation between PVR expression and immune cell density in tumor nests including CD45+and CD8+cells.
Another checkpoint, IDO, belonged to the group of anticancer molecules based on its antipathogenic func- tion [50]. Subsequent studies, however, identified tissue macrophages producing high levels of IDO upon inter- feron-gamma (IFN-c) stimulation inhibiting effector T-cell proliferation [51]. IDO expression was reported in lung cancer cell lines [52] andin situ in 42–43% of NSCLC samples [53,54]. We found IDO expression on stromal cells of various morphology. Of note, the pres- ence of IDO in stroma endothelial cells is a novel find- ing in SCLC. Previous studies showed that the endothelial expression of IDO in metastatic kidney cancer promotes response to immunotherapy and is associated with better PFS [54]. In line with other NSCLC studies, we observed scattered IDO immuno- labeling only on tumor nest immune cells but not on tumor cells [54]. The role of IDO was demonstrated in
other respiratory conditions as well, like pneumonia, where inflammatory macrophages were identified as a primary source of the molecule [56]. IDO expression was not different in stromal cellular elements or endothelium according to NE subtypes. However, IDO expression in tumor nests showed significantly higher levels in NE-low tumors. Consequently, estab- lishing an immunosuppressive microenvironment for TILs that might explain why NE-low tumors do not unequivocally have better prognosis despite their ‘im- mune oasis’ phenotype. Stroma IDO expression might be associated with many types of inhibitory cells in the immunosuppressive tumor microenvironment, like can- cer-associated fibroblasts, myeloid-derived suppressor cells, or tumor-associated macrophages, which requires further confirmation. Interestingly, intratumoral expression of IDO showed a conspicuous discrepancy in LN metastases where IDO-positive cells were much more abundant, than in primary tumors (Fig. 4I). Our findings show that LN metastases are significantly more infiltrated by immune cells (vs primary tumors).
This might result in clinically indifferent molecular behavior and aggressiveness of LN metastases due to their distinct immunological microenvironment and immune checkpoint expression patterns. Moreover, there was a statistically significant strong positive cor- relation between intratumoral expression of IDO and immune cell density in tumor nests including CD45+ cells (Fig. 5C) and CD8+ T cells (Fig.5F). Our data suggest that IDO overexpression is an escape mecha- nism of tumor cells making immune cells and lympho- cytes entering tumor nests anergic and unable to launch an immune response against them.
In lung cancer, it was previously shown in cell lines [57] and tissue samples that some tumor cells displayed MHC II expression, mostly in the vicinity of TILs in highly infiltrated tumors [58]. The latter fact suggests that immune cell infiltration may induce MHC II expression in tumor cells in a permissive microenviron- ment. In our study, we also revealed that MHC II molecules are expressed in situ on cancer cells of cer- tain SCLC tumors, but predominantly in the NE-low subtype (Fig. 6), whereas PD-1 and PD-L1 protein expression was not detectable in situ in any of the samples. This finding is similar to other researchers’
that reported a relatively low rate of PD-L1 expression in SCLC up to 35.0% (with a very low cutoff point of 5% for PD-L1 positive/negative expression), which was consistently lower than that in NSCLC [59]. This difference can be explained by a variety of factors, including tumor stage and assays used. We found no expression of lymphocyte exhaustion marker LAG3 in our study showing that LAG3 is not relevant in the