Ceramics International xxx (xxxx) xxx
Available online 14 November 2020
0272-8842/© 2020 The Author(s). Published by Elsevier Ltd. This is an open access article under the CC BY license (http://creativecommons.org/licenses/by/4.0/).
Significance of the surface and bulk features of hierarchical TiO 2 in their photocatalytic properties
Endre-Zsolt Kedves
a,b, Zsolt Pap
b,c,d,*, Klara Hernadi
d, Lucian Baia
a,b,**aFaculty of Physics, Babes¸-Bolyai University, M. Kog˘alniceanu 1, Cluj-Napoca RO–400084, Romania
bCentre of Nanostructured Materials and Bio-Nano Interfaces, Institute for Interdisciplinary Research on Bio-Nano-Sciences, Treboniu Laurian 42, Cluj-Napoca RO- 400271, Romania
cInstitute of Environmental Science and Technology, University of Szeged, Tisza Lajos krt. 103, HU-6720, Szeged, Hungary
dDepartment of Applied and Environmental Chemistry, University of Szeged, Rerrich t´er 1, HU-6720, Szeged, Hungary
A R T I C L E I N F O Keywords:
Solvothermal crystallization Titania
Photocatalyst Crystal phase Surface quality
A B S T R A C T
Solvothermal crystallization is an adequate approach for preparing differently shaped TiO2 crystalline materials because it is highly sensitive to the synthesis parameters change. This study presents two sample series, one prepared from tetraisopropyl orthotitanate TTIP and one from tetrabutyl orthotitanate TBU. The influence of the applied temperature, different capping agents’ amount, and the precursor volume ratio affected the measured characteristics (crystal phase composition, primary crystallity size, morphology, surface chemistry and optical properties). Although the samples revealed strong differences in crystal phase and size distribution, mostly spherical hierarchical morphology was achieved. The as-prepared samples were applied in photocatalytic pro- cesses to assess their efficiency under UV light and examine the influence of the structural features on the photocatalytic process. Not only the chosen precursor but the subtle changes in the listed parameters resulted in catalytical performance differences. Besides the crystal phase composition and the Ti3+and Ti4+species, it was found that organic surface particularities influenced the semiconductors’ photocatalytic performance.
1. Introduction
Hierarchical TiO2 nanomaterials have shown many potential appli- cations in photocatalysis including photocatalytic water splitting, solar energy conversion, sensors, electrochromic-, photochromic-, optical-, optoelectronic- and electrochemical devices [1,2]. The development of this type of semiconductor is necessary because its structure, quality, and morphology define the nanomaterials’ applicability resulting in higher efficiency of the desired application [3,4]. The morphology control of nanocrystals entered in the focus of semiconductor-research during the last decade, including improvement of the photocatalytic efficiencies or modulating the gas sensing properties by the means of shape-tailoring [5,6].
In the literature, various synthesis routes are well-known to obtain TiO2 crystals in diverse forms. Using solvothermal crystallization is a good approach to control the morphology of the nanoparticles since the synthesis conditions are easily adjustable. Parameters such as the
concentration of titania precursor, amount and structure of surfactants, the temperature/duration of the hydrothermal crystallization are among the most important factors which control the shape of semiconductor nanoparticles [7]. The resultant features such as size, geo- metry/morphology and crystal phase of the materials, largely affect the photocatalytic performance and other applications of the semiconductor [8].
The study of hierarchical nanostructures has brought a lot of recent attention, due to their high specific surface area, beneficial light ab- sorption, an appropriate refractive index, and other excellent chemical and physical properties [8]. Many results indicate that hierarchical semiconductor structures exhibit higher photocatalytic activity than other nanocrystals with well-defined morphology [3,9–11]. Forming porous or mesoporous properties for titania nanostructures were considered as an efficient way to improve the efficiency of light ab- sorption. The higher specific surface area and inner particle activation resulted efficient charge separation [7,11]. Hierarchical structures are
* Corresponding author. Centre of Nanostructured Materials and Bio-Nano Interfaces, Institute for Interdisciplinary Research on Bio-Nano-Sciences, Treboniu Laurian 42, Cluj-Napoca RO-400271, Romania.
** Corresponding author. Faculty of Physics, Babes¸-Bolyai University, M. Kog˘alniceanu 1, Cluj-Napoca RO–400084, Romania.
E-mail addresses: pzsolt@chem.u-szeged.hu, pap.zsolt@phys.ubbcluj.ro (Z. Pap), lucian.baia@phys.ubbcluj.ro (L. Baia).
Contents lists available at ScienceDirect
Ceramics International
journal homepage: www.elsevier.com/locate/ceramint
https://doi.org/10.1016/j.ceramint.2020.11.061
Received 12 June 2020; Received in revised form 12 October 2020; Accepted 7 November 2020
efficient in photocatalytic applications due to the enlarged surface area, which is built up from nano-sized polycrystalline particles, furthermore, the inter-particle connections enhance the charge transfer rate of pho- togenerated electrons [7]. Among other semiconductors (e.g. BiVO4, MoO3, WO3, TiO2, etc.) the synthesis of hierarchical structures is becoming more popular. Novel self-assembled BiVO4 hierarchical nanostructures (blood cell-like shaped and flower-like microsphere) were synthesized and they also revealed high photocatalytic activity (visible light degradation of methylene blue) which was closely corre- lated with the morphology [12,13]. MoO3 hierarchical structures are generally considered as an excellent candidate as visible light photo- catalyst [10,14,15]. WO3 hierarchical nanostructures are long-known as visible light active photocatalyst and in the detection of organic com- pounds, showing long-term stability and recyclability [9,16,17]. TiO2, as a widely studied promising semiconductor, has also these beneficial properties. Unfortunately, it has lower activity under visible light, but it is a more efficient photocatalyst under UV irradiation than the above-mentioned semiconductors because TiO2 has a higher quantum yield in UV light [18–20].
Hierarchical spheres, flower-like nanostructures were synthesized in ultra-stable foams or by hydrothermal and solvothermal method. Re- searchers found that TiO2 anatase structures with exposed (001) facets showed better reactivity than the thermodynamically stable (101) sur- face [21,22]. Theoretical calculation suggested that the (001) crystal facets showed much better gas adsorption activity compared to (101) facets [5]. Li H. et al. [19] reported a solvothermal method to obtain hierarchical flower-like TiO2, where the reaction time, applied tem- perature and the addition of ethanol played a critical role. Their results revealed that the hierarchical flower-like nanostructures of anatase contain thin TiO2 nanosheets dominated by (001) facets exposed with good photocatalytic performance, which can be attributed to the syn- ergetic effect of the hierarchical structure, high crystallinity, large spe- cific surface areas, and the exposed highly active (001) facets of the crystal. Their samples showed higher stability even after calcination at 600 ◦C, the hierarchic nanostructure deteriorated somewhat but the extended dominance of (001) facets further improved the photoactivity.
Other researchers used simple solvothermal methods to prepare anatase TiO2 nanoplates with exposed (001) facets, in the presence of fluoride ions F−. They achieved promising photonic efficiency (nearly 75%) in the decomposition of acetaldehyde [23].
As already stated above, the agglomeration of individual crystals (e.
g. BiVO4, WO3, MoO3 and TiO2) into secondary morphologies results occasionally increased photocatalytic properties in visible and UV light [13,24,25]. Therefore, the present work focuses on the investigation of shape tailored hierarchical TiO2 structures, as photocatalysts, and their functioning mechanism. The present work investigates the effect of the systematically chosen synthesis parameters (such as: temperature, the used surfactant amount, precursor concentration) on the hydrolysis of TTIP and TBU precursors and the assessment of their photocatalytic activity, including the importance of the surface carbon contamination.
Specifically, the tuning capacity of their structural, morphological, and surface particularities for improving the photocatalytic performances are also evidenced.
2. Materials
All chemicals were used as received: titanium tetraisopropoxide (TTIP, reagent grade 97%, MERCK), titanium butoxide (TBU, reagent grade 97% Aldrich), hexadecyltrimethylammonium bromide (CTAB, Aldrich), urea (NORDIC), ethylene glycol (99,8%, anhydrous, Aldrich USA), distilled water, HCl (35–38%, CHEMPUR), acetone (99.5%, NORDIC), commercially available TiO2 (Aeroxide P25, Evonik In- dustries) as reference photocatalyst and the model pollutants methyl orange (MO) (85%, NORDIC) and salicylic acid (SA) 99.5% purity (Sinteza, Oradea) were used. Furthermore, methanol (ME, ACS reagent,
≥99.0% Aldrich USA), p-benzoquinone (BZQ, ≥99.5% (HPLC) Aldrich
USA) and isopropanol (IPA, HPLC, 99.9% Aldrich USA) were employed as scavengers.
2.1. Synthesis TiO2 hierarchical nanostructures
Two TiO2 sample series were synthesized by hydrothermal crystal- lization using TTIP and TBU as precursors. An aqueous precursor solu- tion (TTIPaq or TBUaq) was prepared in two steps. Firstly 0.945 g CTAB was added in 40 mL distilled water and stirred until a transparent so- lution was obtained. Meanwhile, (0.25 mL of TTIP or 0.29 mL of TBU) the chosen precursor was added dropwise into 20.65 mL concentrated HCl. After stirring for 30 min, the acidic solution was added into the aqueous CTAB solution and it was further stirred for 1 h. The control sample (sample C) was crystallized from the above-mentioned mixture using a Teflon-coated autoclave (~61 mL into 170 mL autoclave).
To achieve shape-controlled crystals, aqueous precursor solution (TTIPaq or TBUaq) was mixed with ethylene glycol (EG) (Vprecursor-aq:VEG
=1:2) resulted in the “F” samples. The “I” samples were obtained from the same procedure, but urea was also added. In both cases, the auto- clave was 70% (120 mL) loaded. The molar ratios applied during the synthesis for C, F and I samples were: (TTIP or TBU: CTAB: HCl: H2O:
Urea) 1:3:284:3373:0, 1:1:284:3373:0, 1:3:284:3373:5.85. In each case 40 mL distilled water was used, in the molar ratios the water from the hydrochloric acid is also included. The same synthesis procedure was carried out, while the amount of the precursor was 10 times higher in order to verify the effect of different hydrolysis conditions. These sam- ples were denoted by using “CC” as subscript after the C, F, or I letter.
Every sample was obtained by solvothermal crystallization at two different temperatures (150 ◦C and 180 ◦C) for 20 h. The obtained white precipitate was washed (centrifugation time: 5 min at 6000 rpm) several times with water and with acetone until the supernatant was colorless.
Despite washing with acetone, the samples prepared at 180 ◦C had a slightly brownish color, suggesting organic contamination, when EG was used. The product was dried in an oven at 70 ◦C for 20 h under continuous airflow.
In summary, we present two main series of samples one prepared from TTIP and one from TBU (Fig. 1). Within the series of TTIP or TBU samples, there are three cases (C, F and I) which separate the samples in function of the number of surfactants used. In each case, we used two different precursor amount and two different applied temperatures.
Therefore, the samples were named as follows: precursor name’s abbreviation, the synthesis case, the absence or the presence of subscript
“cc” indicates the precursor amount and the synthesis temperature.
2.2. Characterization methods
X-ray diffraction (XRD) measurements were performed on a Rigaku Miniflex-II Diffractometer (angle-range: 2θ◦=20–40◦, λ =0.15418 nm) using characteristic CuKα X-ray radiation. The crystallites’ average size was calculated using the Scherrer equation [26]. For the samples that exhibited multiple crystal phases, the weight percentage was deter- mined using two empirical methods [26,27]. For the samples containing a mixture of anatase and rutile phases, their weight ratio was calculated by the method developed by Banfield et al. [26], while the samples which were built from three crystal phases, the calculations were carried out based on reference [27].
A JASCO-V650 spectrophotometer with an integration sphere (ILV- 724) was used for measuring the reflectance spectra of the samples (λ = 250–800 nm) by using the DRS (diffuse reflectance spectroscopy) and as reference BaSO4. The indirect band gap of the TiO2 samples was deter- mined via the Kubelka–Munk method [28].
The FT-IR absorption spectra were recorded with a JASCO 4100 spectrometer (Jasco, Tokyo, Japan), in the range of 400–4000 cm−1, with 4 cm−1 spectral resolution and using KBr pellets as a reference. The pellets were prepared by mixing 1.5 mg of TiO2 and 200 mg of KBr.
The microcrystalline morphology of the samples was analyzed by
field emission scanning electron microscopy (FE-SEM), Hitachi S-4700 Type II FE-SEM operating in the range of 5–15 kV. The samples were attached to an adhesive carbon tape which was fixed to an aluminum holder. The TEM micrographs and SAED patterns of selected samples were registered using a FEI TECNAI G2 20 X-Twin transmission electron microscope operating at 100 kV.
The specific surface area values were measured by N2 adsorption and the Brunauer-Emmet-Teller (BET) approach, using a Sorptomatic 1990 apparatus and the pore size distribution was evaluated for a selected sample.
Raman spectra of the samples were acquired using a Thermo Scien- tific DXR Raman microscope, equipped with a diode-pumped frequency- doubled Nd:YAG laser with 10 mW maximum laser power (780 nm, spot size of approximately 1 μm). The acquired spectra were recorded at 2 cm−1, while a 50 μm slit confocal aperture was used for each measurement.
The photoelectron spectroscopy XPS spectra were recorded by using a Specs Phoibos 150 MCD system employed with a monochromatic Al-Kα source (1486.6 eV) at 14 kV and 20 mA, a hemispherical analyzer and, a charge neutralization device. The oxide samples were fixed on a double- sided carbon tape where the powder completely covered the tape. The binding energy scale was charge referenced to the C 1s at 284.8 eV.
High-resolution Ti 2p and O 1s spectra were obtained using analyzer pass energy of 20 eV in steps of 0.05 eV for analyzed samples. The data analysis was carried out with CasaXPS software.
2.3. Photocatalytic investigations
Reaction conditions for the photocatalytic efficiency experiments were a photochemical reactor system with 6 ×6 W fluorescent lamps, (λmax ≈360 nm), the irradiation time was of 2 h. Before starting the degradation experiment, the suspension was kept in the dark for 10 min (to achieve the adsorption/desorption equilibrium). The adsorbed amount of (MO) for neither sample was significant (under 5%), while in the case of salicylic acid (SA) various adsorption degree values were achieved (between 20 and 40%).
During the photocatalytic test, 1.5 mL sample was taken every 10 min in the first hour, and every 20 min in the second hour. The photo- catalyst suspension contained organic pollutant in an initial concentra- tion of C0 initial =0.125 mM or SA C0 initial =0.350 mM, where the suspension concentration was CTiO2 =1 g L−1 and the volume of the suspension was Vsuspension =0.17 L. During the experiment, the system was continuously purged by air to maintain the dissolved oxygen con- centration. The quantitative analysis of MO and SA was carried out using an Analytic Jena Specord 250 plus UV–Vis spectrophotometer at 513 nm (MO) and 298 nm (SA). The photolysis of MO and SA under the applied photodegradation conditions was negligible. The reference catalyst was Evonik Industries’ P25 TiO2. In the charge carrier trapping experiments two samples were investigated: the reference photocatalyst (P25) and sample TBU Fcc 150. Four quenching agents were used in the trapping experiments: isopropanol (IPA) (0.02 M) as hydroxyl radical ( OH), p- benzoquinone (BZQ) (0.001 M) as superoxide anion radical ( O2−), and
methanol (Me) (0.02 M) and formic acid (FA) as hole h+, scavengers.
3. Results and discussion
3.1. Influence of the solvothermal temperature and the capping agents on the morphology of TiO2
3.1.1. Samples obtained from TTIP
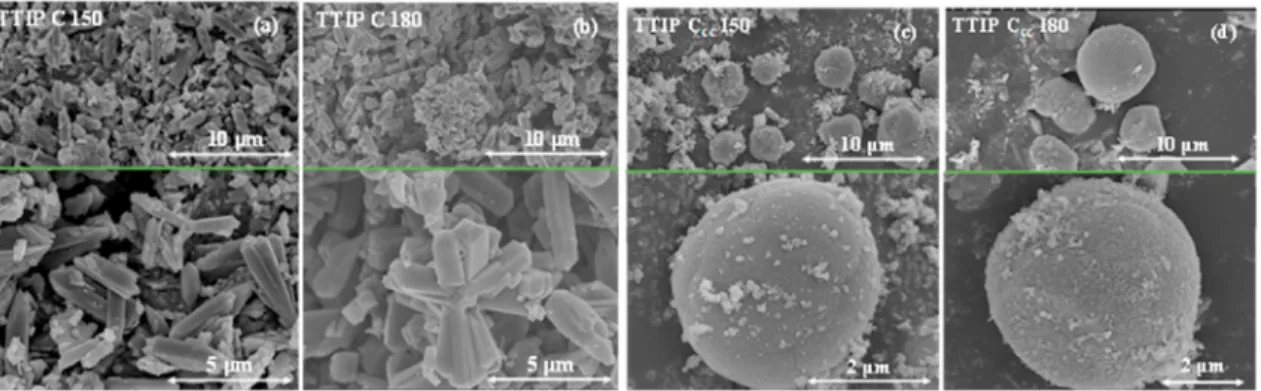
The above-mentioned three parameters, i.e. (precursor amount, surfactants presence and the applied temperature) are further investi- gated in-detail to reveal the formation mechanism of the differently- shaped hierarchical TiO2 nanostructures. Control samples (TTIP C) showed two dominant morphologies depending on the applied precur- sor concentration. TTIP C 150 contained only irregular microrods with an average width of 1 μm. TTIP C 180 (Fig. 2 a, b) sample presented similar morphology to sample TTIP C 150 showing TiO2 hierarchical microrods which were grown from a central point. Increasing the pre- cursor concentration (samples TTIP Ccc 150 and TTIP Ccc 180) the base morphology changed from microrods to a spherical one. It seems that the solvothermal treatment temperature increased the hierarchical crystal size (TTIP Ccc 150 - 2 μm, TTIP Ccc 180 - 4–5 μm, Fig. 2 c, d).
The TTIP F and TTIP I samples were prepared using different capping agents (EG and urea) including CTAB. Among the samples, the hierar- chical sphere-like morphology was the most representative one. TTIP F 150 and TTIP Fcc 150 samples showed hierarchical structures with an average diameter of 2 μm, however, the microparticles were not monodisperse (Fig. 3 a, c). Interestingly, when the applied temperature was 150 ◦C, the increased precursor concentration did not affect the size nor the shape of the crystals. The temperature increase induced a well- developed monodisperse crystalline system with spherical morphology with 1.5 μm average diameter (TTIP F 180, Fig. 3 b) and a polydisperse system that possessed an undefined morphology (TTIP Fcc 180, Fig. 3 d).
The samples coded as TTIP I 150 and TTIP F 150 showed hierarchical structures as well, however, a high degree of aggregation was observed in TTIP I 150 (Fig. 4 a). When the hydrothermal temperature was further increased (TTIP I 180) a monodisperse system and a well-defined spherical morphology was achieved with an average crystal diameter of ~ 2 μm (Fig. 4 b), just as sample TTIP F 180, which on its surface showed primitive needle-like crystals, which were fully grown in TTIP I 180. Independently from the solvothermal crystallization temperature, the amount of the added precursor affected the I samples’ morphology (e.g. in the sample series F). The spherical geometry was not typical for TTIP Icc 150 and 180, both samples showed a similar polydisperse sys- tem without a specific shape. The only change was in the size of the aggregates, which varied from 1 μm up to 7 μm, Fig. 4 c, d.
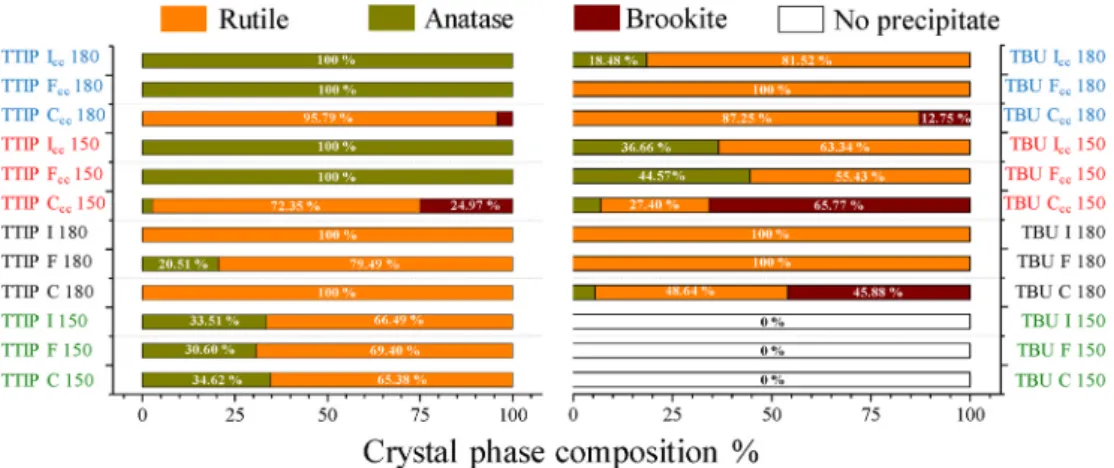
As it was detailed above in case of the TTIP series, the control sam- ples depicted a well-defined morphology from microrods to micro- spheres (Fig. 2), where the capping agents’ and the higher precursor’s concentration determined the main morphological characteristics (Fig. 2). The same synthesis condition changes in the case of samples F and I showed that the spherical morphology (e.g. Figs. 3–4 a, b) dis- appeared and a polydisperse crystalline system formed (e.g. Fcc 180, Icc Fig. 1. TTIP (left) and TBU (right) samples, the circles’ area size shows the relative amount of the precursor between the “simple” and “CC” sample series. If the circle is not color-filled, then no catalyst was obtained after the particular synthesis procedure. (For interpretation of the references to color in this figure legend, the reader is referred to the Web version of this article.)
150 and Icc 180). It seems that the precursor concentration and the temperature affected the morphology, crystal size, and monodispersity of the system, while the presence of urea, promoted the growth of needle-like crystals on the microspheres’ surface. (Fig. 4 a, b). The presence of EG favored the formation of a monodisperse system (F and I samples).
3.1.2. Samples obtained from TBU
Using the base amount of TBU (0.29 mL), no precipitation was observed after the solvothermal crystallization, which was carried out at 150 ◦C. The increased temperature (180 ◦C), however, was adequate to form the desired TiO2 crystals. TBU C 180 sample’s micrographs dis- closed a polydisperse system where the aggregated structures showed an average size of 2–3 μm (Fig. 5 b). TBU Ccc 180 presented a well-defined
spherical morphology with an average size of 4–5 μm (Fig. 5 d). It is evident that in this specific case, the synthesis temperature had a considerable impact on the microstructures. While sample TBU Ccc 180 is built up by aggregated spherical particles with an average size of 4–5 μm, TBU Ccc 150 had an average crystal size in the range of 200–300 nm without a specific shape (Fig. 5 c, d). Comparing the TTIP C to TBU C samples it can be pointed out, that changing the precursor of the syn- thesis may lead to microcrystals showing different morphological fea- tures and crystallite size distribution (Fig. 2 a, b, c, d and Fig. 5 b, c, d).
Capping agents (CTAB and EG) were applied successfully to obtain the TBU F sample series. TBU F 180 and TBU Fcc 150 revealed spherical morphology (Fig. 6 b, c), while TBU F 180 presented monodisperse 2 μm sized microparticles (Fig. 6 b), which were built from the same needle- shaped crystals as sample TTIP F 180 (Fig. 3 b). TBU Fcc 150 sample Fig. 2. SEM micrographs of TTIP C samples present different morphological characteristics (from microrods to hierarchical microspheres). Every figure is divided into two micrographs presenting the hierarchical structure of the sample and the size distribution.
Fig. 3. SEM micrographs of TTIP F samples present mainly microspherycal morphology.
Fig. 4. SEM micrographs of TTIP I samples present different morphological characteristics depending on the precursor amount: hierarchical microshperes and randomly aggregated particles..
presents similarities (the TEM investigations did not reveal any new features, neither hollow structures and it is presented in Figure S2) in morphology as in the TBU F 180, but on the surface of 3 μm sized mi- crocrystals, 200-300 nm-sized nanoparticles were attached (Fig. 6 c).
Increasing the applied crystallization temperature and the precursor
concentration (sample TBU Fcc 180) the microspherical crystals started to aggregate, therefore the monodispersity of this system decreased compared to the other TBU F samples (Fig. 6 d).
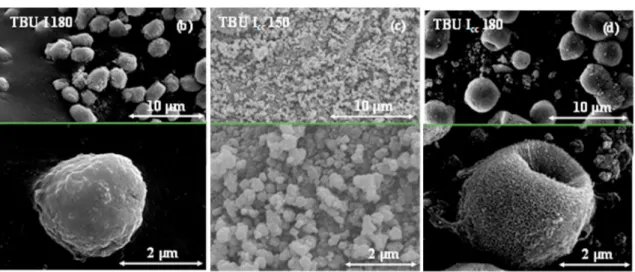
Fig. 7 shows the SEM micrographs of the TBU I samples. Both sam- ples prepared at 180 ◦C (TBU I 180, TBU Icc 180), revealed that the Fig. 5. SEM micrographs of TBU C samples present dominantly microspherical aggregates. Every figure is divided into two micrographs presenting the hierarchical structure of the sample and the size distribution. Since no precipitate was obtained in TBU C, F and I 150 samples were not shown.
Fig. 6.SEM micrographs of TBU F samples present dominantly microspherical aggregates.
Fig. 7. SEM micrographs of TBU I samples present dominantly microspherical aggregates.
formation of microcrystals with spherical morphology was preferred (Fig. 7 b, d). Comparing TBU I 180 to TBU Icc 180, the crystal size increased from 2 μm to 4–5 μm due to the precursor amount (Fig. 7 b, d).
Unfortunately, at 150 ◦C in the presence of urea, TBU Icc 150 sample, had irregular crystal shape, just aggregated TiO2 particles were observed (Fig. 7 c). These irregular particle aggregations were built from 50 to 150 nm-sized nanocrystals (based on SEM micrographs), where the aggregated particle size distribution was between 0.6 and 1.0 μm (Fig. 7 c).
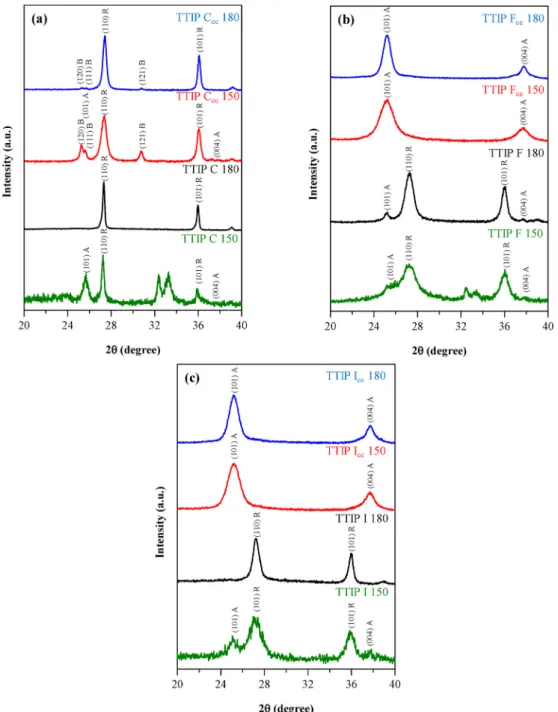
3.2. Structure and crystallite mean size of the obtained TiO2 particles The samples were investigated using X-ray diffractometry to gather information about the crystal phase composition and primary crystallite mean size of the samples. Fig. 8 shows the XRD patterns of all TTIP samples. In each control (C) sample the dominant crystal phase was
rutile, however, the solvothermal crystallization temperature and the amount of precursor determined the appearance of other crystal phases as well. It is evident that the increase of the precursor concentration resulted in the formation of brookite in two samples (TTIP Ccc 150 and TTIP Ccc 180), whereas the ratio between rutile and brookite was slightly affected by the temperature. Namely that the thermodynami- cally stable rutile phase ratio increased with the crystallization tem- perature (Fig. 8 a) [29].
The crystal phase composition of F and I samples was dependent on the precursor amount used. TiO2 crystals obtained in the presence of a tenfold precursor concentration resulted in samples composed entirely of anatase (TTIP Fcc 150 and TTIP Fcc 180). At lower precursor amount, samples TTIP F 150, TTIP F 180 and TTIP I 150) contained mostly rutile accompanied with 20–30% of anatase. The exception was sample TTIP I 180 (Fig. 10), which contained only rutile. In every case, the higher amount of precursor diminished the primary crystallite mean size
Fig. 8. XRD patterns of TTIP C (a), TTIP F (b) and TTIP I (c) samples, C sample series shows all three crystal phases (A – anatase, B – brookite, R – rutile), F and I samples present just rutile and anatase.
(Table S1) while the aggregates’ size increased (Figs. 2–4).
The effect of the applied crystallization temperature on the crystal- lite mean size was summarized in Table S1, showing that higher crys- tallization temperature increases the average primary crystallite mean size. This effect is dependent on the synthesis additives, particularly the presence of EG diminishes the impact of temperature on the primary crystallite mean size change.
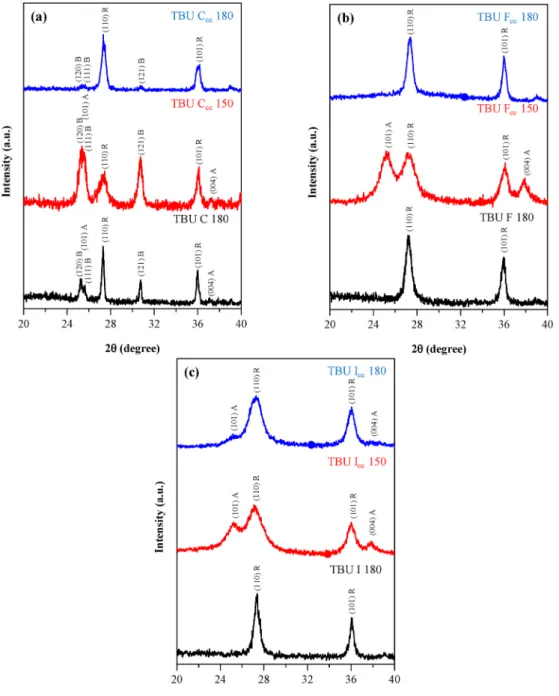
Fig. 9 shows the XRD patterns of all TBU samples. All TBU C samples contained anatase, rutile and brookite crystal phases in different ratios, where the presence of anatase was negligible. The dominant phase was rutile when the crystallization temperature was 180 ◦C. TBU C 180 has a
~ 5% of anatase and 45% brookite, while in TBU Ccc 180 the rutile and brookite phases were present as negligible components. At 150 ◦C and increased precursor concentration (TBU Ccc 150) a similar crystal phase composition was achieved like at 180 ◦C, except the increased precursor amount at 150 ◦C favored the formation of brookite. It must be mentioned, that from TTIP series, TTIP Ccc 150 and TTIP Ccc 180,
contained all three crystal phases similarly to TBU C samples just the ratio of the components was different. Therefore, by changing the pre- cursor amount, the ratio of these three crystal phases, for both TBU and TTIP samples, can be influenced.
Smaller primary crystallite mean size was obtained as the precursor amount increased which suggested that the hydrolytic process of the precursor most probably occurred differently in function of the added precursor amount. Initially, samples in the C series presented crystallite mean size from 76.4 nm to 29.5 nm, this range decreased in the presence of EG (TBU F and I series): in case of F (from 15 nm to 5.4 nm), while in case of I (4.7 nm–20.8 nm). Interestingly, this correlation is present in the TTIP series as well (Table S1). The primary crystallite mean size increases with the applied crystallization temperature in the TBU series as well, just as in the case of the TTIP series. During the solvothermal synthesis, the presence of EG prevented in both cases, the primary crystal size growth (Table S1).
The distinct diffraction peak ((121) crystallographic plane at 30.75
Fig. 9. XRD patterns of TBU C (a), TBU F (b) and TBU I (c) samples as in TTIP samples the C samples presenting all three crystal phases (A – anatase, B – brookite, R – rutile) while F and I samples present just rutile and anatase.
(2θ◦)) of the brookite crystal phase was not detected in TBU F and I samples. Following the TBU Ccc, Fcc and Icc 150 samples, it was observable that in the presence of EG (TBU Fcc 150 sample) firstly the brookite phase disappeared, then the anatase phase amount was reduced as urea was added to the crystallization (see TBU Icc 150 sample), meanwhile, the rutile became the dominant crystal phase (Fig. 9 a, b, c).
Regardless, the other synthesis parameters (temperature or precursor concentration), the primary crystallite mean size considerably decreased as more capping agents were added. The formation of primary crystallite size and as well their aggregation are highly sensitive to the nature of the used additives and their concentration in the synthesis [30]. The crys- tallite sizes of TBU C samples were in the interval of 26.7–80.2 nm and were reduced to 5.7–18.1 nm (TBU F samples) and respectively to 4.7–20.8 nm (TBU I samples).
Comparing the two main sample sets, it was found that TTIP con- tained more often anatase TiO2 compared to other crystalline phases, even at 180 ◦C. If the rutile crystal phase was present (e.g. in samples prepared at 150 ◦C), then its ratio increased with the crystallization temperature. In TBU samples the rutile phase is more frequent, while in the TTIP series four samples did not contain rutile (in TBU series there is just one sample, Fig. 10). In both sample series, the presence of EG prevented the formation of the brookite phase. In TBU I samples, the presence of urea supported the formation of needle-like crystals but had no significant effect on the crystal phase composition.
The as-prepared crystals show different structural characteristics based on the nature of the precursor, precursor amount, applied tem- perature, and the capping agents which are summarized in Fig. 10.
Based on the XRD patterns, it seems that the capping agents influenced both the crystal phase composition and the primary crystallite mean size.
As the temperature increased the size of the particles for the non-cc samples decreased, while for the samples denoted with cc increased.
More precisely, among TTIP samples lower temperature resulted larger hierarchical structures, but it must be mentioned that the primary crystallite size (attached in supplementary information Table S1) is higher when the applied temperature was 180 ◦C. However, the tem- perature favors the crystallite size increase preventing the newly formed crystals to form aggregates, therefore the occasionally formed aggre- gates were smaller. In case of “cc” samples, the concentration of the precursor determines the crystallization, hence the temperature affects only the primary crystallite mean size, and not the hierarchical struc- tures’ size.
In contrast, in the TBU series both the primary crystallite size and the hierarchical structure size increased with the applied temperature. Be- sides, the hydrolysis rate of TBU was lower than that of TTIP therefore the temperature had lower impact on the formation of hierarchical structures – in case of TBU at 150 ◦C the crystallization did not occur.
Whether TTIP or TBU was used the primary crystallite size was affected
comparably by the temperature but considering the hierarchical struc- tures’ size the temperature’s influence differs.
It should be mentioned that also Raman and porosity measurements were carried out. The first one reinforced the crystal phase composition values shown in Fig. 10, while the second one showed that all the samples are mesoporous ones. One representative example was provided in the supplementary information as Figure S3 and Figure S4.
Considering the obtained amount of the samples, from the photo- catalytic point of view, samples TTIPcc and TBUcc were considered.
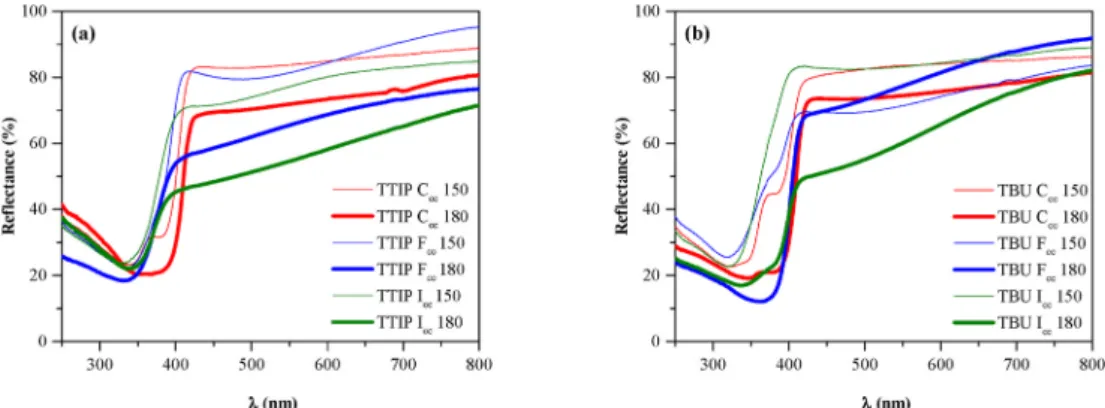
Fig. 11 shows the diffuse reflectance spectra of TTIPcc and TBUcc TiO2
samples. The band gap values were determined for each sample by Kubelka-Munk method, can be found in the Table S2. Among the TTIPcc
samples, TTIP Ccc 150 and 180 showed the lowest band gap values (2.89 eV and 2.85 eV, respectively), because the high rutile content was dominant. TTIP Ccc 150 contained rutile and two other crystal phases as well, therefore, a higher energy value (2.89 eV) was achieved than in the case of TTIP Ccc 180 (2.85 eV). For the most rutile dominated samples these values were relatively low because, the bulk rutile band gap is ≈ 3.0 eV, which may indicate the TiO2 could be doped with N which decreased the band gap [31,32].
TTIP Fcc and Icc samples which contained only anatase showed a band gap value near to 3.0 eV, which was a small value for a bulk anatase crystal if the 3.2 eV value was considered as reported in the literature [32,33]. Regarding DRS measurements, TTIP Icc 180 was an exception most probably due to the remanent organic compounds, which remained after the crystallization procedure and influenced its optical property.
Fig. 11 b presents the optical properties of the TBU series. The results showed that the band gap values of TBU samples were increased (Table S2) compared to those of TTIP samples. TBU Ccc 150, where the dominant phases were brookite and anatase, had an increased band gap value (3.08 eV), compared to TBU Ccc 180 (2.96 eV), because of the rutile content. Both TBU Icc 180 (2.98 eV) and TTIP Icc 180 samples’
(2.89 eV) optical properties were also influenced by the remanent organic compounds. The band gap values of TBU samples showed similar trends as in the case of TTIP, namely that which contained anatase showed a 3.0 eV or higher band gap energy.
The materials prepared at 180 ◦C exhibited higher absorption in the visible range compared to the samples obtained at 150 ◦C (Fig. 11). This spectral behavior indicates the presence of organic contaminations on the material’s surface. We can also remark that the optical properties, for both sample series, were affected in a similar way as the capping agent number increases.
3.3. Photocatalytic activity
The photocatalytic activity of the samples was assessed under UV illumination and MO was used as a model organic compound. Fig. 12 Fig. 10.Comparison of TTIP and TBU samples’ phase composition. In the absence of EG, C samples, the brookite formation occurred consequently.
shows the degradation curves of MO when TTIPcc, TBUcc, and the reference catalyst were tested. Among the TTIP samples, only TTIP Ccc 150 was active, which contained rutile, brookite, and anatase. However, the other TTIP samples with high anatase content (TTIP Ccc 180 con- tained mostly rutile), proved to be inactive during the degradation tests of MO (Fig. 12). The inactivity of TTIP samples, containing only anatase, was surprising since the anatase crystal phase might exhibit high pho- tocatalytic performance [34]. Anyway, the inactivity of the TTIP Ccc 180 sample was expected, because of rutile, which is usually considered as an inactive catalyst in UV light [35]. The photocatalytic activity of the rutile structure can be boosted in composites due to the synergistic effect between the mentioned structure and other types of metal oxides. [36], as it happens in the well-known P25–TiO2, where the anatase and rutile particles are constantly in contact [35].
The efficiency of TBU Ccc, Fcc and Icc 180 catalysts was negligible as expected, again due to their high rutile content (Fig. 12). Although, just the precursor is different, TTIP Ccc 150 and TBU Ccc 150 samples possessed with all the three crystal phases but in a different proportion, TTIP Ccc 150 was an active photocatalyst (33% conversion - 70% rutile content), while TBU Ccc 150 with 65% brookite content, was inactive.
Despite TBU Fcc 150 and Icc 150 samples contained both anatase and rutile, they exhibited a good photocatalytic activity achieving nearly 80% conversion of methyl orange and salicylic acid (Fig. 13). Among the active samples, the best photocatalytic performance was shown by TBU Fcc 150. This enhancement in photocatalytic activity could be attributed to the crystal phase composition, morphology of the hierarchical mi- crocrystals, or to the surface chemistry of the crystals [37]. It is already known that hierarchical systems containing both anatase-rutile can greatly enhance the photocatalytic performance, due to the high number of crystalline phase junctions [38]. The previously mentioned scenario could be valid in the present case as well as the two active samples that contained both rutile and anatase and were formed at the same time.
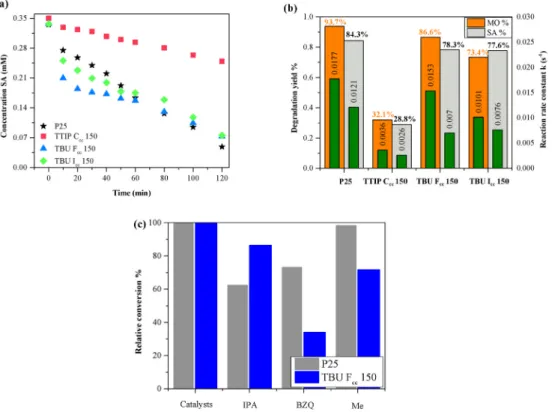
The three active photocatalysts and P25–TiO2 as a reference, were also used in the degradation of SA. The degradation yield of SA for every sample (Fig. 12 b) was similar to the degradation yield of MO (Fig. 13 b).
During the photodegradation of SA, 25% of adsorption occurred, behavior that was not observed throughout the MO photocatalytic tests.
During the photodegradation of MO, the intermediates were not detectable using UV–Vis spectrophotometry, but MO residues could be present in these processes [39], while during the decomposition of SA the UV–Vis absorption spectra indicate the formation of byproducts (as we have shown in our recent work [40]). As it happened in the case of sample TTIP Ccc 150, where is the most visible, that intermediates were formed during the photocatalytic degradation of SA, in the 255–275 nm and 320–360 nm spectral ranges (catechol and dihydroxybenzoic acid could be formed [40]). Therefore, the concentration of SA decreases slowly because the byproducts and SA spectral light absorption range overlap causing the overall light absorption increase. In P25 degradation byproducts were also noticeable but it not accumulated as it does in TTIP Ccc 150 decomposition. During the degradation of SA, using samples TBU Fcc 150 and Icc 150, the presence of the byproducts were uncom- mon, indicating a different possibly slower mechanism (Figure S1).
As we stated previously in the introductive section, hierarchical structures possess high specific surface area, therefore for the most active samples 2 times larger specific surface area values were obtained compared to the reference P25: TBU Fcc 150 126 m2 g−1, TBU Icc 113 m2 g−1 and for P25 54 m2 g−1 [41]. The microspheres, despite having two times higher surface area, achieved a similar conversion as the reference photocatalyst, in the degradation of both pollutants. This suggests that besides the specific surface area other structural features determine the overall efficiency of a photocatalyst.
Generally, photocatalytic reactions follow pseudo first order kinetics (the well-known Langmuir-Hinshelwood model) [37,42–44] due to the absence of initial byproducts were not detected we assumed first order Fig. 11. UV–Vis diffuse reflectance spectra of TTIP and TBU samples. Samples prepared at 180 ◦C possess lower band gap values than the ones obtained at 150 ◦C as well their reflectance in the visible range is somewhat lower.
Fig. 12. Photocatalytic degradation of MO by TTIPcc (a) and TBUcc (b) samples under UV light. Interestingly, the majority of anatase containing samples were inactive, merely three samples with mixed crystal phases presented valid photocatalytic performance, which was studied in detail.
kinetics for both pollutants to calculate the reaction rate constants, which includes also the adsorption rate. The MO degradation curves show that TBU samples initially are more efficient but P25 reached higher conversion after 2 h. This indicates that TBU samples’ perfor- mance depends on the pollutant concentration more likely than P25. In decomposition of SA, TBU Fcc 150 and TBU Icc 150 show faster initial degradation yield than P25 because of the expeditious initial adsorption, but overall P25 has a higher reaction rate thus produces higher con- version (Fig. 13 b).
In the photodegradation of MO quenching experiments were employed with the reference catalyst and TBU Fcc 150 sample as mentioned in the experimental section. Formic acid is considered as a hole scavenger, but during its decomposition hydrogen peroxide could form, which enhances the photocatalytic activity. That was observed in this case as well, as formic acid improved the photocatalytic activity, for both samples. Since in our case FA enhanced the decomposition of MO we used methanol. Scavenging the hydroxyl radicals and superoxide anion radicals in the case of P25 led to a ~38% and ~27% drop on the photocatalytic activity. P25 presented a photocatalytic mechanism mainly based on hydroxyl and superoxide radicals, which is already known. The hole scavenger had no effect on the P25 performance, so this type of degradation was less prominent. On the other hand, sample TBU Fcc 150 revealed that, in each case the photocatalytic activity was inhibited, including the case when methanol was used, showing a 38%
decrease in conversion. The performance of TBU Fcc 150 was less affected by isopropanol and methanol; however p-benzoquinone inhibited the photocatalytic activity by ~66%. Therefore, it was clear, that TBU Fcc 150 relies on all three type of degradation routes but mostly on the one based on superoxide anions. Interestingly, the two types of titania revealed that their degradation mechanism could be quite different, although both samples were anatase and rutile mixtures.
3.4. Analysis of TiO2 structure with infrared spectroscopy
IR spectroscopy was applied to ascertain the presence of organic
contaminants on the surface of TiO2 crystals. Fig. 14 presents the active TBU and inactive TTIP (prepared by the same procedure as TBU sam- ples) samples’ IR spectra to assess, the presence of organic deposits compared to TBU Ccc 150 sample, where just a small amount of CTAB was used. TiO2 characteristic absorption bonds ν(Ti–O, Ti–O–Ti) are located in the 800-400 cm−1 region. In the range of 1670–1740 cm−1, two signals corresponding to the carbonyl bands C––O were identified.
One at 1720 cm−1 which was assigned to the asymmetric νas (COO) stretching vibrations, while the second one at 1682 cm−1 was related to stretching vibrations of ν(C––O) [45]. Considering the band at 1720 Fig. 13.The three active photocatalysts performance were also tested in the degradation of SA (a), under UV light. The comparative photocatalytic conversion of MO and SA and the associated reaction rate constants can be also seen (b). Figure (c) presents the relative inhibition of the scavengers on P25 and TBU Fcc 150.
Fig. 14.Comparison of the active and inactive anatase samples’ FT-IR spectra.
Organic contamination differences were detected in the TBU and TTIP F and I samples.
cm−1 together with the bands localized at 1398 cm−1 bending δ(O–H), 1244 cm−1 δ(C–O), and stretching ν(O–H) vibrations at 3147 cm−1, confirmed the presence of carboxylic groups on the surface of TiO2
nanoparticles. These organic residuals can be eliminated by calcination at a higher temperature than 200 ◦C [46].
The broad absorption band between 3250 and 3600 cm−1 was attributed to the stretching vibration of OH groups belonging to organic compounds and water, while the band at 1628 cm−1 corresponded to O–H bending modes of surface-bound water molecules. According to Vasconcelos et al. the signal at 1071 cm−1 can be attributed for ν(Ti–O–C) bridging vibrations of isopropoxy groups, which they observed at 1080 cm−1, which can be formed in the presence of carboxylate ligands [47]. The previously mentioned vibrations were detectable, only when TTIP was used as a precursor in the presence of EG. Organic acids are likely to form under the presented crystallization conditions (water/EG mixture, in the presence of air at 150 ◦C). For EG the major thermal oxidation products could be: oxalic, glycolic and formic acids. In the hierarchical crystals, these acids could be anchored on the surface of the oxide layer [48,49]. Interestingly, in TTIP Ccc 150 beside the vibrations at 1628 cm−1 and 3407 cm−1 [37], no evidence was found concerning surface contamination by organics. In TTIP F and I samples, the previously mentioned O–H band at 1628 cm−1 was also present as a shoulder to the signal provided by the stretching carbonyl bands around 1690-1740 cm−1 [50]. In this range, in both samples, TTIP Fcc 150 and TTIP Icc 150, were identified the above mentioned two bands are broader and more intense than in TBU samples.
In Fig. 14 it is clearly visible, that EG plays an important role in the formation of TiO2 crystals from TTIP, because at 1071 cm−1 ν(Ti–O–C) [47] and the characteristic vibrations for carboxylic acid were detected [45]. Interestingly, these species were found dominantly when TTIP was used in the crystallization. When EG (F and I samples) was applied during the synthesis, the mentioned species were located most probably captioning the newly formed TiO2 crystal germs which could be the reason for the formation of smaller particle size values and the organic contamination, which was irremovable by simple washing. The presence of EG in the solvothermal synthesis process induces significant changes in the crystal structure during the crystallization (crystal phase composition, mean crystallite size and morphology) but yielded remnant carbon species, which may inherently inhibit the catalytic performance. Therefore, the presence of the organic residues could be one of the main reasons causing the TTIP samples inactivity.
Since the TTIP Fcc 150 and TTIP Icc 150 samples were the most contaminated we checked their activity after a calcination procedure.
The heat treatment was under air flow in a tube furnace at 400 ◦C for 3 h.
After the heat treatment the crystal phase composition did not change.
Before the calcination these samples had shown only adsorption during the photocatalytic assessment, after the heat treatment TTIP Fcc reached
a 68% and TTIP Icc 150 36% conversion (Figure S5) in the same pho- tocatalytic experimental conditions. None of the samples reached higher activity than TBU Fcc 150.
3.5. XPS core level analysis
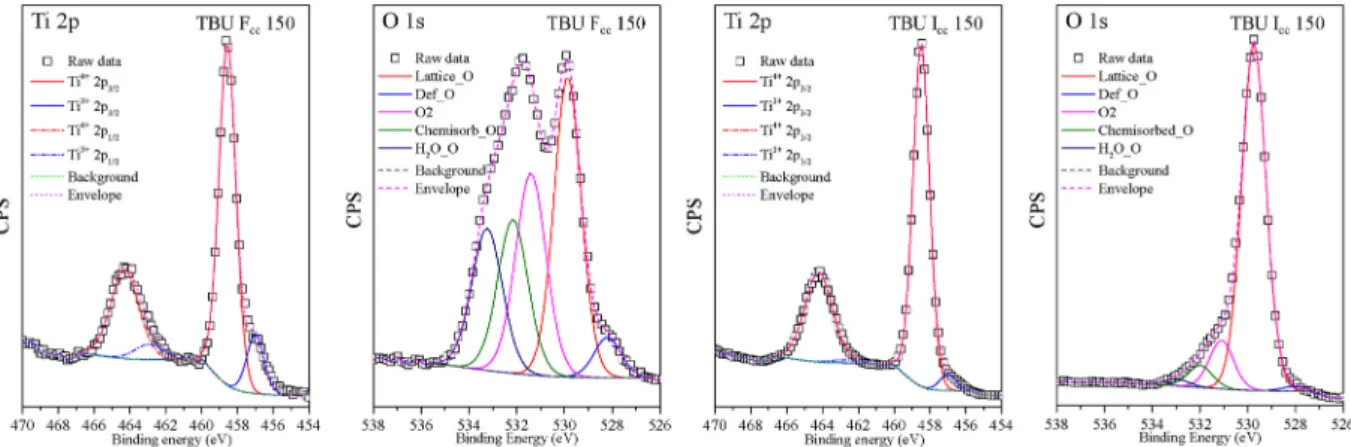
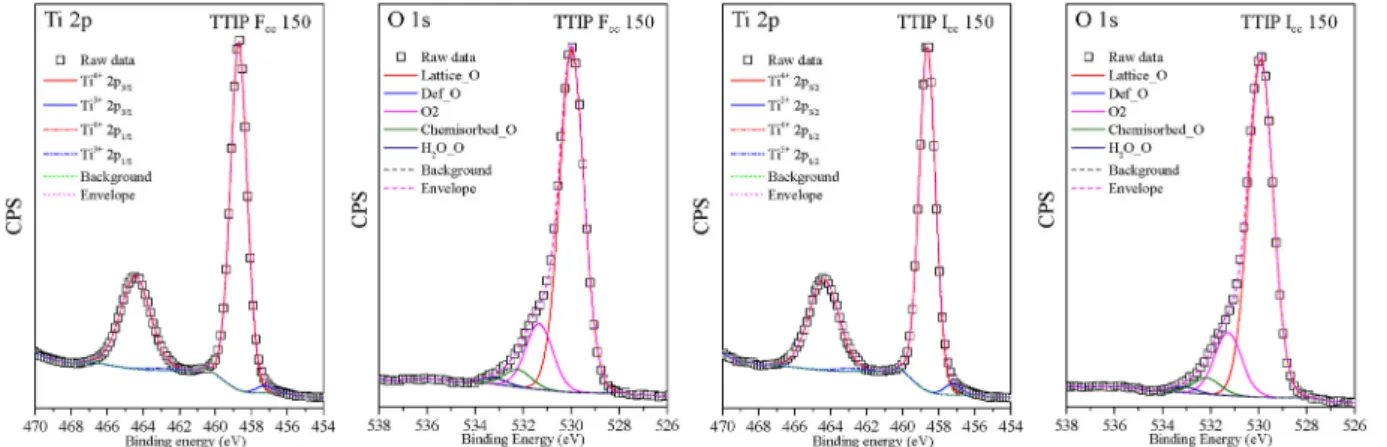
Figs. 15 and 16 show TBU Fcc 150, TBU Icc 150 (photoactive samples) and TTIP Fcc 150, TTIP Icc 150 (photoinactive samples) microstructures’
Ti 2p and O 1s core-level spectra. Each of the samples were dominated by Ti4+species at (~458.80 eV Ti4+2p1/2 and ~464.20 eV Ti4+2p3/2), while the presence of Ti3+was also detected at (~457,05 eV Ti3+2p1/2
and ~462.94 eV Ti3+2p3/2) [37,51]. The ratio between Ti4+and Ti3+ species differs among the samples. TBU Fcc 150 had the highest Ti3+ content (13.77%) while the other samples showed lower values: 4.53% - TBU Icc 150, 2.32% - TTIP Fcc 150 and 1.96% - TTIP Icc 150.
The O 1s spectra of the samples are presented in Figs. 15 and 16, where lattice oxygen peak can be found near to the value ~529.6 eV.
The asymmetry of the O 1s spectrum towards the higher binding en- ergies may result from the bulk oxide. The high energy tail located above (+1.6 eV–2.4 eV) the lattice oxygen, was attributed to the presence of subsurface low-coordinated ions (O−) or to surface anchored hydroxyl groups (531.4 eV) [52,53]. The lattice oxygen high energy tail can be deconvoluted in three peaks, where the peaks at 531.4 eV and 532.2 eV could be the sign of weakly adsorbed carbonate species or other carbon entities as well (C - O, C =O and acidic –COOH functional groups) [54].
However, the carbon contamination was seen also in the IR spectra of the samples (Fig. 14). The last peak at 533.2 eV is usually attributed to adsorbed water molecules on the oxide surface.
The two TBU samples’ O 1s spectra were asymmetrical and extended beyond the usual O 1s spectra region of the oxides, while the TTIP samples’ O 1s spectra were asymmetrical just towards higher binding energies. In both TBU samples, at ~528.2 eV, a so-called “pre-edge” peak was detected, which is more intense in TBU Fcc 150 than in TBU Icc 150. This signal can appear as a consequence of the presence of OH− or water molecules within the compound, also structural effects may cause such a signal [55–57]. The structural defects or local crystal lattice de- formations could be a good reason for the occurrence of 528.2 eV peak because the Ti3+presence was simultaneous with the pre-edge peak [58]. In sample TBU Fcc 150 the clearly distinguishable, 528.2 eV O pre-edge peak amount was ~4.50%, in TBU Icc 150 was ~1.0% and in the two other TTIP samples, it was absent.
It should be noted that the TTIP samples’ surface were found less contaminated than TBU samples, which was concluded from the ratio of the above-mentioned two peaks (531.4 eV and 532.2 eV) [54], while the IR results evidenced that the TTIP samples were more contaminated than TBU samples. This scientific contradiction was not yet investigated, although it could be considered that TBU samples were contaminated
Fig. 15.Photoactive TBU samples (TBU Fcc 150 and TBU Icc 150) Ti 2p and O 1s XPS deconvoluted spectra, presenting the Ti3+peak and the O pre-edge peak at 528.2 eV.
only on the surface while TTIP samples also in the bulk. However, the previous hypothesis needs further investigation. In the chosen TTIP samples the ratio between the same two peaks was (Fcc 150 - 3.81 and in Icc - 3.88), while in TBU samples (Fcc - 1.34 and in Icc - 2.20). This suggests the TBU samples are more likely contaminated on the surface, so the high carbon contamination in TBU samples on the surface could be the reason for the high adsorption affinity of SA [59].
Comparing the photocatalytic experiments’ results, the TBU samples presented the highest conversion rate in the decomposition of MO and SA. Besides the crystal phase the crystal defects, the presence of Ti3+ centers in high concentration can significantly enhance photocatalytic processes. These centers can react with dissolved O2 forming reactive radicals which are essential in the degradation of organic contaminants [60].
4. Conclusion
Hierarchical TiO2 structures can be prepared by using the hydro- thermal method. Independently from the precursor, the TiO2 growth was affected prominently by EG and the applied temperature: prevented the formation of brookite phase and promoted smaller particle size. The latter samples were exposed more likely to contaminations, particularly in F and I samples when EG was used. Therefore, the oxides prepared at 150 ◦C presented higher band gap and photocatalytic conversion rate of MO. Due to lack of Ti3+centers and the O pre-edge peak, TTIP anatase samples proved to be inactive that confirms photodegradation of MO and SA demands clean surface and the presence of crystal defects in TiO2.
These results demonstrate that even a subtle change in the prepa- ration phase could lead to divergent results in the semiconductors’ structure, affecting drastically its applicability. Among the catalysts enhanced performance was observed by the presence of Ti3+species and the rutile content beside the anatase. However, should be considered that carbon contamination causes inhibition for pure anatase samples.
Declaration of competing interest
The authors declare that they have no known competing financial interests or personal relationships that could have appeared to influence the work reported in this paper.
Acknowledgment
The authors wish to thank the financial support received from PN–III–P1-1.1-TE-2016-1588 and Zs.Pap wants to express his gratitude towards the Hungarian Academy of Sciences for providing the Bolyai J´anos Scholarship to support the research.
Appendix A. Supplementary data
Supplementary data to this article can be found online at https://doi.
org/10.1016/j.ceramint.2020.11.061.
References
[1] W. Lekphet, T.-C. Ke, C. Su, S. Kathirvel, P. Sireesha, S.B. Akula, W.-R. Li, Appl.
Surf. Sci. 382 (2016) 15–26, https://doi.org/10.1016/j.apsusc.2016.04.115.
[2] R. Boppella, A. Mohammadpour, S. Illa, S. Farsinezhad, P. Basak, K. Shankar, S.
V. Manorama, Acta Mater. 119 (2016) 92–103, https://doi.org/10.1016/j.
actamat.2016.08.004.
[3] X. Gao, Z. Wang, F. Fu, W. Li, Mater. Sci. Semicond. Process. 35 (2015) 197–206, https://doi.org/10.1016/j.mssp.2015.03.012.
[4] A. Arfaoui, S. Touihri, A. Mhamdi, A. Labidi, T. Manoubi, Appl. Surf. Sci. 357 (2015) 1089–1096, https://doi.org/10.1016/j.apsusc.2015.09.124.
[5] Y. Yang, J.X. Hu, Y. Liang, J.P. Zou, K. Xu, R.J. Hu, Z.D. Zou, Q. Yuan, Q.Q. Chen, Y. Lu, T. Yu, C.L. Yuan, J. Aalloy Compd. 694 (2017) 292–299, https://doi.org/
10.1016/j.jallcom.2016.09.328.
[6] X.L. Yongbo Chen, Zhijie Bi, Xiaoli He, Guanjie Li, Xiaoke Xu, Xiangdong Gao, Appl. Surf. Sci. 440 (2018) 217–221, https://doi.org/10.1016/j.
apsusc.2018.01.115.
[7] K. Vajda, K. Saszet, E.Z. Kedves, Z. K´asa, V. Danciu, L. Baia, K. Magyari, K. Hern´adi, G. Kov´acs, Z. Pap, Ceram. Int. 42 (2016) 3077–3087, https://doi.org/10.1016/j.
ceramint.2015.10.095.
[8] Z. Wu, Q. Wu, L. Du, C. Jiang, L. Piao, Particuology 15 (2014) 61–70, https://doi.
org/10.1016/j.partic.2013.04.003.
[9] S. Yao, X. Zhang, F. Qu, A. Umar, X. Wu, J. Aalloy Compd. 689 (2016) 570–574, https://doi.org/10.1016/j.jallcom.2016.08.025.
[10] A. Chithambararaj, N.S. Sanjini, A.C. Bose, S. Velmathi, Catal. Sci. Techno. 3 (2013) 1405, https://doi.org/10.1039/c3cy20764a.
[11] P. Re˜nones, A. Moya, F. Fresno, L. Collado, J.J. Vilatela, V.A. de la Pena O’Shea, ˜ J CO2 Util 15 (2016) 24–31, https://doi.org/10.1016/j.jcou.2016.04.002.
[12] Y. Ma, H. Jiang, X. Zhang, J. Xing, Y. Guan, Ceram. Int. 40 (2014) 16485–16493, https://doi.org/10.1016/j.ceramint.2014.07.158.
[13] L. Chen, D. Meng, X. Wu, J. Wang, Y. Wang, Y. Liang, Mater. Lett. 176 (2016) 143–146, https://doi.org/10.1016/j.matlet.2016.04.112.
[14] J. Gong, W. Zeng, H. Zhang, Mater. Lett. 154 (2015) 170–172, https://doi.org/
10.1016/j.matlet.2015.04.092.
[15] E. Çiftyürek, K. Sabolsky, E.M. Sabolsky, Sensor. Actuator. B Chem. 237 (2016) 262–274, https://doi.org/10.1016/j.snb.2016.06.071.
[16] Y. Yu, W. Zeng, Z. Zhang, Y. Cai, H. Zhang, Mater. Lett. 186 (2017) 119–122, https://doi.org/10.1016/j.matlet.2016.09.106.
[17] C. Wang, X. Li, C. Feng, Y. Sun, G. Lu, Sensor. Actuator. B Chem. 210 (2015) 75–81, https://doi.org/10.1016/j.snb.2014.12.020.
[18] X. Wang, Q. Meng, Y. Wang, H. Liang, Z. Bai, K. Wang, X. Lou, B. Cai, L. Yang, Appl. Energy 175 (2016) 488–494, https://doi.org/10.1016/j.
apenergy.2016.04.066.
[19] X. Du, X. He, L. Zhao, H. Chen, W. Li, W. Fang, W. Zhang, J. Wang, H. Chen, J. Power Sources 332 (2016) 1–7, https://doi.org/10.1016/j.
jpowsour.2016.09.103.
[20] E.S. Araújo, B.P. da Costa, R.A.P. Oliveira, J. Libardi, P.M. Faia, H.P. de Oliveira, J. Environ. Chem. Eng 4 (2016) 2820–2829, https://doi.org/10.1016/j.
jece.2016.05.021.
[21] Y. Zheng, J. Wang, P. Yang, J. Nanosci. Nanotechnol. 17 (2017) 1204–1209, https://doi.org/10.1166/jnn.2017.12639.
[22] L.W. Yulei Sui, Shengkui Zhong, Qingxia Liu, Appl. Surf. Sci. 480 (2019) 810–816, https://doi.org/10.1016/j.apsusc.2019.03.028.
[23] M.-V. Sofianou, M. Tassi, N. Boukos, S. Thanos, T. Vaimakis, J. Yu, C. Trapalis, Catal. Today 230 (2014) 125–130, https://doi.org/10.1016/j.cattod.2013.11.022.
Fig. 16. TTIP photoinactive samples (TTIP Fcc 150 and TTIP Icc 150) Ti 2p and O 1s XPS deconvoluted spectra, presenting a low amount of Ti3+- peak and the O pre- edge peak is missing.
[24] I. Sz´ekely, G. Kov´acs, L. Baia, V. Danciu, Z. Pap, Materials 9 (2016) 258, https://
doi.org/10.3390/ma9040258.
[25] T.H. Chiang, P.-Y. Ho, S.-Y. Chiu, A.-C. Chao, J. Aalloy Compd. 651 (2015) 106–113, https://doi.org/10.1016/j.jallcom.2015.08.091.
[26] A. Amy, J.F. Gribb, BANFIELD, Am Mineral 82 (1997) 717–728, https://doi.org/
10.2138/am-1997-7-809.
[27] J.F.B. Hengzhong Zhang, J. Phys. Chem. B 104 (2000) 3481–3487, https://doi.
org/10.1021/jp000499j.
[28] J.M.M. Sergio Valencia, Gloria Restrepo, Open Mater. Sci. J. 4 (2010) 9–14, https://doi.org/10.2174/1874088X01004010009.
[29] H.J. Kim, D.-S. Kim, H. Mun, J.G. Heo, H.M. Je, D.K. Roh, Ceram. Int. (2019), https://doi.org/10.1016/j.ceramint.2019.09.036.
[30] I.E. Fern´andez, J.E. Rodríguez- P´aez, J. Aalloy Compd. 780 (2019) 756–771, https://doi.org/10.1016/j.jallcom.2018.12.007.
[31] T.L.T. Oliver Diwald, Ed G. Goralski, Scott D. Walck, John T. Yates, Jr, J. Phys.
Chem. B, 108 52-57 https://doi.org/https://doi.org/10.1021/jp030529t.
[32] A. Di Paola, M. Bellardita, L. Palmisano, Catalysts 3 (2013) 36–73, https://doi.org/
10.3390/catal3010036.
[33] M.-V. Sofianou, M. Tassi, V. Psycharis, N. Boukos, S. Thanos, T. Vaimakis, J. Yu, C. Trapalis, Appl. Catal. B Environ. 162 (2015) 27–33, https://doi.org/10.1016/j.
apcatb.2014.05.049.
[34] M.K. Aulakh, N. Arora, A. Kumar, A. Ali, B. Pal, J. Nanosci. Nanotechnol. 17 (2017) 5303–5309, https://doi.org/10.1166/jnn.2017.13851.
[35] B. Sun, P.G. Smirniotis, Catal. Today 88 (2003) 49–59, https://doi.org/10.1016/j.
cattod.2003.08.006.
[36] L.K. Dhandole, M.A. Mahadik, S.G. Kim, H.S. Chung, Y.S. Seo, M. Cho, J.H. Ryu, J.
S. Jang, ACS Appl. Mater. Interfaces 9 (2017) 23602–23613, https://doi.org/
10.1021/acsami.7b02104.
[37] P. Wang, C. Jia, J. Li, P. Yang, J. Aalloy Compd. 780 (2019) 660–670, https://doi.
org/10.1016/j.jallcom.2018.11.398.
[38] J. Zhang, Q. Xu, Z. Feng, M. Li, C. Li, Angew Chem-Ger Edit 120 (2008) 1790–1793, https://doi.org/10.1002/ange.200704788.
[39] T. Chen, Y. Zheng, J.M. Lin, G. Chen, J. Am. Soc. Mass Spectrom. 19 (2008) 997–1003, https://doi.org/10.1016/j.jasms.2008.03.008.
[40] E.Z. Kedves, I. Szekely, L. Baia, M. Baia, A. Csavdari, Z. Pap, J. Nanosci.
Nanotechnol. 19 (2019) 356–365, https://doi.org/10.1166/jnn.2019.15792.
[41] X. Wang, S.O. Pehkonen, J. R¨amo, M. V¨ ¨a¨an¨anen, J.G. Highfield, K. Laasonen, Catal.
Sci. Techno. 2 (2012) 784, https://doi.org/10.1039/c2cy00486k.
[42] C.W. Lai, S. Bee Abd Hamid, T.L. Tan, W.H. Lee, J. Nanomater. (2015) 1–7, https://
doi.org/10.1155/2015/145360, 2015.
[43] O.Z.S.M. Ould-Mame, M. Bouchy, Int. J. Photoenergy 2 (2000), https://doi.org/
10.1155/S1110662X0000009X.
[44] M. Kassir, T. Roques-Carmes, K. Assaker, T. Hamieh, A. Razafitianamaharavo, J. Toufaily, F. Villi´eras, Physics Proc. 55 (2014) 403–408, https://doi.org/
10.1016/j.phpro.2014.07.058.
[45] D. Sun, J. Yang, X. Wang, Nanoscale 2 (2010) 287–292, https://doi.org/10.1039/
b9nr00158a.
[46] S.N.M. Navaneethan, R. Abinaya, S. Harish, J. Archana, L. Sudha, S. Ponnusamy, C. Muthamizhchelvan, H. Ikeda, Y. Hayakawa, Appl. Surf. Sci. 418 (2017) 186–193, https://doi.org/10.1016/j.apsusc.2016.12.019.
[47] D.C.L. Vasconcelos, V.C. Costa, E.H.M. Nunes, A.C.S. Sabioni, M. Gasparon, W.
L. Vasconcelos, Mater. Sci. Appl. 2 (2011) 1375–1382, https://doi.org/10.4236/
msa.2011.210186.
[48] Paul W. Brown, Walter J. Rossiter, Kevin G. Galuk, Sol. Energy Mater. 13 (1985) 197–202, https://doi.org/10.1016/0165-1633(86)90018-3.
[49] J. Walter J. Rossiter, McClure Godette, Paul W. Brown, Kevin G. Galuk, Sol. Energy Mater. 11 (1985) 455–467, https://doi.org/10.1016/0165-1633(85)90016-4.
[50] H. Wang, J. Lu, L. Liu, W. Cui, Y. Liang, Appl. Surf. Sci. 506 (2020) 144966, https://doi.org/10.1016/j.apsusc.2019.144966.
[51] T. Gyulav´ari, Z. Pap, G. Kov´acs, L. Baia, M. Todea, K. Hern´adi, G. Ver´eb, Catal.
Today 284 (2017) 129–136, https://doi.org/10.1016/j.cattod.2016.11.012.
[52] N. Kruse, S. Chenakin, Appl. Catal. A-Gen 391 (2011) 367–376, https://doi.org/
10.1016/j.apcata.2010.05.039.
[53] R.A.H. American MineralogistBedri Erdem, Gary W. Simmons, E. David Sudol, J. Am. Chem. Soc. 17 (2001) 2664–2669, https://doi.org/10.1021/la0015213.
[54] C. Wang, K. Yang, X. Wei, S. Ding, F. Tian, F. Li, Ceram. Int. 44 (2018) 22481–22488, https://doi.org/10.1016/j.ceramint.2018.09.017.
[55] B.L.P.A. van Aken, V.J. Styrsa, Phys. Chem. Miner. 25 (1998) 494–498, https://doi.
org/10.1007/s002690050140.
[56] N. Tsvetkov, Q. Lu, L. Sun, E.J. Crumlin, B. Yildiz, Nat. Mater. 15 (2016) 1010–1016, https://doi.org/10.1038/nmat4659.
[57] L.L. Yang, Q.X. Zhao, M. Willander, X.J. Liu, M. Fahlman, J.H. Yang, Appl. Surf.
Sci. 256 (2010) 3592–3597, https://doi.org/10.1016/j.apsusc.2009.12.160.
[58] G. Ver´eb, T. Gyulav´ari, Z. Pap, L. Baia, K. Mogyor´osi, A. Dombi, K. Hern´adi, RSC Adv. 5 (2015) 66636–66643, https://doi.org/10.1039/c5ra03719k.
[59] J. Lyu, L. Zhou, J. Shao, Z. Zhou, J. Gao, Y. Dong, Z. Wang, J. Li, Chem. Eng. J.
(2019) 123602, https://doi.org/10.1016/j.cej.2019.123602.
[60] K. Vajda, Z. Kasa, A. Dombi, Z. Nemeth, G. Kovacs, V. Danciu, T. Radu, C. Ghica, L. Baia, K. Hernadi, Z. Pap, Nanoscale 7 (2015) 5776–5786, https://doi.org/
10.1039/c4nr07157c.