Zolt ´an-Istv ´an Szab ´o1 R ´obert Ludmerczki2,3 B ´ela Fiser4,5
B ´ela Nosz ´al6 Gerg ˝o T ´oth6
1Department of Drugs Industry and Pharmaceutical
Management, Faculty of Pharmacy, University of Medicine and Pharmacy of Tˆırgu Mureș, Romania
2Department of Organic Chemistry, Semmelweis University, Budapest, Hungary
3Laboratorio di Scienza dei Materiali e Nanotecnologie, Dipartimento di Chimica e Farmacia, Universit `a di Sassari
4Computational Molecular Design Research Group, Institute of Chemistry, University of Miskolc, Miskolc, Hungary
5Ferenc R ´ak ´oczi II.
Transcarpathian Hungarian Institute, Beregsz ´asz, Transcarpathia, Ukraine
6Department of Pharmaceutical Chemistry, Semmelweis University, Budapest, Hungary
Received November 15, 2018 Revised February 11, 2019 Accepted February 11, 2019
Research Article
Chiral separation of rasagiline using sulfobutylether-  -cyclodextrin: capillary electrophoresis, NMR and molecular modeling study
Pressure-assisted stereospecific capillary electrophoresis method was developed for the determination of enantiomeric purity of the antiparkinsonian agent(R)-rasagiline. The optimized method, 50 mM glycine-HCl buffer pH 2, supplied with 30 mM sulfobutylether-
-cyclodextrin, at 35°C, applying 12 kV in reversed polarity, and –8 mbar pressure (vac- uum), short-end injection with -25 mbar×2 s, was successful for baseline separation of rasagiline enantiomers (Rs=3.5±0.1) in a short analysis time. The method was validated according to current guidelines and proved to be reliable, linear, precise and accurate for determination of 0.15%S-enantiomer as chiral impurity inR-rasagiline sample, as well as quantification of the eutomer. Method application was tested on a commercial tablet formulation. Determination of spatial structure of diastereomeric associates was based on1H and 2D ROESY NMR, indicating that the aromatic moiety of the molecule can enter the cyclodextrin cavity. NMR titration and molecular modeling revealed that S-rasagiline formed a more stable inclusion complex with sulfobutylether--cyclodextrin, than its antipode, which is in agreement with electrophoretic results.
Keywords:
AzilectR / Chiral separation / Cyclodextrin / Enantioseparation / Migration order DOI 10.1002/elps.201800482
1 Introduction
Rasagiline (RAS, chemically known as (R)-N-(prop-2-ynyl)- 2,3-dihydro-1H-inden-1-amine, Fig. 1, used as a mesylate salt) is an irreversible inhibitor of monoamine oxidase B, used for the treatment of the signs and symptoms of Parkinson’s disease [1]. RAS has a single asymmetric carbon, resulting in two optical isomers (R- andS-enantiomers). Only theR- enantiomer is active, therefore, the drug is marketed as a single enantiomeric agent, while theS-enantiomer could be present as a chiral impurity [2]. Determination of chiral purity of single enantiomeric agents is not only a necessity, but also
Correspondence: Dr. Gerg ˝o T ´oth, Department of Pharmaceuti- cal Chemistry, Semmelweis University, H-1092 Budapest, H ˝ogyes E. u. 9, Hungary
Fax:+36 12170891
E-mail: gergo.toth85@gmail.com;
toth.gergo@pharma.semmelweis-univ.hu
Abbreviations: 2D ROESY, two-dimensional phase-sensitive rotating frame nuclear Overhauser effect spectroscopy;CM, carboxy-methylated;DS, degree of substitution;EMO, enan- tiomer migration order;HP, hydroxypropyl;RAS, rasagiline;
SBE, sulfobutylether;TRIMEB, heptakis(2,3,6-tri-O-methyl)-- CD
a regulatory requirement. A literature survey revealed several direct liquid chromatographic methods for the chiral separa- tion of RAS enantiomers (Table 1) using polysaccharide [3,4], crown ether [5] or protein-based chiral stationary phases [6].
To the best of our knowledge, CE was yet to be applied for the chiral separation and subsequent enantiomeric quality control of RAS.
Although liquid chromatography is the predominant technique in chiral analysis, CE has also several advantages in this field, due to its low solvent and analyte consumption, high efficiency, and rapid analysis time. Moreover, the com- bination of CE with other techniques, especially NMR spec- troscopy and theoretical calculations can help gain insight into the spatial structure and stoichiometry of diastereomeric selector-selectand complexes and offer valuable information upon the chiral discrimination process [7–11]. The aim of the present study was to develop, optimize and validate a fast and cost-effective CE method for the enantiomeric qual- ity control ofR-RAS using CDs as chiral selector. Moreover
1H and two-dimensional phase-sensitive rotating frame nu- clear overhauser effect spectroscopy (2D ROESY) NMR as well as molecular modeling study were also applied for the characterization of non-covalent intermolecular interactions
Color online: See the article online to view Figs. 1–3, 5, and 6 in color.
C 2019 The Authors.Electrophoresispublished by WILEY-VCH Verlag GmbH & Co. KGaA, Weinheim. www.electrophoresis-journal.com
Figure 1. Constitutional formula and numbering of rasagilin.
of RAS-CD diastereomeric complexes and elucidation of the possible enantiorecognation mechanism.
2. Materials and methods
2.1 Materials
R- and S-RAS, DMSO, D2O, DCl, glycine, sulfated-- CD with degree of substitution (DS)11 and gradient grade methanol (MeOH) were purchased from Sigma- Aldrich (Budapest, Hungary).␣-,-,␥-CD, hydroxypropyl-
␣-CD (HP-␣-CD) DS4.5, HP--CD DS4.5, HP-␥-CD DS4.5, methyl-␣-CD DS11, methyl--CD DS12, methyl-
␥-CD DS13, heptakis(2,6-di-O-methyl)--CD content 95%, DS14, heptakis(2,3,6-tri-O-methyl)--CD, carboxy- methylated-␣-CD (CM-␣-CD) DS3.5, CM--CD DS4, CM-
␥-CD DS4 and sulfobutyl-ether--CD DS6.3 were prod- ucts of Cyclolab (Budapest, Hungary). Tris, HCl and NaOH were of analytical grade and purchased from commercial sup- pliers. The deionized water was prepared by a Milli-Q Direct 8 Millipore system. AzilectR 1 mg tablets (TEVA Pharma GmbH) were obtained from a local pharmacy in Budapest, Hungary.
2.2 CE measurements
CE experiments were performed on an Agilent 7100 CE instrument (Agilent Technologies, Waldbronn, Germany), equipped with a photodiode array detector and ChemSta- tion software for data handling. An untreated fused-silica
capillary (50µm id, 48.5 cm total and 40 cm effective length) from Agilent was used for the separation. Conditioning of new capillaries was conducted by flushing with 1 M NaOH for 30 min followed by 0.1 M NaOH and water for 60 min each. Prior to all runs the capillary was preconditioned by flushing with 0.1 M NaOH (2 min), water (1 min), and BGE (3 min). UV detection was performed at 200 nm. If not stated otherwise, injections were carried out by applying a pressure of 25 mbar for 3 s.
2.3 Preparation of BGE, stock, and sample solutions
For preliminary experiments 50 mM phosphate buffer ad- justed to pH 6 was used; the BGE contained CDs in various concentrations (3–30 mM), the applied voltage was 20 kV and the capillary was maintained at 25°C.
Application of the method was tested on a commercial tablet formulation (AzilectR). Twenty tablets were weighed and afterwards ground and mixed in a mortar. Then 10 mL MeOH was added to an accurately weighed portion of this powder equivalent to 10 mg of RAS. The sample was soni- cated for 30 min and then centrifuged for 10 min applying 4000 rpm (Sartorius 2–16P benchtop centrifuge, Goettin- gen, Germany). The clear supernatant was filtered through a 0.22 µm pore size syringe filter. An appropriate dilu- tion was made with water to obtain the final concentrations (100µg/mL). For the determination of chiral impurity, water was used as an extraction solvent, while the powder blend was weighed accurately as to obtain a theoretical concentration of 2666µg/mLR-RAS.
R- andS-RAS stock solutions were prepared in methanol at 1 mg/mL and were further diluted with water. The sam- ple solution used during the preliminary CD screening ex- periments contained approximately 150µg/mLR-RAS and 30µg/mLS-RAS. Other conditions including validation pro- cess are given in Results and Discussion section.
2.4 NMR experiments
All NMR measurements were carried out on an Agilent Varian Unity Inova DDR spectrometer (599.9 MHz for1H) with a 5 mm inverse-detection gradient probehead at 25°C.
Standard pulse sequences and processing routines available
Table 1.Direct liquid chromatographic methods for the chiral separation of RAS enantiomers
Stationary phase/Chiral selector Mobile phase Literature
Chiralcel OJ-H ((based on cellulose tris(4-methylbenzoate))
hexane:isopropyl alcohol:ethanol:diethyl amine (96:2:2:0.01))
[3]
Chiralpak AD-RH ((based on amylose tris(3,5-dimethylphenylcarbamate))
20 mM potassium dihydrogen phosphate in water-acetonitrile (65:35, v/v)
[4]
(+)-(18-crown-6)-2,3,11,12-tetracarboxylic acid ethanol/acetonitrile/acetic acid/triethylamine (80:20:0.2:0.3, v/v/v/v)
[5]
Chiralpak AGP (based on␣1-acid glycoprotein) ammonium acetate and isopropyl alcohol (90:10, v/v) [6]
in VnmrJ 2.2C/Chempack 4 were used. The molecular ge- ometry of the complex was investigated by two-dimensional phase-sensitive rotating frame nuclear Overhauser effect spectroscopy (2D ROESY). The structures of the inclusion complexes were determined applying a spinlock of 3 kHz for a mixing time of 300 ms.
The stability constants of RAS enantiomers were deter- mined by1H NMR titration in D2O. The pH was set at pH 2 using DCl. A stock solution containing 5 mM of both enan- tiomers was prepared separately, while the SBE--CD stock solution was 30 mM. 30µL of RAS stock solution was mixed with different volumes of SBE--CD stock solution and filled to a total volume of 600µL. The observed chemical shift (␦obs) of a given nucleus can be expressed using the following for- mula:
␦obs,=␦RAS
+⌬ ␦
[RAS]T+[CD]T+1 K−
[RAS]T+[CD]T+ 1 K
2
−4[RAS]T[CD]T 2[RAS]T
(1)
where⌬ ␦=␦RAS−CD−␦R AS
The total concentration of RAS enantiomers ([RAS]T) was constant during the titration.
Stability constants (K) of the inclusion complexes were calculated by non-linear parameter fitting of Eq. (1) to the␦obs
versus [CD]T datasets using OriginPro 8 program based on previous works [12–14].
2.5 Molecular modeling
In order to elucidate the atomic details of the enantiosepara- tion, the interaction of RAS enantiomers and SBE--CD was studied by using computational chemical tools. The model structures were built by using GaussView 5.0. As the actual configuration of SBE--CD is unknown (random substitution of the OH groups), three different isomeric forms were cre- ated to mimic the applied chiral selector based on the work of Jain et al. [15]. In each case, seven SBE groups were added to the-CD skeleton, as the degree of substitution was7 in the experimental system (Fig. 2). Furthermore, the SBE groups
were properly distributed on the-CD skeleton to represent the induced steric hindrance [15]. Energy minimization of the SBE--CD isomers were performed by using the optimized potentials for liquid simulations-AA forcefield in combination with the Generalized Born implicit solvation model. The resulted three optimized structures have been used as hosts in docking simulations. The RAS enantiomers were docked and their affinity towards the optimized SBE--CD isomers were studied by applying a “blind dock- ing” protocol [16] which was carried out by using AutoDock Vina [17]. The size of the grid box was set to be 40×40×40 ˚A which is much bigger than the actual size of the isomers (host molecules). The exhaustiveness and the maximum number of binding modes was set to 8 and 9, respectively. The best binding mode from each simulation was selected and the cor- responding structures and binding affinities were compared.
3 Results and discussion
3.1 CE method development
Sixteen different CDs were applied as potential chiral se- lectors in the scouting phase. Through the application of a high-number of different CD derivatives, the effect of differ- ences in the cavity size, nature of the substituents and charge upon enantiorecognition was also tracked. During the initial scouting phase, the chiral recognition ability of each selector was checked at five concentration levels (3-30 mM) at pH 6 in a 50 mM phosphate buffer. The capillary temperature was kept at 25°C and 20 kV voltage was applied. From the six- teen studied CDs eight CD derivatives (CM-␣-CD, CM--CD, CM-␥-CD, HP--CD, methyl--CD, DIMEB, sulfated--CD and SBE--CD) showed chiral interactions with the analyte, with SBE--CD at 30 mM delivering the most promising re- sults. Higher concentration of chiral selector resulted in bet- ter enantioseparation, however concentration above 30 mM could not be applied because of the high current generated.
In all cases the migration order was not the ideal one, because the eutomerR-RAS was migrating first, followed by theS-enantiomer. For further method development our aim
Figure 2. 2D structures of sulfobutylether--cyclodextrin isomers, where R=sulfobutylether group.
was to reverse the enantiomer migration order (EMO), while still maintaining baseline separation.
One of the main advantages of CE enantioseparation is the ease of reversing EMO, when compared to chromato- graphic methods. In our recent study, we have successfully reversed the enantiomer migration order for praziquantel, by polarity switching and EOF reduction at strongly acidic BGE [18]. The same simple approach was employed in this study also, together with reduction of the effective length of the sep- aration capillary to 8.5 cm, by employing short-end injection technique. Using 50 mM phosphate buffer pH 2.0, supple- mented with 30 mM SBE--CD at 25°C, hydrodynamic injec- tion at the near-detector-end of the capillary (-25 mbar x 3 sec), and applying 15 kV (reversed polarity), the EMO was reversed and the ideal situation, when the distomer,S-RAS was the first migrating enantiomer, followed by theR-RAS was obtained.
Further, method optimization was undertaken to im- prove peak shape and further reduce analysis time. Higher concentrations than 30 mM of the ionized SBE--CD and/or 50 mM phosphate buffer could not be utilized, because of the high currents generated. In the following, several vari- ations of voltage and temperature were employed to further optimize the method, but still maintain currents below100- 110µA. Best results were obtained at a higher capillary tem- perature (35°C), which implied lowering the voltage to 12 kV.
However, using these conditions, the total analysis time was still longer than 17 minutes and peak shapes and efficiencies were still not ideal. In order to overcome these shortcomings, vacuum was applied to the outlet vial. This pressure-assisted approach lead to better peak shapes, overall higher efficien- cies and reduced analysis time, but also decreasedRsvalues
Figure 3. Effect of applied pressure on the enantioseparation of.RAS enantiomers. (A) 0 mbar; (B) -5 mbar*; (C) -7 mbar*; (D) -8 mbar*; (E) -10 mbar*; (F) -15 mbar*. Other experimental con- ditions: BGE: 50 mM phosphate buffer pH 2.0, 30 mM SBE--CD;
temperature: 35°C; 25 mbar x 2 sec hydrodynamic injection at the short-end of the capillary; applied voltage: 12 kV (reversed polar- ity, cathode at inlet). *Negative pressure indicates that vacuum was applied at the end of the capillary, in order to pull the sample plug through the detector.
(Fig. 3). A good compromise between reduced analysis time, but still sufficient enantioselectivity was obtained by applying -8 mbar pressure. As a last step, the influence of changing the BGE buffer system was investigated. Phosphate buffer, Tris-HCl and glycine-HCl all in a 50 mM concentration at pH 2.0 were employed as BGE constituents. No difference in migration times were recorded, however peak shapes were better using glycine-HCl buffer. Using these optimized con- ditions (50 mM glycine-HCl buffer pH 2.0, 30 mM SBE--CD (DS 6.3), capillary temperature: 35°C, applied voltage 12 kV (reversed polarity) and – 8 mbar pressure, short-end injection with -25 mbar×2 sec) high resolution (Rs=3.5±0.1) was achieved within 8 min. Therefore, further method optimiza- tion was not applied.
3.2 Method validation
Our developed method was validated for the determination of S-RAS as a potential optical impurity inR-RAS sample and for quantification ofR-RAS following the International Council on Harmonization (ICH) guidelines in terms of sensitivity (LOD, LOQ), linearity, precision and accuracy.
3.2.1 Method validation for the determination of S-RAS as a potential optical impurity
Method sensitivity was evaluated for the determination of S-RAS, by sequentially diluting sample solutions. The LOD of S-RAS was determined as the concentration yielding a signal three times the baseline noise while LOQ was deter- mined at 10:1 signal to noise ratio in the presence of R- RAS solution. The LOQ was determined at 4 µg/mL (cor- responding 0.15% impurity in 2666µg/mLR-RAS sample), while LOD ofS-RAS was 2µg/mL (corresponding 0.075%
impurity in 2666µg/mL R-RAS sample). Calibration curve was constructed at six different concentration levels be- tween 4 and 48µg/mL corresponding to 0.15%-1.8% enan- tiomeric impurity in 2666µg/mL R-RAS solution. Regres- sion analysis shows a linear relationship in the above men- tioned concentration ranges with the following equations: y
=1.1809x+0.2919 (r2=0.9994). Accuracy (calculated as re- covery%) and precision (repeatability based on RSD% of the migration time and peak area) were analyzed by performing intra-and interday evaluation of three concentration levels 4, 16 and 40µg/mL forS-RAS in the presence ofR-RAS. In the intraday repeatability study, the RSD% of migration time was lower than 0.5%, In the interday repeatability (measured in two consecutive days) the RSD% of migration time was lower than 1.5%. The accuracy data and RSD% of peak areas are summarized in Table 2.
3.2.2 Method validation for quantification ofR-RAS Our method was also validated and applied for quantifica- tion ofR-RAS. In this case calibration curve was constructed
Table 2.The accuracy data and RSD% of peak areas ofS-RAS as a potential optical impurity in presence ofR-RAS
S-RAS concentration in 2666µg/mLR-RAS Precision (RSD%) Accuracy (%)
Intraday Interday Intraday Interday
4µg/mL (0.15%) 3.1 4.5 96.1 96.3
16µg/mL (0.6%) 1.2 1.6 101.5 99.7
40µg/mL (1.5%) 4.1 2.3 99.8 102.3
Table 3.The accuracy data and RSD% of peak areas ofR-RAS
R-RAS concentration Precision (RSD%) Accuracy (%) Intraday Interday Intraday Interday
80µg/mL 3.5 3.9 99.8 97.7
100µg/mL 0.5 1.1 100.9 101.1
120µg/mL 1.3 2.3 97.8 99.9
between 80 and 120µg/mL ofR-RAS. The results indicate a linear relationship with the following regression equation:
y= 1.472x + 0.0964 (r2 = 0.9996). Like the validation of determination of potential chiral impurity, the accuracy and precision of the method was tested. Quality control samples were prepared at concentration of 80, 100 and 120µg/mL for R-RAS. The RSD% of migration time was lower than 0.2%
and 0.9% in the case of intra- and interday repeatability, re- spectively. Further results regarding accuracy and precision are summarized in Table 3.
3.3 Application of the method
Our optimized and validated method was applied for the assay and enantiomeric quality control ofR-RAS in AzilectR tablets (containing 1 mgR-RAS in mesylate salt form). In the ana- lyzed samples, no chiral impurity could be detected, however after spiking the sample with the distomer to achieve 0.15%
chiral impurity,S-RAS could be determined (Fig. 4). More- over, during the assay ofR-RAS, a good agreement between the value claimed by the manufacturer and that determined by our method (1.03± 0.03 mg/tablet) was obtained. The real sample analysis further underlines the applicability of our method.
3.4 NMR and molecular modeling for characterization of enantioselective complexation
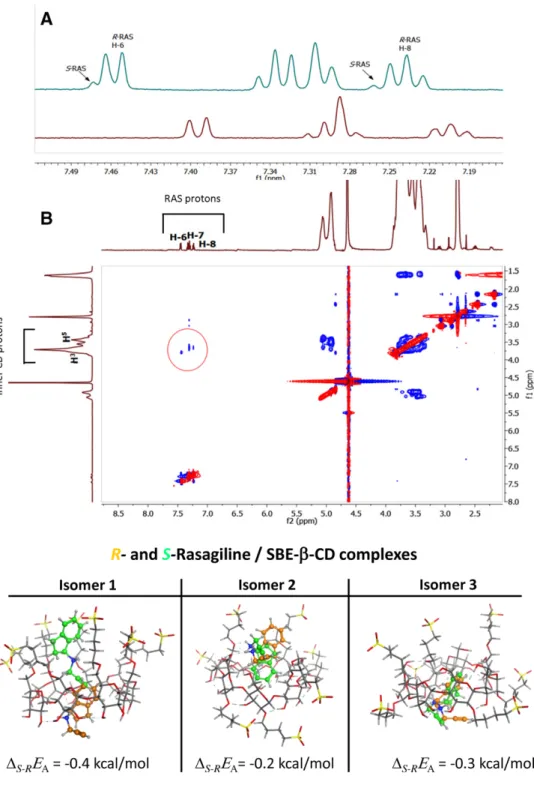
At first in the 1H NMR measurements, spectrums were recorded using a solution containing 3 mM sample with 7:1R:Senantiomeric ratio, with increasing concentrations of SBE--CD (0, 5, 15, 20,30 mM) to check a possible enantioselective differences. In the 1H NMR spectra the complexation-induced chemical shift is clearly indicative of selector-selectand complexation, moreover some minor
Figure 4. Electropherogram of a solution of AzilectRtablets con- taining 2666µg/mLR-RAS spiked with 0.15%S-RAS chiral impu- rity. Conditions: BGE: 50 mM glycine-HCl buffer pH 2.0, 30 mM SBE--CD; temperature: 35°C; 25 mbar x 2 sec hydrodynamic in- jection at the short-end of the capillary; applied voltage: 12 kV (reversed polarity, cathode at inlet).
signal splitting was also observed due to nonequivalence of complexation induced chemical shifts of enantiomers in the aromatic region applying higher selector concentration (⬎15 mM) (Fig. 5A). The chemical shift differences forS-RAS were higher thanR-RAS, indicating that theS-enantiomer formed more stable complex with SBE--CD. To determine the exact stability constant1H NMR titration was applied. The stability constant forR-RAS andS-RAS SBE--CD were 2.18
±0.02 and 2.35±0.01, respectively. These data are in good accordance with the observed EMO in CE measurements.
2D ROESY NMR measurement was applied for determi- nation of spatial structure of the RAS enantiomer- SBE--CD complexes. Crosspeaks between RAS aromatic protons and inner H3 and H5 protons of the CD clearly show that the phenyl ring can enter the CD cavity. Based on ROESY exper- iments enantiomer specific complexation was not observed (Fig. 5B).
Docking simulation was used to aid in the understanding of the mechanism of the separation. The tridimensional structures of the diastereomeric complexes between RAS enantiomers and three different SBE--CD isomers are presented in Fig. 5, together with the calculated relative binding affinities of complex formation. Results of the
Figure 5. (A) The aromatic part of 1H NMR spectrum ofR-enantiomer-enriched RAS (3 mM sample with 7:1 R:S enantiomeric ratio) without SBE--CD (down) and with 30 mM SBE--CD (top). (B) 2D ROESY spectrum of a sample containing 3 mM SBE--CD, 2.5 mM R-RAS and 1.5 mM S-RAS, showing ROE cross- peaks between the aromatic protons (H-6, H-7 and H-8) of RAS with inner H3and H5pro- tons of SBE--CD.
Figure 6. 3D structures of the diastereomeric complexes between RAS enantiomers and SBE--CD isomers to- gether with the calculated rela- tive binding affinities (⌬S-REA, kcal/mol). ⌬S-REA = EA(S) – EA(R), whereEA(S) andEA(R) are the binding affinity of the complex formed with S-RAS and R-RAS enantiomers, re- sepectively.S-RAS andR-RAS indicated with light green and orange color.
molecular modeling study are in line with experimental observations: a more stable complex was formed between the chiral selector, SBE--CD andS-RAS, causing the later to reach the detector faster in the reversed polarity setup, than R-RAS. The study also confirmed the preferential inclusion of the aromatic part of the analyte in the cavity of the CD, the N-propargyl side-chain of RAS points outside of the cavity. In the case ofR-RAS this positively charged side-chain points towards the apolar side-chain of the sulfobutyl group, whereas for S-RAS, the N-propargyl group points
away. Energetically, the latter case is more favorable. We hypothesize that the electrostatic interactions between the negatively charged CD and the positively charged analyte are primary responsible for anchoring the enantiomers (leading interactions) and bringing the asymmetric moieties of the se- lector and selectand in close proximity [19, 20]. Enantiomeric discrimination most probably occurs afterwards, when the differences in secondary interactions, give rise to a more stable complex for S-RAS. Based on molecular modeling study it is evident, that S-RAS established more secondary
interactions (H-bonding, -NH—O-; and ⌸-interactions) with the SBE--CD isomers in each case, than its R-RAS counterpart (Fig. 6).
4 Concluding remarks
A novel, rapid enantioselective pressure-assisted CE method using SBE--CD as chiral selector has been established for the determination of enantiomeric purity of RAS for the first time. Applying the optimized conditions 50 mM glycine-HCl buffer pH 2.0, supplied with 30 mM SBE--cyclodextrin, at 35°C, applying 12 kV in reversed polarity, and –8 mbar pressure (vacuum), short-end injection with -25 mbar×2 s, baseline separation of RAS enantiomers was achieved within 8 min. Our optimized and validated method can be success- fully applied for the quality control ofR-RAS. Using NMR and molecular modeling the SBE--CD RAS inclusion complex- ation was characterized. Different binding affinities of the individual enantiomers towards SBE--CD were identified with both NMR and molecular modeling, in favor of theS- enantiomer, which are in accordance with the observed EMO.
We assume that the secondary interactions with smaller en- ergies could play a bigger role in the enantiomer recognition mechanism. In our work we proved that by combined use of CE, nuclear magnetic resonance spectroscopy and molecular modeling calculations can help to gain deeper understanding of the chiral recognition mechanism of CD chiral selectors.
The financial support from New National Excellence Pro- gram of the Ministry of Human Capacity ( ´UNKP-17-4) and Semmelweis Innovation Found (STIA-M-17, STIA-18-KF) is highly appreciated. The GITDA (Governmental Information- Technology Development Agency, Hungary) is gratefully acknowl- edged for allocating computing resources used in this work. BF thanks the support from the EU, Hungary and the European Re- gional Development Fund within the framework of the GINOP- 2.3.4-15-2016-00004 project. Z.-I.Sz. and G.T. would like to thank the Transylvanian Museum Society for their support.
The authors have declared no conflict of interest.
5 References
[1] Lecht, S., Haroutiunian, S., Hoffman, A., Lazarovici, P., Ther. Clin. Risk Manag.2007,3, 467–474.
[2] Sterling, J., Veinberg, A., Lerner, D., Goldenberg, W., Levy, R., Youdim, M., Finberg, J., MAO—The Mother of all Amine Oxidases, Springer, Wien 1998, 301–
305.
[3] Sunil Reddy, P., Sudhakar Babu, K., Kumar, N.,Chirality 2013,25, 324–327.
[4] Nirogi, R., Doguparthi, M. R., Lingavarapu, B., Thota, K.
R., Yarra, N. S.,Asian J. Chem.2015,27.
[5] Tak, K. M., Park, E. J., Hyun, M. H.,J. Sep. Sci.2013,36, 3682–3687.
[6] Balaji, N., Sultana, S.,Sci. Pharm.2017,85, 26.
[7] Salgado, A., Chankvetadze, B.,J. Chrom. A2016,1467, 95–144.
[8] Szab ´o, Z.-I., T ´oth, G., V ¨olgyi, G., Komj ´ati, B., Hancu, G., Szente, L., Sohajda, T., B ´eni, S., Muntean, D.-L., Nosz ´al, B., J. Pharm. Biomed. Anal. 2016, 117, 398–
404.
[9] Gogolashvili, A., Tatunashvili, E., Chankve- tadze, L., Sohajda, T., Szeman, J., Salgado, A., Chankvetadze, B., Electrophoresis 2017, 38, 1851–
1859.
[10] Gogolashvili, A., Tatunashvili, E., Chankvetadze, L., So- hajda, T., Szeman, J., Gumustas, M., Ozkan, S. A., Sal- gado, A., Chankvetadze, B., J. Chrom. A 2018, 1571, 231–239.
[11] Salgado, A., Tatunashvili, E., Gogolashvili, A., Chankve- tadze, B., Gago, F.,Phys. Chem. Chem. Phys.2017,19, 27935–27939.
[12] Orgov ´an, G., Kelemen, H., Nosz ´al, B.,J. Incl. Phenom.
Macro.2016,84, 189–196.
[13] Szab ´o, Z. I., Mohammadhassan, F., Sz ˝ocs, L., Nagy, J., Komj ´ati, B., Nosz ´al, B., T ´oth, G.,J. Incl. Phenom. Macro.
2016,85, 227–236.
[14] Szab ´o, Z. I., Deme, R., Mucsi, Z., Rusu, A., Mare, A. D., Fiser, B., Toma, F., Sipos, E., T ´oth, G.,J. Mol. Struct.2018, 1166, 228–236.
[15] Jain, A. S., Date, A. A., Pissurlenkar, R. R., Coutinho, E.
C., Nagarsenker, M. S.,AAPS PharmSciTech, 2011,12, 1163–1175.
[16] Het ´enyi, C., van der Spoel, D., Protein Sci. 2002, 11, 1729–1737.
[17] Trott, O., Olson, A. J., J. Comput. Chem. 2010, 31, 455–461.
[18] Szab ´o, Z. I., G ´al, R., Sz ˝ocs, L., Ludmerczki, R., Muntean, D. L., Nosz ´al, B., T ´oth, G., Electrophoresis 2017, 38, 1886–1894.
[19] Feibush, B.,Chirality1998,10, 382–395.
[20] L ¨ammerhofer, M., J. Chrom. A 2010, 1217, 814–
856.