Chapter III
SPECTROSCOPIC EQUIPMENT.
PREPARATION OF STANDARD MIXTURES
7. THE VACUUM UNIT
Spectral analysis of gases generally requires the availability of a vacuum unit. The latter, besides allowing the introduction of the sample into the discharge tube, s e r v e s a variety of purposes such as evacuation of the discharge tube and of the entire system, preparation of standard mixtures, p r e s s u r e control, e t c
A vacuum unit (see Fig. 16) is best suspended on a metal rack.
The auxiliary equipment, that i s , cylinders with pure gases or standard mixtures, is also suspended. After having been welded together, the unit must be thoroughly degassed by heating all connector tubes with the smoky flame of a gas burner. Quartz discharge tubes can be brought to red heat. Benzene, water and stopcock grease vapors interfere with the analysis, and especially with the hydrogen determination since they decompose in the d i s - charge, liberating hydrogen. Therefore, the greasing of stopcocks must be followed by prolonged evacuation of the system. When stopcocks already in use develop a leak and must be resealed, the
57
13
FIG. 16. A vacuum system for spectral analysis of gases.
1—Forechamber; 2—diffusion pump; 3-8—stopcocks; 9—.gas cylinders; 10—McLeod gage; 11—auxiliary (surge) vessel; 12—
discharge tube; 13—forepump.
The system and discharge tube must be evacuated down to p r e s s u r e s of the order of 10 5 m m Hg. Work with extremely low concentrations, as well as microanalysis, requires even lower p r e s s u r e s , which are achieved with rotary oil pumps and metal or glass diffusion pumps (mercury or oil vapor).*
Before an oil vapor pump can be used, the discharge tube must be evacuated directly by means of a rotary pump. During this step atmospheric air enters the tube at the forevacuum p r e s s u r e . Then the oil vapor pump removes mercury vapor whose presence reduces considerably the sensitivity of the analysis for the dif- ficult-to-excite components of the mixture (the vapor p r e s s u r e of mercury at room temperature is about 2 · 10 3 m m Hg, and that of
•See general handbooks on vacuum techniques [276-283].
best thing is to deposit a new coat of grease over the old one without washing the old grease with ether or benzene. One thus obviates a time-consuming reevacuation of the system.
THE VACUUM UNIT 59 oil, 5 · 1 0 -7π ι π ι Hg). When working with a m e r c u r y diffusion pump it is often necessary to freeze out the m e r c u r y vapor by means
of intermediate traps cooled with Dry Ice ( - 7 9 ° C ) . Liquid nitro- gen should not be used because it reduces the temperature to a level at which gases (especially heavy inert gases) are strongly adsorbed by the glass of the system. When this happens, the composition of the sample in the discharge tube changes with time. Freezing out with Dry Ice is adequate because at this t e m - perature mercury has a vapor p r e s s u r e of 10~7 m m Hg. If Dry Ice is undesirable for s o m e reason, traps filled with metallic potassium or sodium can be used if the sample contains only inert gases [277].
A short-type precalibrated [284] McLeod gage with two or three capillaries [277] is used to m e a s u r e sample p r e s s u r e s . It is useful in the range from 10"4 to a few m m Hg. P r e s s u r e s above 5 - 6 m m Hg are measured with a U-shaped m e r c u r y - or oil-filled manometer.
The possibility of introducing e r r o r s into the measurement should be considered when using a McLeod gage to measure the p r e s - sures of gases (carbon dioxide or steam (near their liquefaction points [285].
The accuracy of pressure measurements with a mercury m a n o m - eter depends on the accuracy of reading of the m e r c u r y level.
Various optical arrangements have been devised to facilitate the reading of the capillary scale. Simple interference methods for accurate and rapid reading of the m e r c u r y level in the capillary were described by Terrien [286].
Ionization or resistivity (Pirani) vacuum gages are seldom used in gas analysis since they must be recalibrated whenever the c o m - position of the gas mixture is changed. However, a method for measuring the p r e s s u r e s of different gases with the s a m e Pirani gage was suggested by Veis [287].
Moderate and high vacuum measurements can also be made with capacitive diaphragm gages whose readings do not depend on the type of gas used. The theory, design and measurement p r o - cedure used with these gages have been described by Drawin [288].
This gage is especially suitable for industrial applications.
The pressure existing in the vacuum system can be roughly estimated from the color of the discharge produced in the connecting tubing or in a spark gap fed by a T e s l a transformer. Thus, the air glow changes from reddish-pink to sky-blue as the p r e s s u r e d e - c r e a s e s . The glow ceases at very low pressures (~10 3 m m Hg).
The Tesla apparatus also allows detection of leaks in a vacuum unit.
Particular attention should be given to the vacuum stopcocks.
All of these must be prechecked for leaks, keeping in mind that a stopcock may pass not only the atmospheric a i r , but also gases from the adjacent compartments of the unit. To test for leaks in, for example, the system of Fig. 1 6 , gas is admitted from cylinders through stopcocks 3 and 4; stopcock 4 is kept closed while stop- cock 3 is open. The gas from the cylinder now fills the space between stopcocks 3 and 4. Stopcock 3 is then closed and stopcock 4 is opened s o that the gas from space 3 and 4 fills the space to stopcock 7, which must be closed. Batch-metering stopcocks (Fig. 17) are best for measuring the amount of gas. These differ from standard vacuum stopcocks only in the design of the plug.
The latter is sealed at the bottom, and the pocket replacing the lateral opening has a capacity which varies from one m m3 to several c m3.
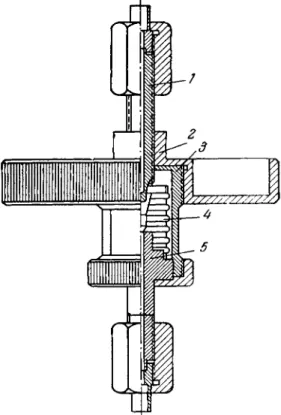
Mirtov and Boykov [289] designed an electrically operated stopcock for convenient and precise metering of gases. The d e - vice is capable of good performance over a wide range. The stopcock, or valve, is shown schematically in Fig. 1 8 . The basic component of the valve is a capillary with a short porcelain tip 1
THE VACUUM UNIT 61
To system
FIG. 17. Batch-metering stop- cock with pocket.
fused to it at one end. The capillary con- nects the two valve chambers which are separated by a partition. The upper chamber connects to the gas cylinder, the lower to the system. A cap 29 con- taining an iron core 3, is located in the upper section of the valve. The upper and lower chambers are filled with pure m e r c u r y 4. Should air at a t m o s - pheric pressure penetrate into the s y s - tem, the mercury in the lower chamber will seal the capillary. The valve o p e r - ates in the following manner: in its n o r - m a l position, cap 2 dips into the upper m e r c u r y pool which r i s e s to level hx and covers the porcelain tip. T o let a measured quantity of gas into the s y s - tem, the solenoid 5 is switched on.
This lifts the cap, the mercury level drops to h2, exposing the porcelain tip.
The gas then diffuses through the tip into the capillary and then bubbles through the mercury into the system.*
The rate of diffusion can be con-
trolled by using porcelains of varying porosity. In a precalibrated valve the gas can easily be metered on the basis of time of flow.
The valve requires no lubricant of any kind and the m e r c u r y vapor is easily frozen out. However, if the valve is used to meter a multi- component gas mixture it is essential to check whether the ratio
To system
FIG. 18. Electrically controlled batch-metering stopcock sys-
tem.
•Holes 6 in the cap permit the gas to escape from the space underneath the cap when the solenoid is switched on.
of components is preserved (the diffusion rates of the gaseous constituents may differ because of difference in molecular weight).
A simplified vacuum system such as the one shown in Fig. 19 is most suitable for gas analysis under industrial conditions (see Section 26).
A continuous gas stream is drawn through discharge capillary 1 by means of a conventional forepump 10. The gas p r e s s u r e is measured by means of a U-type mercury manometer 2 . The gas flow rate is adjusted with the aid of vacuum stopcocks 3 and 7.
Stopcock 4 seals off the manometer from the system, if needed. The e x c e s s gas is vented to the atmosphere through vent 6.
Pressure and gas flow rate through the discharge tube can be controlled by a set of parallel capillaries located upstream and downstream from the discharge tube. Such a system is used for determination of isotopes of hydrogen. Capillary internal diameters are chosen on the basis of the desired flow rate and operating p r e s s u r e . A unit for the calibration of capillaries is described in
2
FIG. 19. Simplified vacuum system. 1—Discharge tube capillary; 2—mercury manometer; 3, 4, 7—
vacuum-type stopcocks; 5—trap filled with copper shavings; 6—gas vent; 8—collimator; 9—filter; 10—
forepump; 11—microammeter.
THE VACUUM UNIT 63 [290]· The usual flow rate in the isotopic analysis of hydrogen ranges from 0.1 to 1.0 c m3/ m i n at capillary bores ranging from 0 . 0 0 5 - 0 . 0 2 c m . The capillaries are bypassed when evacuating the system.
The use of gas-leak valves in place of vacuum stopcocks p r o - vides a m o r e convenient means for setting up a continuous gas flow [291]. One valve of such type, a bellows-operated control valve, was described by Astrov and VoroneP [292] and permits regulation of the gas flow over a range of pressures up to 150 atm.
Its principal component is a stainless steel stem J (Fig. 20) carrying the actual working disc. The latter consists of a conical section which s e r v e s to cut off flow, and a 3 . 5 m m long, 2 m m I.D.
FIG. 20. Sylphon control valve.
8. DISCHARGE TUBES
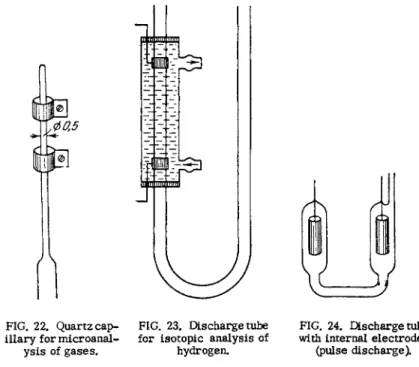
A gas mixture is excited to glow in discharge tubes whose design varies with the specific objective of analysis. Several types of discharge tube used in spectroscopic gas deter- minations are shown in Figs. 2 1 - 2 5 .
When the excitation source is an r - f o s c i l - lator, a fused quartz tube with external e l e c - trodes (Fig. 21) is generally used. The external electrodes are strips of tinfoil, which may or may not touch the quartz and are connected to the output terminals of the r-f oscillator. The quartz tube is welded to the remainder of the system via a graded quartz-glass seal, or it may be cemented in.* In the latter case the quartz tubing connecting to the system must be at
^ rti A, J least 25 cm long, to prevent the discharge from
FIG. 21. A fused quartz & ^ &
tube with variable touching the cemented junction and producing cross section.
*In some cases polyethylene tubing can be used to connect the quartz tube and the glass system.
cylinder below it. The cylinder tapers to a truncated cone (angle of taper: 6 0 ° ) , and fits with a small clearance into the valve seat 5. The seat—cylinder combination is the actual control element.
The stem is coupled to a stainless steel bellows 4 located in valve body 3, and is moved by means of handle 2 carrying a double thread (pitch differential—0.25 m m ) . This valve permits close regulation of the gas flow in the range of 0.03 to 3 c m3 (STP)/min, at a valve pressure drop of up to 150 atm and a control accuracy of 0 . 1 - 0 . 2 c m3/ m i n . Other types of valves can also be used to regulate the gas flow.
DISCHARGE TUBES 65
FIG. 22. Quartz cap- FIG. 23. Discharge tube FIG. 24. Discharge tube illary for microanal- for isotopic analysis of with internal electrodes
ysis of gases. hydrogen. (pulse discharge).
The discharge tube shown in Fig. 23 is used for isotopic anal- ysis of hydrogen. The capillary is enclosed in a jacket cooled by running water.
When pulse discharge is used, the tube is made of molybdenum glass (Fig. 24). The narrow section is about 15 m m in diameter.
The cylindrical electrodes are made of nickel sheet and are fused to the inside of the tube.
vapors from the cement which may then drift into the discharge tube. The diameter of the working part of the tube varies from about 10 m m to about 0.5 m m . This arrangement permits analysis of s m a l l quantities of components of gas mixtures, with the readily excited gases analyzed in the larger section and the difficult-to-excite components in the narrower section. When working with microquantities of gas, the sealed end of a 0.5 m m capillary about 10 cm long will provide a suitable discharge tube (Figo 22).
Another type of discharge tube useful for gas mixture analysis is that with a hollow cathode (Fig. 2 5 ) .
In some special c a s e s such a s , for example, the analysis of gases for vacuum tubes in electronic industry, the discharge tube may consist of the actual device (i.e., the vacuum tube) [293, 2 9 4 ] .
Discharge tubes of diverse designs adapted for various analyti- cal tasks are described in greater detail in Chapter V , which deals with specific techniques of gas mixture analysis.
Spectroscopic determinations of gas mixtures require the use of standard samples. The standard may be either an already available mixture or a mixture especially prepared from pure components. The minor components of an already available gas mixture are determined by the method of additions (see Section 17).
Such mixtures provide particularly convenient standards for rapid gas stream analyses in industry, as well as for analyzing multi- component gas mixtures.
The simplest vacuum system for preparing standard gas m i x - tures is shown in Fig. 2 6 . Gas cylinders A and Β are each connected
*> P i
b)FIG. 25. Hollow cathode tubes: a) high-frequency hollow cathode; b) Frisch's all-purpose tube. (Arrows
indicate the direction of photographic exposure. )
9. PREPARATION OF STANDARD MIXTURES
PREPARATION OF STANDARD MIXTURES 67
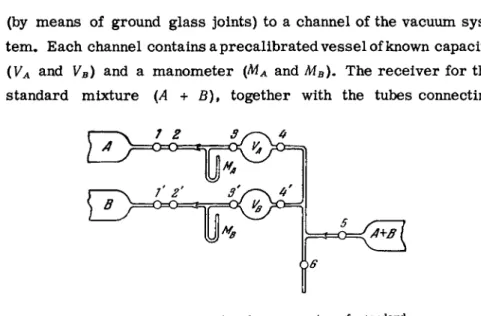
(by means of ground glass joints) to a channel of the vacuum s y s - tem. Each channel contains a precalibrated v e s s e l of known capacity ( l /A and VB) and a manometer (MA and MB). The receiver for the standard mixture (A + B), together with the tubes connecting
/ Ζ 3 *
Β
FIG. 26. Installation for the preparation of standard mixtures.
stopcocks 4, 4', 5 and 69 has a capacity of V. V e s s e l s VA and VB
are filled, respectively, with gases A and Β at p r e s s u r e s pA and pB. The remainder of the system is evacuated. The following partial p r e s s u r e s of gases A and Β are established when stop- cocks 49 4* and 5 are opened (while stopcocks 3 , 37 and 6 are kept closed):
Ρα·—Ρα V + VA + VB Pb>=Pe
(3.1)
(3.2) 'b v + vA+ vB-
The volumetric concentrations in the mixture are then related by
ΙλΣα
Ρ B VB (3.3)
Let us now consider a particular c a s e : assume we wish to determine helium in argon, the concentration of the f o r m e r rang- ing from 0.1 to 1%. The standards which we shall use should
contain approximately 0 . 1 , 0.3 and 1% helium. The equipment needed (apart from the vacuum system and the stand) consists of three empty cylinders of any desired capacity, a cylinder with helium and another with argon, with precalibrated vessels welded to the latter two cylinders. The respective capacities of the two precalibrated v e s s e l s are about 1-2 c m3 (for helium) and 500 c m3
(for argon)* A manometer is connected to each cylinder. For greater accuracy, the pressure should be read off a m i r r o r scale or with the aid of a cathetometer.
Let the helium and argon pressures in the precalibrated m e a s - uring v e s s e l s be equal. Let it be further assumed that the r e - spective capacities of these v e s s e l s are 1 c m3 and 500 c m3. If helium and argon contained in the measuring v e s s e l s are now transferred to an empty cylinder, the mixture obtained will contain 0.2% helium. By proper selection of p r e s s u r e s in the measuring v e s s e l s , the composition of the mixture can be varied as desired.
The accuracy achieved in obtaining a given composition of a standard mixture depends on the accuracy with which the capacities of the measuring v e s s e l s are known, the accuracy of manometer readings, and the rate at which the gases are mixed.
To determine the capacity of a measuring v e s s e l , the latter is filled with m e r c u r y , weighed, and the capacity calculated from the density of m e r c u r y at a given temperature. The connecting tubes and stopcock orifices must be at least 5 m m in diameter so that gas mixing will be fast. The standard mixtures are stored in glass containers, which are then sealed onto the vacuum system.
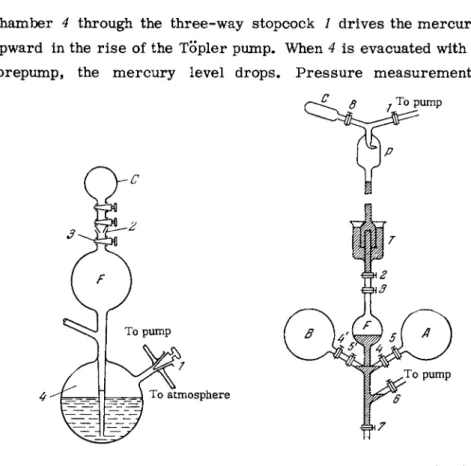
The preparation of standard mixtures is by the Töpler pump [290, 2 9 5 ] , shown schematically in Fig. 2 7 . Container C (mixture receiver) is mounted on a ground glass joint 2 on top of the Töpler pump, and the mixture components are transferred to it one by one from chamber F by means of mercury. Air admitted to
PREPARATION OF STANDARD MIXTURES 69
FIG. 27. Mercury compressor for the FIG. 28. Hansen's apparatus for the preparation of standard mixtures. preparation of standard mixtures.
are made with a manometer. Since the individual volumes of all the gases taken are equal, the ratio of their concentrations in the mixture will be equal to the ratio of the pressures used in filling C. When displacing a gas from chamber F, the latter must be completely filled with m e r c u r y so that no gas bubble will remain inside (the gas can be completely forced out of chamber F and into receiver C only if the mercury r i s e s high enough to fill the orifice of stopcock 3; however, this may result in contamination of the m e r c u r y with stopcock grease).
In Hansen's apparatus [295] the standard mixture receiver C is placed above a barometric leg (Fig. 28). The preparation of a chamber 4 through the three-way stopcock / drives the m e r c u r y upward in the r i s e of the Töpler pump. When 4 is evacuated with a forepump, the m e r c u r y level drops. P r e s s u r e measurements
To system
standard mixture proceeds as follows. A l l stopcocks are closed and chamber Τ is filled with mercury. Then stopcocks / , 8, 6 and 3 are opened and v e s s e l s C and F are evacuated. The m e r c u r y now rises in the barometric leg. Stopcocks / and 6 are then closed, 4 and 5 are opened, and gas from cylinder A is allowed to flow into v e s s e l F and the space between stopcocks 2 and 3. Stop- cocks 3, 4 and 5 are then closed, and stopcock 2 is opened. The mercury then fills the tube 2-3, forcing the gas into v e s s e l C
through trap P . Stopcock 2 is then closed while iTo cylinder 3 is opened; the mercury drains into vessel F9 1*1
and fills the space on top of stopcock 7. The space 2-3 is refilled with gas from F9 and the operation is repeated. In this manner a portion of the gas, or all of it, can be transferred to v e s s e l C.
Before admitting the next mixture c o m - ponent, the mercury is drained from v e s s e l F and the connecting tubes via stopcock 7. The entire system, (except container C) is e v a c - uated via stopcocks / and 6 (while stopcocks 29 89 4 and 7 remain closed). The subsequent steps are repeated in the s a m e order as before.
The Hansen installation does not, however, provide for automatic raising and lowering of the mercury level.
Roberts and Madison [296] described a Töpler pump system with automatic control of the mercury level (see Fig. 2 9 ) . Two solenoids, one in the vacuum section and the other in the section communicating with the atmosphere, are operated by means of three tungsten leads FIG. 29. Topler pump
with automatic mer- cury control. 1—Water cooling; 2—measuring vessels; 3, 5, 6—tung- sten input leads; 7—
solenoid; 8—mercury.
PREPARATION OF STANDARD MIXTURES 71 welded into the g l a s s . The gas is transferred into the space
located above the pump via valve 4. The transfer is achieved by means of a relay circuit, each cycle lasting half a minute. This system is capable of nearly complete gas transfer. The automatic control and elimination of greasing render this arrangement particularly desirable for many uses.
The advantage of preparing standard mixtures in gas transfer systems is associated with the fact that the initial pressure in cylinders A and Β may be lower than the pressure required for container C. Furthermore, such s y s t e m s allow preparation, without much difficulty, of standard mixtures consisting of any desired number of components.
It is necessary to bear in mind that the mixing of gases p r o - ceeds rather slowly. The prepared standard should therefore be left standing before it is used. The rate of mixing can be deter- mined experimentally.
We shall next describe equipment for preparation of very dilute gas mixtures [297]. This arrangement can be used ef- fectively when the minor component can be readily liquefied. The apparatus (see Fig. 30) consists of two interconnected v e s s e l s . A stream of gas flows through the upper vessel; the lower one is filled with the liquefied gas and the space above it is saturated with the vapor (gas). For a given liquid, the rate of diffusion depends on the pressure of the flowing gas as well as the pressure of the saturated vapor (i.e., on the temperature of the liquid). The dif- fusion rate can be calculated from theory; thus, the composition of the mixture can be computed if the gas flow rate is known. The method can be used, for instance, in the preparation of standards for determining mercury vapor concentrations in various gases.
In analytical research work it is best to prepare the standards directly in the discharge tube; the techniques which have been
described above also apply in this c a s e . However, a binary m i x - ture may be prepared in the discharge tube in a simpler fashion:
an accurately known quantity (usually the volume contained within the space between two stopcocks) of the principal component of the mixture is admitted into the tube, and the pressure in the discharge tube is measured. Then one calculates the p r e s s u r e at which the minor component must be present in the tube (when alone) to give the desired partial pressure in the mixture. The tube is now e v a c - uated and the minor component is introduced. Its pressure is checked, the p r i m a r y component is admitted, and the p r e s s u r e is rechecked (the pressure is thus determined twice—after the first and then after the second components of the mixture have been admitted into the tube). Before starting the analysis, s o m e time must be allowed for the mixing of gases. At pressures of the order of a few m m Hg, the required waiting period does not exceed 5
FIG. 30. Apparatus for the preparation of mixtures containing a readily liquefied gas
as an admixture.
PREPARATION OF STANDARD M I X T U R E S 73 minutes. The required time for mixing can be readily determined by checking the time from the start of the mixing to the point at which the ratio of intensities of the lines of the components in the mixture becomes stable. In large-diameter discharge tubes, mixing is completed within a few seconds.
Mixture preparation is also simplified by metering (dosimetric) stopcocks. If electrically operated stopcocks (see Section 7) are available in the system, then the gas quantities can be measured by means of the time the valve is open (provided pressure is constant).
All the methods described above are suitable for the prepara- tion of standards in which the minor component is present in con- centrations of several hundredths of one percent, or higher.
Standards with a lower content of the minor component should be prepared by the dilution method.
Various procedures have been developed for preparing standard mixtures by the flow method. One such procedure was proposed by Hersch and Whittle [298] and the equipment is shown in Fig. 3 1 .
a) Principal |
component] [
I f l h Mixture Minor component
70-
FIG, 31, Apparatus for preparing standard mixtures by the flow method.
The key part of the device consists of a syringe filled with a viscous liquid acting as a piston i . Because of the presence of
constriction 3, the liquid piston moves at a rate proportional to the flow rate of the principal component of the mixture and therefore the concentration of the minor component in the resulting mixture is not affected by flow rate fluctuations.
Figure 31a shows the basic variant of the method. The minor component is alternately introduced into the burette 2 through 5, or is discharged into the stream of the principal gas component through capillary 4. The direction of this flow depends on the position of stopcock 6 . The dead space should be minimum since it causes e r r o r s in preparing the mixture.
In a m o r e complex version of the s a m e idea (Fig. 31b) the desired composition of the mixture is reached instantaneously.
A three-way stopcock 6 is connected to a mercury cutoff 7. Burette 2 in this case has a larger capacity and its filling is accelerated since the viscous liquid acting as a piston can be returned to the burette via the auxiliary route 9 (there are no capillaries in this channel). The contamination of the gas depends on the nature of the piston liquid, the length of the nickel tube inserted into the U-shaped tube 10, and the length of the wire running through capil- lary tube 3. For precision work, the temperature inside the appara- tus must be kept constant (thermal lagging 8).
This device was used by Hersch and Whittle for preparing a mixture of nitrogen and oxygen ( 6 · 10~6% oxygen) at a flow rate of 100 m l / m i n . Even lower concentrations of the minor component can be obtained by mixing two streams—one of pure g a s , the other containing the impurity at a known concentration.
A device in which several gas s t r e a m s can be mixed in any desired proportion was described by Ageykin et al. [299].
Where standard mixtures must be stored for a long time one must consider the effects of gas adsorption on, or gas e v o - lution f r o m , the glass surface of the storage v e s s e l (the ratio of
PREPARATION AND PURIFICATION OF GASES 75 components of the mixture must stay constant if the mixture is to s e r v e as a standard). These effects become particularly important if the standards and samples are stored at low p r e s s u r e s . A number of studies [300-305] have shown that gas adsorption on glass and quartz depends on the condition of the surface, the t e m - perature, and the gas pressure inside the vessel. At a constant temperature, the gas adsorption increases with p r e s s u r e . The in- crease is fairly rapid at very low p r e s s u r e s , slows down in the higher p r e s s u r e range, and finally becomes independent of p r e s - sure. At constant p r e s s u r e , adsorption decreases with increase in temperature. Spectroscopic studies on nitrogen—oxygen mixtures stored in degassed glass v e s s e l s showed that after one month such mixtures became progressively depleted in oxygen, the loss being most pronounced at pressures of 1 m m Hg and lower.
One method for searching for leaks in gas discharge system in- volves discharging a spark from a T e s l a coil. It has been noted that this produces a copious evolution of C 02 and water vapor from the tube walls, even if the latter have been thoroughly degassed.
Apparently, such high frequency currents knock out gas molecules that have dissolved in the glass.
Thus, it is recommended that standard mixtures be prepared and stored at p r e s s u r e s above 100 m m Hg. Low pressure gas samples should be analyzed as soon as possible because the original composition of the sample may change on storage. The Tesla coil should not be discharged onto the glass surfaces of the gas sample container, the walls of the connecting tubing in the d i s - charge system, or the discharge tube itself.
10. PREPARATION AND PURIFICATION OF GASES Most of the relatively small quantities of gases needed for c o m - pounding standard mixtures can be prepared in the laboratory
[ 2 7 6 - 2 7 8 ] . Thus, hydrogen and oxygen are obtained by electrolysis of a 10% alkali solution. To remove water vapor, hydrogen and oxygen may be passed through a long tube filled with phosphorus pentoxide, and then through a coil placed in a Dewar flask con- taining liquid nitrogen. T r a c e s of oxygen may be removed from hydrogen by passing the latter through a quartz tube filled with clean copper shavings and kept in a furnace at 6 5 0 - 7 0 0 ° C . T r a c e s of hydrogen are removed from oxygen by passing the latter through a quartz tube filled with cupric oxide and kept in a furnace at 5 5 0 - 6 0 0 ° C . To decompose traces of ozone, the oxygen is passed through a tube containing active manganese dioxide (hopkalite).
Spectroscopically pure hydrogen can be obtained from a burner gas jet by permitting the hydrogen to diffuse through a palladium capillary welded to a vacuum-producing system and heated to incandescence by a burner. Spectroscopically pure oxygen is o b - tained by decomposition of potassium permanganate. The traces of C 02 are removed by passing the oxygen through a trap filled with solid potassium hydroxide, or by freezing out with liquid nitrogen. Small quantities of oxygen can also be obtained from the air, by means of diffusion through a silver tube. In this procedure, the rate of oxygen accumulation in a 1 liter v e s s e l was 2 m m3/ h r using a 3 m m I . D . , 150 m m long tube with a wall thickness of 0.25 m m heated to 7 0 0 ° C [306]. Pure nitrogen is obtained by d e - composition of sodium, potassium or barium azide (heating in vacuo). Nitrogen can also be obtained from sodium nitrite, by a
"wet" method, according to reaction:
N a N 02 + NH4C1 - > NaCl + N2 + 2 H20 .
A vacuum flask fitted with a dropping funnel is one-third filled with a saturated solution of ammonium chloride, the flask is heated, and a concentrated sodium nitrite solution is added dropwise through
PREPARATION AND PURIFICATION OF GASES 77 the funnel. The reaction is very vigorous. The nitrogen thus o b - tained contains traces of oxides, which are removed by passing the gas over red-hot copper shavings.
Carbon monoxide is obtained from formic acid which is d e - composed by sulfuric acid. Carbon dioxide is obtained by the d e - composition of neutral magnesium carbonate (MgC03) in vacuum at 4 0 0 - 7 0 0 ° C *
The inert gases are prepared by fractional distillation of air or natural gas. They are difficult to prepare using limited lab- oratory facilities, and therefore such gases are bought from large manufacturers. Pure inert gases are marketed either in metal cylinders or in sealed glass containers. To draw small gas samples from a glass container, one attaches to the latter two interconnected stopcocks, or the valve shown in Fig. 18.
A small g l a s s - or Teflon-coated iron bar is placed inside a glass tube which connects the stopcock and the sealed end of the storage container. Before the sealed end is broken, the connector tubing is thoroughly evacuated and degassed, the stopcock is closed, and the sealed tip is broken off by moving the iron bar by means of a magnet.
The inert gases may be purified in a discharge tube filled with potassium or sodium vapor, or through absorption of the impurities by lithium or calcium at high temperatures. Helium is freed of all impurities (including inert gases) in a trap containing activated carbon at the temperature of liquid nitrogen ( - 1 9 6 ° C ) .
Bennet [307] recommends the use of glass vacuum pumps for obtaining high-purity inert g a s e s . A glass pump offers many advantages since it will cause no contamination, is easily heated to remove adsorbed gases and performs well over a wide
*The exact decomposition temperature of M g C 03 will vary depending on impurities.
range of p r e s s u r e s . It has few moving parts and its suction rate is high (2 l i t e r s / m i n at ρ = 1 atm).
Traps filled with natrolite, kieselguhr, diatomite or kaolin, all of which are natural adsorbents for hydrocarbons, can be used to free an inert gas from hydrocarbon impurities. Somewhat l e s s effective adsorbents for hydrocarbons are activated carbon and silica gel (the adsorption of hydrocarbons and their mixtures on carbon and silica gel is described in [308]).
The removal of C 02 and water vapor from air is achieved with the aid of alumina gel. Traps filled with alumina gel can be repeatedly regenerated by calcination.
In spectral gas analysis the power needed to produce the e x - citation is supplied by DC and A C generators as well as h-f (r-f) oscillators.
Thus, a DC glow discharge will occur in a discharge tube when the latter is supplied by an 0 . 5 - 1 kW rectifier. The wiring dia- gram of the full-wave rectifier is shown in Fig. 3 2 . The circuit includes a filter consisting of a capacitor (C = 1 0 - 2 0 μ¥) and a choke (inductance L « 20 henries). The rectified current is regu- lated by means of two variable r e s i s t o r s , one of which is connected
11. LIGHT SOURCE P O W E R SUPPLIES FOR SPECTROSCOPY OF GAS MIXTURES
FIG, 32, Full-wave rectifier, 1—Trans- former; 2—vacuum tube rectifiers; 3—capac-
itor; 4—choke; 5—load.
LIGHT SOURCE POWER S U P P L I E S 79 to the primary of the transformer, and the other hooked up in s e r i e s with the discharge tube. The resistance of the last resistor should be of the s a m e order as that of the discharge tube. Both the resistor and milliammeter must always be inserted in the grounded part of the circuit. Either the positive or the negative terminal of a rectifier tube can be grounded. The rectifier output voltage generally amounts to 1 0 0 0 - 1 5 0 0 V .
Such a high-voltage rectifier is also suitable for feeding a pulse generator (see Fig. 1 3 ) . In this case, the rectifier voltage should be increased to 3 0 0 0 V for best results. A high capacitor charge, which sets up a potential higher than the breakdown voltage of the discharge tube, is obtained by connecting a spark gap or a thyratron in s e r i e s with the tube. The condenser capacitance can be varied from 2 - 3 to 1 0 0 M F , depending on the required flash intensity. Resistor R inserted in the capacitor charging circuit makes it possible to achieve a pulsed mode of operation while working with relatively low capacitance values. This resistance increases the charging time of the capacitor so that flashes (pulses) can be separated. In cases where the firing potential of the discharge is very low, a thyratron or spark gap must be used, because otherwise the capac- itor is unable to discharge unless its potential is quite high.
If the discharge tube is powered directly from the line, then the voltage must be raised to 1 5 0 0 - 3 0 0 0 V b y means of a step-up trans- former.
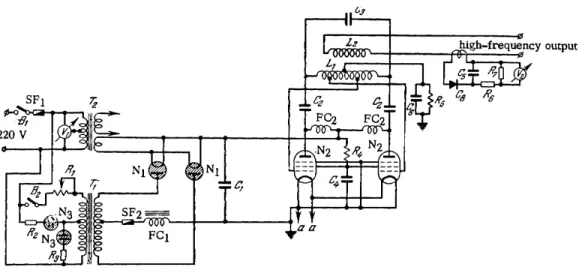
In spectroscopy of gas mixtures high-frequency discharges are often used to provide a source of light. Three types of h-f o s - cillators, which are typical of those used in this application, have been developed by the experimental workshops at the Physical Research Institute of Leningrad State University. These are the V G - 2 and V G - 3 types and a low power device using a double pentode. A schematic diagram of the 6 - M c , 3 5 0 - W V G - 2 generator
is given in Fig. 3 3 . The design provides no facilities for varia- tion of the frequency.
In this generator, the oscillator circuit is coupled to the discharge tube through a specially designed coil whose ends are connected to the external electrodes of the tube. The d i s - charge tube current can be varied either by changes in the coupling coil or by regulating the current flowing through the primary of the high-voltage rectifier. To achieve a steady oscillator p e r - formance the voltage supply to it must be stabilized. Fluctua- tions in the A C line current may lead to serious e r r o r s in the analysis.
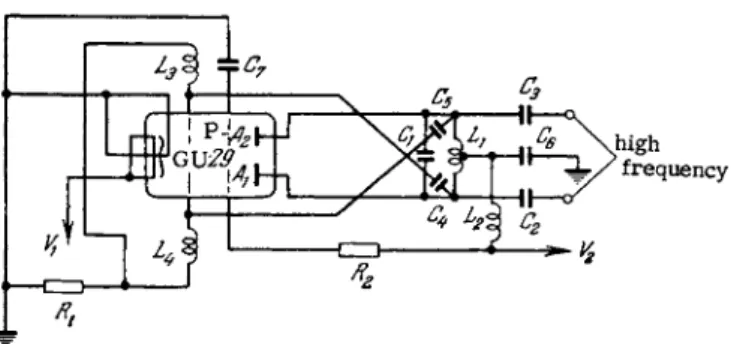
Generators of the V G - 2 type can be used only when high an- alytical accuracy is not required and where e r r o r s of 10-15% are acceptable. A m o r e stable oscillator that will ensure reproduci- bility of results within 5-7% (even with anunstabilized line voltage) is the low power, push-pull oscillator of the type shown in Fig. 34 [310]. This particular generator uses a capacitance-coupled double pentode. This arrangement achieves a stable peak voltage, whereby the effect of the discharge tube on the oscillator frequency and the output voltage is reduced. The frequency of this particular 3 5 - 4 0 W oscillator can be varied within 5 8 - 6 0 Mc by means of a variable capacitor C{. The oscillator circuit is based on capacitance Cx
and inductance L\ and is connected through coupling capacitors C2 and C3 to the discharge tube. The feedback voltage is tapped from choke Li and fed via capacitors C4 and C5 to the control grids of the double pentode. The optimum coupling value is determined experimentally by varying the number of turns in the coupling coil Li. The A C component in the control grid circuit is isolated by means of h-f chokes L3 and L4. The control grid bias is created by the grid current passing through resistor R). The screen grids are fed from the Β supply through voltage-dropping resistor R2.
jr
m
C O
FIG. 33. The experimental high-frequency generator VG-2. Οχ—1500 V, 4/iF paper capacitor; C2—2500 V, 500 pF mica capacitor; C3—7O pF air capacitor; C4—1000 V, 3000 pF mica capacitor; C5—2500 V, 1000 pF sealed paper capacitor; CO—1000 V, 5000 pF mica capacitor; V*i—AC voltmeter, 250 V; V2—hot wire am- meter; Ri—variable resistor, 6-8 A, 50-100kft; R2, R3—0.25 W, 15 kQ composition resistors; R4—1000 W, 10 kQ vitrified resistor; R5—same, 50 W; R^—0.5 W, 1 1<Ω composition resistor; R7—same, 21<Ω; Ni—hot cathode, gas-filled tube rectifiers, Soviet type VG-129; N2—pentode, Soviet type G-471; N3—neon pilot light; Lj—.oscillator circuit coil; L2—coupling coil; Bj—filament circuit switch; B2—plate circuit switch;
SFi—10 A safety fuse; SF2—same, 1 A; FCi—filter choke; FC2—high-frequency choke; Ti—power trans-
former; T2—filament circuit transformer; Ce—copper-oxide rectifier. oo
high frequency
FIG. 34. The experimental low power high-frequency gen- erator. Ci_200 pF; C2, C3- 2 5 pF; C4 f C5-.5O pF; C(>, C7- 600 pF; Ri—18 kQ; R2—90 1<Ω; Vi—6.3 V; V2—400-700 V;
Li—0.4-2 microhenries; L2> L3, L4—chokes; P—double pen- tode, Soviet type GU-29.
This type of generator may be used as an excitation source in con- ventional gas analyzers (see Section 14).
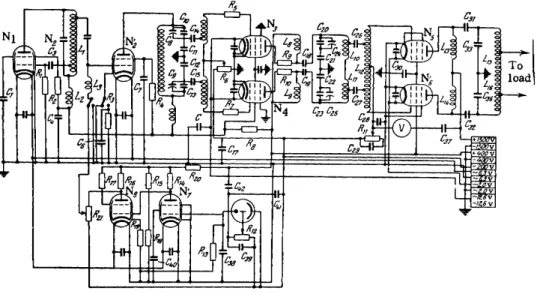
When it is desired to analyze mixtures of gaseous isotopes, oscillators such as the V G - 3 (Fig. 35) are used [311]. In addition to stable performance, this oscillator is capable of high power out- put, both of which are necessary. Improved stability of operation is achieved by means of an electron-optical feedback. Thus, a fraction of the luminous flux emerging from the discharge tube is made to impinge on a single-stage photomultiplier. The electric signal generated in multiplier is amplified by an amplifier in the feedback circuit of the oscillator and is fed, in the form of a modulating signal, to the h-f oscillator circuit. Thus the power output of the oscillator varies with the luminous flux in the load circuit. This method of stabilizing the luminous flux permits compensation of the variation in brightness of the glow caused by the instability of the line voltage. Since the oscillator is multi-stage, the gain r e - quired in the feedback circuit may be substantially reduced.
Power control is achieved in the low power stage which uses tube N2 operating without grid currents. A s a result, a low gain DC amplifier can be used in the feedback circuit.
FIG. 35. The experimental high frequency oscillator, type VG-3.
oo
CO
The master oscillator (Nj) is hooked up in a conventional Hartley oscillator (coil-coupled) circuit using the s a m e tetrode as in the power control stage.* The amplification stages of the high- frequency oscillator operate in a push-pull mode and use Soviet tubes G U - 2 9 ( N3, N4) and G K - 7 1 ( N5, N6) .
The feedback amplifier uses directly coupled tubes N7 (Soviet type 6Zh8) and N8 (Soviet type 6 P 6 ) . Feedback level control is
achieved by means of a potentiometer.
A stabilized rectifier supplies power to the photomultiplier, the master stage, the bias circuits of the h-f oscillator, as well as the DC amplifier. This particular generator is tuned to a frequency of 1.6 Mc and delivers an output of 300 W .
Microwave frequency oscillators, which offer many advantages over low frequency generators (see Section 5 ) , are now finding in- creasing use in spectral analysis. A schematic diagram representing one of the many possible designs of a magnetron oscillator [241]
FIG. 36, Magnetron oscillator. 1—Magnetron; 2—
magnet, 1200 gauss; 3—noncontacting plunger; 4—
waveguide; 5—discharge tube; capacity C » 4 jiF;
6—nonreactive load.
•Soviet type 6P6.
THE S P E C T R O S C O P I C SYSTEM 85 is shown in Fig. 3 6 . The magnetron, designed for continuous o p - eration at 3000 M c , has the following parameters : U p l a te = 4150 V;
i plate = 5 0 - 7 0 m A ; Um s i m e n t= β·3 V ; H = 1 2 00 Sa u s s* T he discharge tube is installed inside a waveguide, in the antinode of the electro- magnetic wave. The light emanating from the tube is extracted through a slit in the side wall of the waveguide. Adequate protection against microwave-frequency radiation should be provided for the personnel working with these oscillators.
Several papers on spectroscopy and spectral analysis [ 2 4 0 , 2 4 3 , 312] mention the use of highly stable standard oscillators operating at 2450 M c and giving a power output of 125 W .
12. THE SPECTROSCOPIC SYSTEM
The primary function of the spectroscopic s y s t e m , as far as gas analysis is concerned, is to disperse the radiation emitted by the glowing gaseous mixture and to resolve it into its m o n o - chromatic components. The operating principle of the spectral instruments used for this purpose is based on light dispersion, diffraction or interference. Spectra may be observed visually, they may be photographed, or they may be recorded by means of a photoelectric radiation r e c e i v e r - r e c o r d e r . An assembly c o m - bining a monochromator with a photoelectric attachment consisting of a recording radiation detector is called a spectrometer.
The basic components of any spectroscopic device—the slit, the dispersing system and the optical system proper—all serve the purpose of obtaining spectral lines, of which each is a monochro- matic image of the slit.
The dispersing system may be a p r i s m , a diffraction grating or a set of interferometer plates. The many existing types of prism instruments use g l a s s , quartz or fluorite p r i s m s of various shapes, depending on the spectral region under consideration. The use of
prism instruments is limited to the visible and the relatively near UV regions.
The introduction of ruled diffraction gratings has greatly i m - proved spectroscopic equipment. Instruments incorporating diffrac- tion gratings are finding an ever increasing use, especially in vacuum ultraviolet spectroscopy, as well as in some types of analysis of isotopic mixtures.
We shall omit here the detailed description of the various avail- able spectroscopic instruments. A review of these can be found in any of the general manuals on spectroscopy and spectral analysis [25, 208, 209, 3 1 3 - 3 1 7 ] , * as well as in the literature available from the manufacturers. W e shall, however, discuss interference filters in some detail (see Section 13), principally because the hand- books generally devote little space to these parts of the apparatus.
The basic parameters describing any spectroscopic instrument are its dispersion, resolving power and light transmittance.
Dispersion
A distinction should be made between linear and angular disper- sion. The angular dispersion of a spectrometer defines the angle which separates two beams whose wavelengths differ by Δλ after they pass through the beam splitter. The angular dispersion is given by
^ = 1·
(3.4)where αφ is the angular separation of the beams in the dispersing element of the system.
At minimum deviation and for a single-prism instrument 2 sin
4
(3.5)
*Jacquinot [318] gives a very interesting and original description of the various aspects of spectroscopic techniques.
THE SPECTROSCOPIC SYSTEM 87 where α is the refraction angle of the p r i s m , η is the refractive index and the factor dn/dk is specific to the prism material.
In instruments using a diffraction grating, the angular dispersion is given by
= * ^
= sY + f * (3.6)
ψ dk d C O S φ λ C O S φ ' x 7
where d is the grating constant (the distance between two adjacent ruled lines), φ' is the angle of diffraction and ψ is the angle of in- cidence of the light impinging on the grating.
Two light rays of wavelengths λι and λ2, resolved by the splitter and made to diverge at an angle αφ, will project the image of two lines onto the focal surface of the instrument. If the d i s - tance between the lines on the focal plate is dl9 then
- Ä R - A (3-7)
where the factor £>λ is the linear dispersion of the instrument; it is usually given in terms of its reciprocal (or A/mm). The linear and angular dispersions are related by
where F is the focal length of the focusing (objective) lens.
Linear dispersion can be increased either by increasing the angular dispersion or the focal length of the focusing system. To improve the angular dispersion of a prism instrument one must either increase the angle of refraction of the prism or the number of p r i s m s . Alternatively, one can use a prism made of some m a - terial with better dispersive properties.
The dn/d\ value is a decreasing function of the wavelength. It follows that prism instruments have lower dispersions in the infrared than the ultraviolet portion of the spectrum.
FIG. 37. Criterion for evaluating the resolution of two spectral lines.
Within the limits of one order, the linear dispersion of a grating instrument may be assumed virtually constant, provided the angle of incidence of the light does not deviate too far from the normal. It is seen from Eq. (3.6) that if the angle φ'is s m a l l , then cos φ' —1 and dispersion is constant. If the ray falls obliquely upon the grating, the value of φ' may reach several dozens of d e - grees so that dispersion will vary with the wavelength (as in the case of p r i s m s , dispersion is greater in the short than it is in the long wavelength region).
Resolution
Another essential characteristic of any instrument is its resolv- ing power, which is given by
* = W> (3·9>
where δλ is the smallest wavelength difference between two equal intensity lines which can still be resolved by the instrument op- erating at a given wavelength λ.
A spectral line is actually the slit image which is broadened by diffraction. If the slit is very narrow, the width of the image will depend almost solely on the width of the zeroth order diffraction maximum. Two lines are considered (see Fig. 37) resolved if the diffraction minimum of one aligns with the diffraction maximum of the other (Rayleigh's criterion). In that case the drop in intensity between the two maxima is 20%.
THE SPECTROSCOPIC SYSTEM 89 Two lines differing markedly in intensity may not be resolved by the instrument even though their relative position satisfies the Rayleigh criterion. On the other hand, when the accuracy in the measurement of intensity is considerably higher than 20% (as it is in photoelectric recording), the instrument may be able to resolve lines separated by a distance which is smaller than that required by Rayleigh* s criterion.
The resolving power of a prism instrument is determined by r e s - olution of which the prism is capable when completely illuminated:
R = a ^ , (3.10) where a is the thickness of the base of the p r i s m and dn/dX is
the characteristic dispersion specific to the prism material.
In the same way the resolving power of an instrument using a diffraction grating depends on the resolving power of the grating.
The theoretical resolving power of a grating is given by
where M is the number of illuminated ruled lines in the grating and k is the order of spectrum.
The actual resolving power of a spectroscopic instrument is considerably lower than the theoretical. It is affected by such factors as imperfections in the optical system, light diffraction by the diaphragms, stray light, and the width of the slit. It turns out that below the so-called " n o r m a l " width of the slit, the width of the line image on the focal plane remains constant regardless of whether the width of the slit is further reduced. This means that reduction of the width of the slit to below normal does not improve the resolving power of the instrument. The normal width of the slit depends on the wavelength:
R = kN, (3.11)
(3.12)
where f is the focal length of the collimator lens and d is the lens diameter.
Sometimes it is not possible to fully utilize the available r e s o l v - ing power of the instrument. This happens with spectrographs, where the limiting factor is the size of the grain of the photographic plate.
Light transmittance
The efficiency with which a spectroscopic device utilizes the incident radiation is governed by the light transmittance of the system. If the condenser lens is large enough to transmit all of the incident light, then the luminous flux dF entering the spectrometer will be a function of the brightness bx of the light source, the area ASi of the entrance slit, and the solid angle dQ :
where Dx is the diameter of the collimating objective and F{ is its focal length.
The light transmittance of an instrument varies with the type of recording employed. The commonly used photographic recording methods measure illuminance produced by the light source in the focal plane of the instruments, integrating it over time to yield ex- posure, whereas the photoelectric detector measures only the in- stantaneous light flux transmitted by the optical system to the photosensitive layer of the radiation receiver. Let us see which parameters of the instrument are controlling in each case.
I. The case of a line spectrum
a) Photoelectric detection (in terms of light flux). A fraction of the flux entering the instrument is absorbed in the optical s y s t e m , dF=bx dlkSi d& (3.13) o r , considering that
(3.14)
THE SPECTROSCOPIC SYSTEM 91
Ο Thus
F = ^{^)2BLSV (3.17)
It follows that the light transmittance
(F'/b)
of the spectral in- strument, given by-β-^ΎΚΎ;) ^ (3.18)
is proportional to the transmittance (relative aperture number) of the collimator and the area of the entrance slit AS{.
b) Photographic recording (in terms of illuminance).Let A S j d e s - ignate the area of the image of the entrance slit produced by the optical system of the instrument. If àS[ is considerably greater than the natural width of the line then the illuminance Ε in the focal plane of the instrument is
„ bF'
ΑΠ / £>, \ 2 n Δ5AS! (IT) β^ϊ' (3-19)
If the camera and collimator lenses are of equal diameter (Dx =D2)9 produce identical magnification q = 1, and have the respective focal lengths Fx and F2$ then
another fraction is lost by reflection, and still another fraction is scattered. The luminous flux emerging from the instrument can thus be expressed as dFΊ
dF' = adF=^ (^)2 bk d\ àSl9 Α < 1. (3.15) If the exit slit is able to pass the complete image of a line, the emerging total flux is
OO
^ » « ( ^ A S . / f t x d X , (3.16) OO 0
But j* ολ dX is equal to the total intensity (brightness) of the line B.
AS[ \F2)
in which case the illuminance expression (3.19) can be rewritten as
(3.20) The light transmittance of the spectral instrument thus becomes
mr
( M DE_ Β
λ-Δλ
R—
%+Δλ
that is, it is proportional to the transmittance (relative aperture number) of the objective of the camera and is independent of the entrance slit area,
2 . The case of a continuous spectrum
a) Photographic recording (in terms of il- luminance). The illuminance produced by a portion of a continuous spectrum in the focal plane of the instrument is
Δλ
FIG. 38. The area of
overlap of slit images.
b
xdl.
(3.22)Here Δλ is the arc of overlap of images Si of the slit at several wavelengths (see Fig. 38); it is given by
D^F2 (3.23)
where £)φ is angular dispersion of the system and S[ is the width of the image of the entrance slit. If the camera and collimator lenses are of equal diameter ( D , =D2) and produce an identical magnifica- tion q = 1, then
S i = S i 7 * (3.24)
THE SPECTROSCOPIC SYSTEM where S i is the width of the entrance slit and
(3.25) Then
ΔΛ (3.26)
where b\ is the mean value of the brightness distribution function in the range Δλ.
The illuminance expression (3.20) then becomes
Thus, the transmittance of the spectral instrument E/bx which has the form
is proportional to the transmittance (relative aperture number) of the objective of the camera and the width of the entrance slit, and varies inversely with the angular disperison and the focal length of the collimator lens.
b) Photoelectric detection (in terms of luminous flux). The luminous flux b>F emerging through the exit slit of area AS2 is given by
(3.27)
(3.28)
= Ε
A S2, (3.29) orαπ ( D
2\
2àySi
Ç _ ΑΠ (Dx\2t _S1__ A S , (3.30)4\fJ D9Fx
where S2 is the width of the exit slit. The transmittance of the
instrument
bx 4 \Fj DVF2
is then proportional to the transmittance (relative aperture number) of the collimator lens, the entrance slit area and the width of the exit slit, while it varies inversely with Ζ)φ and F2.
Comparison of transmittances of p r i s m and diffraction grating instruments shows that illuminance is about the s a m e in the two types of spectral devices. In t e r m s of the luminous flux, however, the diffraction grating appears somewhat superior. The greater angular dispersion of the grating allows the use of wider slits and s m a l l e r focal lengths. A s a result a greater light flux reaches the detector at the s a m e resolution of the instrument.
The above considerations permit a rational selection of an in- strument and slit dimension for specific analytical requirements.
The correct choice of the instrument is particularly important where high sensitivity of analysis is required (see Section 2 1 ) .
Gas spectra show fewer lines than metal spectra. Therefore it is usually not necessary to use high-dispersion instruments (except in spectral analysis of gaseous isotope mixtures). In some c a s e s , it is even possible to use monochromator filters (which provide a dispersion far lower than that of even the crudest spectral device) without reducing the analytical sensitivity (see Section 2 6 ) .
Most spectroscopic methods for gases use analytical line pairs located in the visible spectrum. A s a result, instruments with glass optics are quite sufficient.
Spectral instruments capable of delivering a high luminous flux are particularly valuable in photoelectric detection of spectra.
In this application, interference filters are superior to dispersion devices. The light flux from an interference filter is a function