PROCESSES AT L O W F R E Q U E N C I E S
L . V O N H A M O S
Royal Institute of Technology, Stockholm, Sweden
Measurement of the dynamical properties of processes is fundamental for the design and optimization of their automatic control. Such measurements include the determination of transferences between different input and output variables as well as the characterization of the disturbances affecting the process. Whereas more and more studies on idealized transferences of different processing units appear in the literature, our knowledge of the nature of the disturbances, which make automatic control necessary, seems to be very restricted.
Many of the processes in industry are very slow and must therefore be studied for periods of hours, days or maybe weeks in order to find out the nature of their dynamical properties. The methods of measuring such derived quantities as, for instance, spectral density or transference are chiefly developed for phenomena of much higher frequency.
In order to make the dynamical analysis of very slow processes possible by means of methods which have been developed for higher frequency ranges, an apparatus system called I D A (integrated dynamic analyzer) has been built at the Division of Automatic Control of the Royal Institute of Techno- logy, Stockholm. This system also makes possible the evaluation of process data by means of digital computers of the general purpose kind.
The main features of the system are as follows:
7. There is a record of data available, which can be processed according to different schemes.
2. A very wide range of frequencies can be studied by the same evaluating means.
5. Computers of an analog or digital type can be used for evaluation of derived quantities.
4. The system is an integrated one, i.e. there is no necessity for manual transcription of data during the process of evaluation.
S U R V E Y O F T H E A N A L O G A N D D I G I T A L M E A S U R I N G S Y S T E M S
Figs. 1 and 2 show block diagrams of the analog and digital measuring systems, respectively. Measurement is performed in both arrangements on a
Measurements on industrial processes at low frequencies 51
Input Transducer generator.
Input generator
Modulator Magnetic
recording Magnetic tape Magnetic
recording Magnetic tape
Magnetic
playback Demodulator Magnetic
playback Demodulator Magnetic
playback Demodulator Electronic
frequency X-Y recorder analyzer
t__J Analog-T-^—T
digital ; Tape ι
" l~
Fig. 1.
Fig. 1.—Integrated analog system for dynamic analysis.
Fig. 2.—Integrated digital system for dynamic analysis.
Fig. 2.
system under test, which is acted upon by an input generator. In the diagrams it is assumed that two quantities are measured (in the following the input is called χ and the output y). The measured variables are accepted by the data-processing chains in the form of voltages. In the analog scheme of Fig. 1 the variables are recorded on a magnetic tape, whereas in the digital chain (Fig. 2) they are punched on paper tape after analog-digital conversion.
The evaluation of the magnetic tape record may take place at speeds dif
ferent from the original speed of registration. It is therefore possible to use a frequency response analyzer, which is designed for frequencies 20 and 400 times higher or 20 times lower than those used in the original experiment.
In the case of a digital record, a general purpose digital computer is pro
grammed in order to make the analysis. It is also possible to combine the analog and the digital chains in different ways. A n analog record, for ex
ample, can be translated into a digital one by applying the converter.
S H O R T D E S C R I P T I O N O F T H E M A I N P A R T S O F T H E A P P A R A T U S
Input generator
Any of the commercially available sine-wave generators can be used in ordinary frequency analysis. A multifrequency generator according to Jensen, producing on-off signals in a periodic scheme, can also be applied.
For random signals a special low-frequency noise generator has been developed [4]. It delivers an output of 8 V effective. Output impedance
<2.5 k Q ; frequency range, 0.001-100 Hz. The drift is less t h a n ± 10 m V after a period of 30 min. The low-frequency noise is obtained by sampling
1 0 "3 i o -2 10-
Tape speed cm/sec
(//,
v/,'//,
38.01
1.9I*
'///. 0.095 Fig. 3.—Frequency range of magnetic tapeunit.
30 periods ~ length of tape>E
the amplified noise of a wire resistance. It might be mentioned that in some cases the use of an input generator is not necessary, as, for example, when measuring the natural disturbances of a process.
Transducers
All data from the system under test are converted into voltages ranging between ± 18 V. For pneumatic systems, which are frequent in the process industries, a special P/E transducer has been developed. In order to apply electrically shaped input signals on a pneumatic system an E/P transducer is necessary. The transducer developed has a frequency range up to 10 Hz [3].
Magnetic tape recorder
The recorder has tape speeds of 38 cm/sec, 1.9 cm/sec and 0.095 cm/sec respectively. Fig. 3 shows the range of frequencies corresponding to the speeds. A system of pulse-width modulation is used. A t the lowest speed of the tape the modulation frequency is 2.5 Hz and at the highest 1000 Hz.
A t present there are only two channels for registration. Input and output amplitudes are between+18 V. There are different electronic units for recording and playback at different tape speeds [5].
Analog-digital converter and punch
Fig. 4 shows a simplified block diagram of the transitorized analog-digital converter. The input voltages χ and y (ranging from 0-10 V ) are alternated
Sampling switch
Schmitt trigger
Row-timer counter
I
register f Binary ID-A converter network
~ T ~ Reference voltage
Fig. 4.—Simplified diagram of the analog-digital converter.
Measurements on industrial processes at low frequencies 53
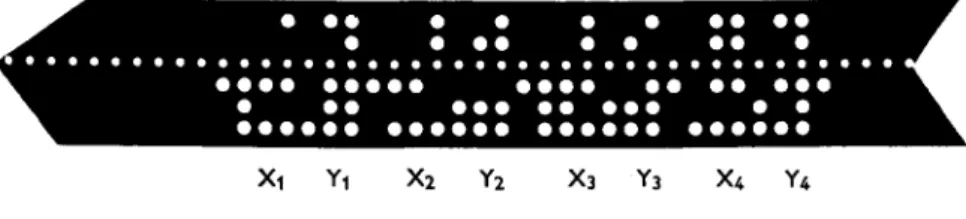
Xl Yl X2 Ϊ 2 X3 Y3 X4 Y4
Fig. 5.—Punched tape pattern.
on the converter. This works by means of a feedback loop, the action of which may be described in a simplified way as follows.
Triggering pulses from a timer on the left, acting through the encoding matrix, build up successively binary numbers in the static output of a register.
The output number is converted by the D - A converter network with weighted resistors into a feedback voltage acting on a comparison circuit (modified Schmitt trigger). This circuit produces inhibitory pulses as soon as the feed
back voltage exceeds the actual input. Thus the growth of the output number is finished at the value, which represents the input.
In order to be punched on ordinary telextape the output number is translated into a 3-row pattern by a translating matrix, which is controlled by a row-timer. T w o such patterns and an interval sign form a " w o r d " of seven rows (see Fig. 5). The converter has an accuracy of 10 bits and a timer frequency of 15000 Hz, i.e. the conversion of an individual value is accomp
lished in 0.6 ms. Punching of the patterns is performed at a much lower speed owing to the available punch, which at present has a maximum of 20 rows/sec.
Programming a digital computer for the calculation of autocorrelation functions and spectral densities
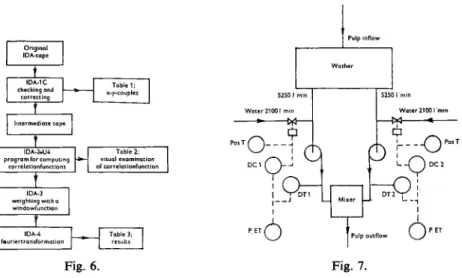
For the evaluation of statistical time series obtained on paper tape, special programs have been developed [1, 2, 6]. The most important statistical parameters are the auto- and crosscorrelation functions Rxx(r) and RXY(J) and the corresponding spectral densities GXX(W) and Gxy ( ω ) . Fig. 6 shows an example of a flow diagram for the calculation of these quantities by means of the BESK computer in Stockholm.
The program works on the original tape produced by the I D A chain and corrects punching errors if necessary. It prints a table of the functions. The correlation functions are printed for visual examination before the trans
formation into spectral densities takes place.
Before Fourier transformation, the correlation functions are weighted by suitable " w i n d o w " functions according to modern theories of time- series analysis. Finally, a table of the spectral densities is printed.
Original IDA-tape
IDA-1C checking and
correcting
Table 1;
x-y-couples IDA-1C
checking and correcting
Table 1;
x-y-couples
Intermediate tape
I
IDA-2+U4 program for computing
correiationfunctions
Table 2;
visual examination of correlationfunction
IDA-3 weighting with a windowfunction
IDA-4 Table 3;
fauriertransformation results
5250 I min Water 21001 min
I
OH
•ό
5250 I min Water 21001
Ρ
Ο
Fig. 6.
Fig. 6.—Flow diagram for an I D A program.
Fig. 7.—Section of pulp-dilution process studied.
Fig. 7.
S O M E M E A S U R E M E N T S O N A N I N D U S T R I A L P U L P D I L U T I O N P R O C E S S
The use of parts of the I D A - B E S K system will be illustrated by a few preliminary results from a Swedish pulp undertaking.1 The object of our study was a section of the pulp-dilution process (see Fig. 7). The concentra
tion of pulp fluctuates slowly when leaving the washer. The fluctuations are measured by the transmitters D T I and D T 2 belonging to the respective parallel streams. In order to control the concentration, two water-streams are injected through control valves, which are acted upon by the controllers D C 1 and D C 2, respectively. Measurements were made on the concentra
tions by means of P/E transmitters.
T o begin with, the natural fluctuations of the concentration were studied at fixed positions of the control valves. T w o records of the concentration, lasting 398 and 426 min respectively, were evaluated by correlation techni
que. Fig. 8 shows the normalized autocorrelation functions. The sampling interval for the digital evaluation was Τ = 25.4 sec. The two estimates are quite similar. The significant part of the correlation curve is in the interval 0 < τ < 40 min. This gives an idea of the slowness of the fluctuation.
In another experiment the closed control loop was investigated and concentration and valve position were recorded. The controller was not able to cancel perfectly the fluctuations of the concentration measured at D T I .
1 Marma-Langrors AB, Soderhamn. The measurements were carried out by Civ.ing.
G. Attebo.
Measurements on industrial processes at low frequencies 55
3 x 10~ 3H2_
Fig. 8. Fig. 9.
Fig. 8.—Autocorrelation functions for two concentration samples of 398 and 426 min duration, respectively.
Fig. 9.—Autospectral densities for concentration samples. uncontrolled; — con- trolled.
The spectral density of the concentration, which can be seen in Fig. 9, is reduced by the controller (dashed curve), as compared with the spectral density measured at fixed valve position. Our measurements facilitate the quantitative assessment of the dynamics of the process, and in this way make it possible to guide future improvements on it.
This work was financially supported by grants from Statens Tekniska Forsk- ningsrad.
R E F E R E N C E S
1. HAMOS, L . v., Automatic evaluation of time-series by means of IDA-BESK. TRI-58.
Division of Automatic Control, Royal Institute of Technology, 1958. (In Swedish) 2. Calculation of spectral densities for time-series of finite length. TRl-59. Division
of Automatic Control, Royal Institute of Technology, 1959. (In Swedish.) 3. PETTERSSON, G., Electro-pneumatic transducer. TR3-58. Division of Automatic
Control, Royal Institute of Technology, 1958. (In Swedish.)
4. W A L L I N , V . , Noise generator. TR6-58. Division of Automatic Control, Royal Institute of Technology, 1958. (In Swedish.)
5. Two-channel magnetic tape recorder. TR4-59. Division of Automatic Control, Royal Institute of Technology, 1959. (In Swedish.)
6. WIGERTZ, O., Description of a program for numerical evaluation of correlation func- tions and spectral densities by means of IDA-BESK. TR6-59. Division of Automatic Control, Royal Institute of Technology, 1959. (In Swedish.)