GRA.LE.D. (GRApevine LEaf Digitalization) Software for the Detection and Graphic Reconstruction of Ampelometric Differences Between Vitis Leaves
P. Bodor1 , L. Baranyai2 , B. Bálo3, E. T6th3, A. Strever4, J.J. Hunter4' 5, Gy.D. Bisztray 1'
(1) Corvinus University of Budapest, Institute of Viticulture and Enology, Department of'Viticulture, Budapest, Hungary (2) Corvinus University of Budapest, Faculty of Food Science, Department of Physics and Automatization, Budapest, Hungary (3) Robert Károly College, Research Institute of Viticulture and Enology, Eger, Hungary
(4)Department ofViticulture andEnology, PrivateBagXl , 7602Matieland, UniversityofStellenbosch, Stellenbosch, SouthAfrica (5)ARC Infruitec-Nietvoorbij, Private Bag X5026, 7599 Stellenbosch, South Africa
* These two authors contributed equally to this paper Submitted for publication: June 2011
Accepted for publication: September 2011
Key words: Vilis vinfera L., ampelography, software
Raster graphic ampelometric software was not exclusively developed for the estimation of leaf area, but also for the characterization of grapevine (Viti vinifera L.) leaves. The software was written in C-H- programming language, using the C-1-1- Builder 2007 for Windows 95-XP and Linux operation systems. It handjes desktop-scanned images. On the image analysed with the GRA.LE.D., the user has to determine 11 points. These points are then connected and the distances between them calculated. The GRA.LE.D.
software supports standard ampelometric measurements such as leaf area, angles between the veins and lengths of the veins. These measurements are recorded by the software and exported into plain ASCII text files for single or multiple samples. Twenty-two biometric data points of each leaf are identified by the GRA.LE.D. It presents the opportunity to statistically analyse experimental data, allows comparison of cultivars and enables graphic reconstruction of leaves using the Microsoft Excel Chart Wizard. The GRA.
LE.D. was thoroughly calibrated and compared to other widely used instruments and methods such as photo-gravimetry, LiCor L0100, WinDIAS2.0 and ImageTool. By comparison, the GRA.LE.D. presented the most accurate measurements of leaf area, but the LiCor L0100 and the WinDIAS2.0 were faster, while the photo-gravimetric method proved to be the most time-consuming. The WinDIAS2.0 instrument was the least reliable. The GRA.LE.D. is uncomplicated, user-friendly, accurate, consistent, reliable and has wide practical application.
INTRODUCTION
Ampelography means morphological characterization of the grape (Vilis spp.) organs such as canes, shoots, leaves, flowers, bunches, berries, seeds, etc. The term was first used by Sachs in the middle 17 1 century (Viala & Vermorel, 1905). It represents the study most commonly used today in cultivar identffication and differentiation (Truel, 1985; MartI et al., 2007; Santiago et al., 2008), canopy management (Poni et al., 2008), comparison of rootstock effects (Bica et al., 2000), environmental impacts (Ferrini et al., 1995) and even in the history of art (Gago et al., 2009). A sub-section of this science is ampelometry which is based on the nominal characterization of grapevine leaves. According to Goethe (1887) the most important characteristic of the grapevine leaf(Vitis vinfera L.) is the angles between the veins. Ravaz (1902) categorized the cultivars into 10 classes according
to these angles. In the 20 11 century, the study was extended and applied to several cultivars by Andrasovszky (1926) and Galet (1988).
There are significant differences between cultivars in characteristics such as leaf area, length of the veins, ratio between the veins, angles between the veins and in the length of the petiole (Németh, 1966). These characteristics proved to be appropriate to differentiate between grapevine cultivars (OW, 2001).
Until now these measurements were either done manually or required a complicated software environment such as Autocad (Alessandri et al., 1996), Digital Image Processing System MIP 1.4 (MICROM) (Martinez &
Mantilla, 1995) or the SuperAmpelo software, also based on digital reconstruction and characterization (Soldavini
Corresponding author: gyorgy. bisztray@uni-corvinus
Aknowledgements: The authors would like to thank Maria Susette Melo and Konrad Pixner for their assistance and helpful discugsions during the calibration and testing of the GRA LED.
New Methodfor Determining Cultivars
et al., 2009). Martinez & Grenan (1999) made graphic reconstructions of grapevine leaves according to these measured characteristics.
The determination of leaf area is generally considered a basic measurement in grapevine research and normally provides information regarding the growth conditions and physiological status of the plant. Several direct and indirect methods can be applied to determine leaf area. For reviews about methods and devices, see Bréda (2003), Jonckheere
et al. (2004), Costenza et al. (2004) and Zheng & Moskal, (2009). In this study, direct leaf area measurement methods are examined. One of the earliest techniques for leaf area determination is the gravimetric method, which involves the correlation between the weight of a predetermined area of a leaf (LMA - leaf mass per area) and the weight of the whole lamina. The disadvantage of this technique is the variability of the leaf mass, which may cause inconsistent results.
Another gravimetric method is photo-gravimetric estimation, which is based on the correlation between the mass of the photocopy of a unit area and the weight of the photocopy of the object. This technique requires the same type (weight) of paper for all objects. For large quantities of measurements, laboratory instruments, such as the scanning planimeter Li- Cor Model: Li3 100 (Li-Cor Corp. Lincol, Nebrasca, USA) or PC-connected systems, like the WinDIAS2.0 colour conveyor image analyser (Delta-T Devices Ltd., Cambridge, UK), which can record images to a computer, can be used.
These techniques have proven themselves to be useful in grapevine research (Smith & Kliewer, 1984; Intrigliolo
et al., 2009) and in other fields of horticulture (Tsialtas &
Maslaris, 2007; Klamkowski & Treder, 2008). Caldas et al.
(1992) used a hand-scanner and pixel based software for the estimation of the area of grapevine leaves. According to their results, the digitalized leaf area measurement was less expensive and faster than traditional gravimetric and planimetric methods. Guisard & Birch (2005) used a flatbed scanner in their experiment for the digitalization of collected leaf samples. Individual leaf areas were estimated with the ImageTool3.0 (University of Texas Health Science Centre, San Antonio, Texas, USA). The evaluation of the scanned leaf area measurements were time consuming, but the ability to reuse and share the "samples" justified the time required.
The aim of this study was to develop pixel based software to enable easy and accurate detection ofdifferences (leaf area, angles between the veins, length of the veins etc.) between scanned leaf samples. The GRA.LE.D. (GRApevine LEaf Digitalization) software was developed at the Department of Automatization and Physics and the Department of Viticulture at the Corvinus University of Budapest, Hungary.
MATERIALS AND METHODS Description of the software
The GRA.LE.D. software was developed in C++
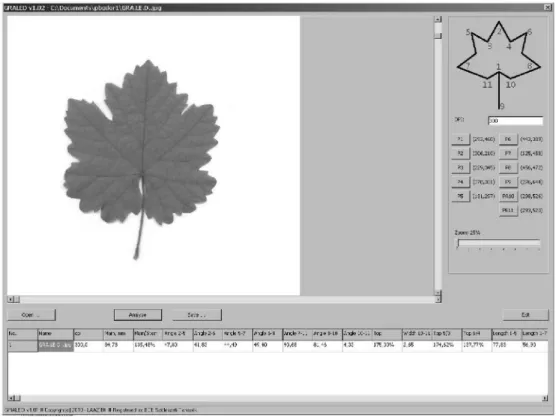
programming language using the C++ Builder 2007 rapid application development tool (Embarcadero Technologies, USA). A screenshot of the user interface is presented in Fig. 1. Images of leaves are processed against a white background. A white background was selected because it is the default colour for scanners and provides sufficient contrast with leaves.
Use of the software
Calculation is based primarily on the selection marks placed by the user (Fig. 2). Eleven specific locations along the perimeter of the leaf are used. Euclidean distances between these marks and the tangent of lines crossing the base point and vertices are calculated. Distances are expressed in mm utilizing the resolution (dpi) of acquisition. Angles between vertex directions are expressed in degrees. The visible leaf area (cm 2) is also calculated using an image processing routine. The automatic segmentation uses the global threshold, i.e. 86% of maximum intensity value. The summary report is saved in regular ASCII text files, which can be imported into spreadsheets and statistics applications.
The biometric data given by the GRA.LE.D. is shown in Table 1.
Calibration of the software
The area measurement setting of the GRA.LE.D. was calibrated and verified. For repeatability of the calibration, an ordinary credit card, with size 85.60 x 53.98 mm (3.370
x 2.125 in) (3 3/8 x 2 1/8 in), patented by the ISO/IEC 7810 standard as iD-i, was used to compare the GRA.LE.D. with the photo-gravimetric method and with two widely used laboratory instruments, the Li3100 (Li-Cor Corp. Lincol, Nebrasca, USA) and the WinDIAS2.0 (Delta-T Devices Ltd., Burwell, UK). The area of the card was measured 5 times with each instrument.
The digital calibration and measurement of the object was done with the ImageTool free image software (University of Texas Health Science Center at San Antonio).
Recently developed software offers image analysis functions such as distance, angle and gray scale measurements (area).
The object was digitalized by using a CanoScan4400 (Canon USA Inc.) desktop scanner with 300 dpi resolution.
Copies of the object for the photo-gravimetric measurements were made with an Aficio 2018 (NASHUA) copier, cut-out and weighed with an analytical balance. The weight of the cut-out pieces were normalized to the weight of 1cm2 of the same paper as provided by the manufacturers.
Testing of the software
GRA.LE.D. was tested on 50 grapevine leaf ( Vilis vinfera
L.) samples, obtained from the germplasm collection of the Department of Viticulture and Enology, University of Stellenbosch (Stellenbosch, South Africa). The aim of this study was to verify the sensitivity of the GRA.LE.D. to leaves with different sizes and shapes. For this, 50 samples were collected randomly from at least 30 varieties. It was not the aim of this study to take the age of the plant, the leaf position or the variety into account. Samples were exclusively collected to prove the area measurement sensitivity of the GRA.LE.D. compared to other laboratory instruments such as the Li3 100 and the WinDIAS2.0 according to the protocol of the manufacturers (Li-Cor, 1987; Delta-T Dev., 2009).
In addition, the leaves were scanned with the CanoScan4400, at 300 dpi. ImageTool and GRA.LE.D. were used to measure the area of each sample. The particular ampelometric measurements were also made using GRA.LE.D., referencing the 11 points on the digitalized leaves. The data was compared to the angles and lengths
7
I
4
(293,460) (443,309)
(306,210) (12E,458) (22c,345) (456,472)
(aOe,s3t) (276,644) (131,297) (298,126) (293,520)
EA
1±1-5 LqthL-7
FIGURE 1
Screenshot of the user interface of the GRA.LE.D.
measured with the ImageTool.
Photocopies of the 50 leaves were made with the Aficio 2018. Leaf shapes were cut out, weighed and normalized to the original weight of the paper (data not shown).
Graphic reconstruction
Graphic reconstructions of the leaves were made with the Microsoft Excel Chart Wizard. The veins were represented with a Radar Chart and the angles between the veins with a Pie Chart.
5
-\
/6
Statistics
Leaf area measurements made with the different instruments and software were compared and statistically analyzed with STATISTICA software (www.statsoft.com, Inc.).
RESULTS AND DISCUSSION Calibration
An ordinary credit card with unit area was measured with the forementioned techniques and the data compared (Table 2). The photo-gravimetric technique was slow and difficult, compared to the other methods. The Li3 100 and the WinDIAS2.0 needed less time for the measurements, but the accumulation of dirt on the recording surface may increase the actual leaf area being measured and therefore lead to inaccuracy. The measurements closest to the patented size of the card were given by the GRA.LE.D.
Leaf measurements
All 50 leaves were scanned (photocopied) using a CanoScan4400 scanner at 300 dpi resolution, the images cut out, measured and saved as JPEG files. Areas of the
-
8SO
11
I
t
FIGURE 2
The 11 specffic points on an average Vitis spp. leaf selected by the user of the GRA.LE.D. to calculate the biometric data
of the lamina.
New Methodfor Determining Cultivars
TABLE 1
The 23 biometric data points and the user-defined points on the lamina and the petiole in the GRA.LE.D. environment, with the relative OIV (2001) codes.
Ampelometric character The character estimated by the GRA.LE.D. code OW code Unit GRA.LE.D. according to the points
Leaf area Surface, cm2 065 cm2
Length
Main vein Ni 1-2 Main, mm 601 cm
Lateral veins N2 1-5 Length 1-5 602 cm
1-6 Lengthi-6
Lateral veins N3 1-7 Length 1-7 603 cm
1-8 Lengthi-8
Petiole sinus to upper leaf sinus 1-3 Length 1-3 605 cm
1-4 Lengthi-4
Petiole 1-9 Length 1-9 cm
Petiole sinus 1 - 10 Length 1-10 cm
i — il Lengthi-ii
Opening of petiole sinus 10— ii Width 10-11 cm
Ratios
Main vein/Petiole 1 —2:1 —9 Main/Stem 093 %
Lateral veins/Upper leaf sinus 1 —5:1 —3 Top 5/3 094 %
1-6:1-4 Top6/4
Angles
Main vein Ni/Lateral veins N2 1 - 2/1-5 Angle 2-5 degree
1-2/1-6 Angle
Lateral veins N2fLateral veins N3 1 -5/1-7 Angle 5-7 degree
1-6/1-8 Angle6-8
Lateral veins N3fPetiole sinus 1-7/1 - ii Angle 7-11 degree
boarder 1 - 8/i - 10 Angle 8-10
Opening angle of the petiole sinus 1 - 10/i - ii Angle 10-11 degree
TABLE 2
Validation of leaf area measurement of the GRA.LE.D. against commercial tools.
Regression model*
Instrument/Tool R2 RMSE AIC Durbm-Watson
Slope Intercept
Li3100 0.969 2.332 0.9989 1.561 48.52 2.649
ImageTool 0.996 0.132 0.9995 1.091 12.76 2.155
WinIDIAS2.0 0.759 -3.685 0.9087 11.747 250.37 2.503
Photoravimetrv 1.037 1.526 0.9972 2.676 102.43 2.017
*N50
digitalized leaves were measured using both the GRA.LE.D.
and the ImageTool software. In the case of the ImageTool, a threshold could be assigned to the leaf area. The GRA.LE.D.
does not have this option, but automatically detects the leaf area by the contrast difference between the light colour of the background and the darker colour of object. When a "gray border" was observed in the pictures after scanning, it was removed with Windows PhotoEditor.
The results showed that the GRA.LE.D. measurements correlated best with the leaf area of the 50 leaves, when compared to the 1,0100, the ImageTool and the photo- gravimetry. WindDIAS2.0 measured signfficantly lower areas for all samples (Fig. 3). The combined leaf area of the 50 leaves was 5217.81 cm2 (GRA.LE.D.); 5172.79 cm2 (1,0 100); 5204.26 cm2 (ImageTool); 5487.56 cm2 (photo- gravimetry) and 3774.63 cm2 (WindDIAS2.0), which proved that the GRA.LE.D. is as accurate in measuring leaf area as
other commonly used laboratory instruments (Table 2). In case of the WindDIAS2.0, the discrepancy highlighted the necessity of recalibration in order to get reliable results.
Graphic reconstruction
One average leaf was graphically reconstructed according to the results obtained by the GRA.LE.D. The data of the lengths of the veins and the angles between them were used to create the picture of the relevant leaf (Fig. 4).
CONCLUSIONS
The leaf area measurement not only proved the accuracy of the GRA.LE.D., but also highlighted the necessity of recalibration of leaf area measuring instruments. Graphic reconstruction of the leaves proved that the biometric data recorded by the GRA.LE.D. would be appropriate for the detection and description of differences between leaf
44,<
1972 7 7.6
5726
B4 46
73,04
55.41
New Method for Determining Cultivars 5
• LiCOR3100
f(x) = 0,9690285246x + 2,3316654813 R= 0,9989135112
• Image tool
f(x) = 0.9961372667x + 0.1323031697 R 2 = 0,99949691
V WinDias2.0
A Photogravirnetry
f(x) = 1 ,0370786977x + 1,5257263427 R= 0,9972168918
26C-
240
220
200
100
160
140
120
120
60
62
40
20
20 4D Co 6L, 1DO 120 14D 1D 1O 200 22D 240
FIGURE 3
Differences between the measured leaf area of 50 individual leaves and the correlation of the results from the different instruments with those obtained by using the GRA.LE.D.
4.47
FIGURE 4
An average grapevine leaf ( Vitis vinfera L.) and the graphic reconstruction of the lamina according to the data given by the GRA.LE.D, with the angles between the veins and the lengths of the veins.
samples. Morphological differences between leaves can be described with any long- and/or short-tenn experimental or commercial vineyard practices.
Digital ampelometry can also assist molecular genetic investigations, as reported by Parker and colleagues (2005) who used both ampelographic and molecular (SSR) makers to determine the connection between the 'Cynthiana' and it's supposed ancestor Vitis aestivalis Michx.
According to Ortiz et al. (2004) it is highly recommended to use both morphological and molecular markers to detect duplications, synonyms and homonyms in gennplasm
collections. In their study, morphological (e.g.: shape of the blade and length of the veins) and molecular (izoenzymes and SSR) markers were used together efficiently to determine the duplications in a Spanish gene bank during the establishment of the base collection.
Since the canopy is central to the performance of the grapevine, this software would greatly contribute to defining implications of canopy microclimate, physiological and viticultural performance of the vine and plant protection.
The GRA.LE.D. can be downloaded from the following website: http://www.laaz.hu/hu/szoftver/graled
6 New Methodfor Determining Cultivars
LITERATURE CITED MartI, C., Casanova, J., Montaner, C. & Badia, D., 2007. Ampelometric study of mature leaves from two indigenous Vitis cultivars grown in Alessandri, S., Vignozzi, N. & Vignini, A., 1996. AmpeloCADs Somontano de Barbastro. J. Wine Res. 17, 185-194.
(Ampelographic ComputerAided Digitizing System): An integrated system
Martinez, M.C. & Grenan, S., 1999. A graphic reconstruction method of an to digitize and process biometrical data from Vitisspp. Leaves. Am J. Enol.
Vitic. 47, 257-267. average vme leaf. Agronomie 19, 491-507.
Andrasovszky, J., 1926. Ampelographiai tanulmanyok. Az Ampelologiai Intézet Evkonyve. 8, 107-129.
Bica, D., Gay, G., Morando, A., Soave, E. & Bravdo, B.A., 2000. Effects of rootstock and Vitis yin ([era genotype on photosynthetic parameters. Acta Hort. 526, 373-379.
Bréda, N.J.J,. 2003. Ground-based measurements of leaf area index: A review of methods, instruments and current controversies. J. Exp. Bot. 54, 2403-2417.
Caldas, L.S., Bravo, C., Piccolo, H. & Faria, C.R.S.M., 1992. Measurement of leaf area with a hand-scanner linked to a microcomputer. R. Bras. Fifiol.
Veg. 4, 17-20.
Costenza P., Tisseyre B., Hunter JJ. & Deloire A., 2004. A non-destructive method for determining grapevine ( Vitis yin ([era L.) leaf area by means of shoot lenght. S. Afr. J. Enol. Vitic., 25, 43-47.
Delta-T Devices., 2009. WiriDJAS User Manual. Delta-T Devices Ltd.
Cambridge, UK. p 12.
Ferrini, F., Mattii, G.B. & Nicese, F.P., 1995. Effect of temperature on key physiological responses of grapevine leaf. Am. J. Enol. Vitic. 46, 375-379.
Gago, P., Santiago, J.L., Boso, S., Alonso-Villaverde, V. & Martinez, M.C., 2009. Grapevine ( 27tis yin ([era L.): Old varieties are reflected in work of art.
Econ. Bot. 63, 67-77.
Galet, P., 1988. Cepages et Vignobles De France. Imprimerie Paul Déhan, Montpellier. p 560.
Goethe, H., 1887. Handbuch der ampelographie. Graz. p280.
Guisard, Y. & Birch, C.J., 2005. Towards developing reliable models of leaf area on grapevines ( Vitis yin ([era L.). Information and Technology for Sustainable Fruit and Vegetable Production FRUTIC 05, 12-16 September 2005, Montpellier France. pp 305-314.
Intrigliolo , D.S., Lasko, A.N. & Piccioni, R.M. 2009. Grapevine cv.
'Riesling' water use in the northeastern United States. Irrig. Sci. 27, 253- 262.
Jonckheere, I., Fleck, S., Nackaerts, K., Muysa, B., Coppin, P., Weiss, M. &
Baret, F. 2004. Review of methods for in situ leaf area index determination Part I. Theories, sensors and hemispherical photography. Agricultural and Forest Meteorology 121, 19-35.
Klamkowski, K. & Treder, W., 2008. Response to drought stress of three strawberry cultivars grown under greenhouse conditions. J. Fruit and Ornamental P1. Res. 16, 179-188.
Li-Cor., 1987. LI-3100 Area Meter. Instruction Manual. Li-Cor, Inc.
Nebrasca, USA. p 33.
Martinez, M.C. & Mantilla, J.L.G., 1995. Moq,hological and yield comparison between Vitis yin ([era L. cv. Albariño grown from cuttings and from in vitro propagation. Am. J. Enol. Vitic. 46, 195-203.
Németh, M., 1966. Borszölöfajták határozókulcsa. Mezögazdasagi Kiadó.
Budapest. p240.
OW: 2001. Co'digo de los caracteres descriptivos de las variedades y especies de Vitis. Parte II. Descriptores ampelome'tricos, 4th ed. available online at: http://www.genres.de/eccdb/vitis/ (accessed March 2011).
Ortiz, J.M., MartIn, J.P., Borrego, J., Chavez, J., RodrIgez, I., Muñoz, G. &
Cabello, F., 2004. Molecular and moq,hological characterization of a Vitis gene bank for the establishment of a base collection. Gen. Res. Crop Evol.
51, 403-409.
Parker, L., Bordallo, P. & Colova, V., 2005. Tracing the pedigree of Cynthiana grape by DNA microsatellite markers. Proc. Fla. State. Hort. Soc.
118, 200-204.
Poni, S., Bernizzoni, F. & Civardi, 5., 2008. The effect of early leaf removal on whole-canopy gas exchange and vine performance of Vitis yin ([era L.
'Sangiovese'. Vitis. 47, 1-6.
Ravaz, L., 1902. Les Vignes Américaines: Porte-greffes et Producteurs Directs (Caractères, aptitudes). Coulet et Fils (Montpellier, France).
Santiago, J.L., Boso, S., Gago, P., Alonso-Villaverde, V. & Martinez, M.C., 2008. A contribution to maintenance of grapevine diversity: The rescue of Tinta Castañal ( Vitis yin ([era L.), a variety on edge of extinction. Sci. Hort.
116, 199-204.
Smith, R.J. & Kliewer, W.M., 1984. Estimation of Thompsom seedless grapevine leaf area. Am. J. Enol. Vitic. 35, 16-22.
Soldavini, C., Stefanini, M., Dallaserra, M., Policarpo, M. & Schneider, A., 2009. SuperAmpelo, a software for ampelometric and ampelographic descriptions in 'itis. ISHS Acta Horticulturae 827: IX. mt. Conf. on Grape Genetics and Breeding. Udine, Italy.
Truel, P., 1985. Catalogue des variétés de vigne en collection. Institut National de la Recherche Agronomique, Montpellier. p 129.
Tsialtas, J.T. & Maslaris, N., 2007. Leaf shape and its relationship with Leaf Area Index in a sugar beet (Beta vulgaris L.) cultivar. Photosynthetica. 45, 527-532.
Viala, P. & Vermorel, V., 1905. Ampelographie. Paris: Masson et Cie, Editeurs. p476.
Zheng, G. & Moskal, M., 2009. Retrieving Leaf Area Index (LA!) using remote sensing: theories, methods, sensors. Sensors 9, 2719-2745.