nanomaterials
Article
Electric and Photocatalytic Properties of Graphene Oxide Depending on the Degree of Its Reduction
LászlóPéter Bakos1 , L ˝orinc Sárvári1 , Krisztina László2 , János Mizsei3 , Zoltán Kónya4 , Gyula Halasi4 , Klára Hernádi4 , Anna Szabó4, Dániel Berkesi4, István Bakos5 and Imre Miklós Szilágyi1,*
1 Department of Inorganic and Analytical Chemistry, Budapest University of Technology and Economics, Szent Gellért tér 4, H-1111 Budapest, Hungary; laszlobakos@mail.bme.hu (L.P.B.);
sarvari.lorinc@gmail.com (L.S.)
2 Department of Physical Chemistry and Materials Science, Budapest University of Technology and Economics, Budafokiút 8. F. I. building, H–1111 Budapest, Hungary; klaszlo@mail.bme.hu
3 Department of Electron Devices, Budapest University of Technology and Economics, H-1117 Budapest, Hungary; mizsei@eet.bme.hu
4 Department of Applied and Environmental Chemistry, University of Szeged, Rerrich Béla tér 1, H-6720 Szeged, Hungary; konya@chem.u-szeged.hu (Z.K.); halasigy@chem.u-szeged.hu (G.H.);
hernadi@chem.u-szeged.hu (K.H.); szabo.anna@chem.u-szeged.hu (A.S.);
daniel.berkesi@chem.u-szeged.hu (D.B.)
5 Institute of Materials and Environmental Chemistry, Research Centre for Natural Sciences, Magyar tudósok körútja 2, H-1117 Budapest, Hungary; bakos.istvan@ttk.mta.hu
* Correspondence: imre.szilagyi@mail.bme.hu
Received: 13 October 2020; Accepted: 15 November 2020; Published: 22 November 2020
Abstract: When graphene oxide is reduced, the functional groups are released and the structure becomes more ordered. The degree of reduction might be tunable with the process parameters.
In our work, graphene oxide is prepared and the effect of thermal and chemical reduction is investigated. The samples are characterized with TG/DTA-MS, SEM-EDX, TEM, XPS, ATR-FTIR, Raman spectroscopy and XRD. Their electrical resistance, cyclic voltammetry and photocatalytic activity data are investigated. The conductivity can be varied by several orders of magnitude, offering a tool to match its electrical properties to certain applications. Low temperature reduction in air offers a material with the highest capacitance, which might be used in supercapacitors. The bare graphene oxide has considerably larger photocatalytic activity than P25 TiO2. Reduction decreases the activity, meaning that reduced graphene oxide can be used as an electron sink in composite photocatalysts, but does not contribute to the photocatalytic activity by itself.
Keywords: graphene oxide; reduced graphene oxide; photocatalysis; electrical resistance; cyclic voltammetry
1. Introduction
The graphene oxide (GO) is a widely studied nanostructured material, being the semiconducting derivative of the graphene. There are many methods to produce graphene oxide, and one of the most frequently used is the improved Hummers method, during which graphite is oxidized and exfoliated [1–3]. To partially restore the graphene structure, reduction can be utilized, chemically (usually with ascorbic acid, hydrazine or NaBH4) or thermally, and the resulting product is the reduced graphene oxide (RGO) [4–10]. By modifying the parameters (e.g., time, temperature, reagents) of these processes, the degree of reduction can be varied, which significantly influences the optical and electronic properties, because they mainly depend on the type and amount of the functional groups
Nanomaterials2020,10, 2313; doi:10.3390/nano10112313 www.mdpi.com/journal/nanomaterials
Nanomaterials2020,10, 2313 2 of 14
and heteroatoms present on the graphene, and the saturation of bonds. Regarding the n/p-type semiconductor characteristics of the RGO, if mostly electron-withdrawing (e.g., carboxyl, carbonyl) groups are present, the RGO will be p-type, and if electron-donating groups dominate (e.g., ether, epoxide), the result will be n-type RGO [11–14].
The conductivity of GO can be varied from the semiconductor GO to the highly conductive reduced GO. This makes them promising candidate materials for electrodes and for other applications, where it is important that their resistance values can be fitted properly. They can also be used in electrochemical energy storage as supercapacitors, i.e., the theoretical capacitance of monolayer graphene can be as high as 550 F g−1[15–18].
GO and RGO, like many other carbon nanostructures, are widely studied in photocatalysis as co-catalysts of semiconductors (e.g., TiO2, ZnO and Cu2O). Because of their beneficial properties, they improve the charge separation of the photogenerated electron–hole pairs, and sensitize the metal oxide to visible light through the metal–oxygen–carbon bond [19–25]. Although hundreds of articles and many reviews investigated the photocatalytic GO-based nanocomposites, only a few papers studied the photocatalytic activity of the bare GO and RGO. Graphene oxide has innate photocatalytic activity, similarly to many semiconducting carbon materials, although it has been studied in only a few reports in its bare form [26–29]. By utilizing reduction to the GO to varying degrees, the functional groups and heteroatoms can be partially removed, influencing the semiconductor properties, on which the photocatalytic activity heavily depends. RGO is also widely used in composite photocatalysts; however, there is little knowledge of its inherent photocatalytic performance.
In our study, the effect of thermal reduction on the graphene oxide was investigated. First, graphene oxide was prepared by the improved Hummers’ method, and different heat treatments (200, 300, and 900◦C) and atmospheres (air, nitrogen and argon/hydrogen) were used to reduce it.
The reduction process was followed by thermogravimetry/differential thermal analysis coupled with mass spectrometry (TG/DTA-MS). As well as this, one specimen was made by the chemical reduction of GO with ascorbic acid for reference. The samples were characterized with transmission and scanning electron microscopy (TEM and SEM) and energy dispersive X-ray spectroscopy (EDX), X-ray photoelectron spectroscopy (XPS), attenuated total reflection Fourier-Transform infrared (ATR-FTIR) and Raman spectroscopy and X-ray diffraction (XRD). To test for applications, their electrical resistances, cyclic voltammetric curves and photocatalytic activities were measured.
2. Materials and Methods
2.1. Preparation of the Graphene Oxide
Graphene oxide (GO) was prepared according to the modified Hummers’ method [30]. For 5 g natural graphite powder (Graphite Tyn, Taiyuan, China), 200 cm3cc. H2SO4, 25 cm3cc. H3PO4, and 25 g solid KMnO4were added (all reagents except the graphite were bought from Sigma-Aldrich, Darmstadt, Germany). The mixture was stirred for 15 min, while the temperature was held below 40◦C using water cooling. Afterwards, it was diluted with 500 cm3distilled water and cooled with ice, and the unreacted permanganate was neutralized with hydrogen peroxide (35%). After 12 h of sedimentation, the mixture was centrifuged at 6500 rpm for 5 min (Jouan BR4i Multifunction Centrifuge, Thermo Scientific, Waltham, MA, USA), then the upper part of the suspension was decanted, 1 M HCl was poured in, and this process was repeated five times. In the next step, the HCl was changed to distilled water with the same method, but, by utilizing 30, 60 and 120 min centrifuge times and at 9500 rpm, this time the decanted brown liquid was collected and reused after each step. The remaining black, unreacted graphite was removed. In the end, the viscous black graphene oxide suspension remained. For the further experiments, GO suspension was dried in an oven at 120◦C overnight, resulting in dried-out GO flakes.
Nanomaterials2020,10, 2313 3 of 14
2.2. Reduction of the Graphene Oxide
The graphene oxide was thermally reduced in a TA Instr. SDT 2960 simultaneous TG/DTA device (New Castle, DE, USA), in an open platinum crucible under 130 cm3min−1gas flow. Three different atmospheres were investigated: air (oxidizing), nitrogen (inert), 95%/5% argon–hydrogen mixture (reducing). The annealing conditions were the following:
• 2.5 mg GO, 10◦C min−1to 900◦C, (samples: GO-air 900◦C, GO-N2 900◦C, GO-H2 900◦C);
• 8 mg GO, 10◦C min−1to 200◦C, then 30 min isotherm section, (samples: GO-air 200◦C, GO-N2 200◦C, GO-H2 200◦C);
• 8 mg GO, 10◦C min−1to 200◦C, then 5◦C min−1to 300◦C, (samples: GO-air 300◦C, GO-N2 300◦C, GO-H2 300◦C).
To obtain chemically reduced graphene oxide (GO AA), 10 mg GO and 100 mg L-ascorbic acid were dispersed in 50 cm3distilled water in an ultrasonic bath, then the suspension was stirred for 3 h at room temperature [4]. The product then was centrifuged for 5 min at 6500 RPM several times, and finally dried in a heating cabinet at 120◦C for a night.
2.3. Characterization Methods
TG/DTA-MS measurements were conducted concurrently with the thermal reduction on the same device. The evolved gases during the heating were analyzed by using Balzers Instruments Thermostar GSD 200T quadruple mass spectrometer (MS) (Balzers, Liechtenstein) coupled to the TG/DTA instrument. The ion current of the species between 1 and 64 m/z were followed. SEM-EDX data were obtained by a JEOL JSM-5500LV scanning electron microscope (Tokyo, Japan) using 20 kV accelerating voltage in high vacuum mode. The average elemental composition from EDX data was calculated from three different measurements on each sample. TEM images were taken on a FEI Tecnai G2 20-TWIN transmission electron microscope (Hillsboro, OR, USA). The XPS spectra were made using a SPECS instrument equipped with a Phoibos 150 MCD-9 analyzer (Berlin, Germany). The X-ray source 150 W (14 kV) was Al Kαradiation at 40 eV pass energy and 0.3 s dwell time. CasaXPS software was used for data evaluation. The samples were pressed onto the surface of indium foil in order to prevent the additional increase in the C1s intensity. The ATR-FTIR were carried out on a Bruker Tensor 37 with a Specac Golden Gate ATR accessory (Billerica, MA, USA). Raman spectra were recorded on Jobin Yvon Labram Raman instrument equipped with an Olympus BX41 microscope using green laser with a wavelength of 532 nm (Edison, NJ, USA). XRD measurements were made on a PANalytical X’Pert Pro MPD X-ray diffractometer (Malvern, UK) with Cu Kαradiation.
Electrical resistance was measured by a Keithley 616 Digital Electrometer (Cleveland, OH, USA) in a custom-made measurement setup. The samples were put in a small screw hole in a polymer block, a screw was used to secure the samples to a copper plate on the other side, and the screw and plate served as electrodes, both of which were sputtered with 50 nm Au/Pd (Polaron Sputter Coater SC7020, Laughton, UK) (measurement setup: Figure S1). For the cyclic voltammetry (CV) tests, a suspension was made from the samples with water–isopropyl–alcohol (4:1) mixture (1 cm3for 1 mg sample), 4µL Nafion solution (DuPont™Nafion®PFSA Polymer Dispersions DE 520, Wilmington, DE, USA) was also given to 1 cm3suspension, and it was ultrasonicated for 30 min. A total of 15µL from this suspension was then dried on a glassy carbon electrode (d=5 mm). The measurements took place in a three-compartment electrochemical cell, and the reference electrode was hydrogen electrode, immersed in the same solution as the working electrode. The compartment of the working electrode was purged with argon gas (99.9995%) to remove air. The auxiliary electrode was a platinum plate. For the experiments, 0.5 M H2SO4solution was used, between 80 and 850 mV potential limits;
the sweep rate was 50 mV s−1. Photocatalysis was measured by putting 1 mg of the graphene oxide and reduced graphene oxide samples in cuvettes with 3 cm3 aqueous solution of methyl orange (c0=4*10−5M). The cuvettes were sealed, and were kept in the dark for 24 h so the adsorption equilibrium could occur. The next day, the cuvettes were placed between two Osram 18 W blacklight
Nanomaterials2020,10, 2313 4 of 14
lamps (Munich, Germany) (spectrum in Figure S2); the distance between them was 5 cm. After the irradiation started, the absorbance was measured every half hour for four hours using a Jasco V-550 UV-VIS spectrophotometer (Tokyo, Japan). The decomposition of the dye was followed by its most intensive peak at 464 nm.
3. Results and Discussion
3.1. Characterization
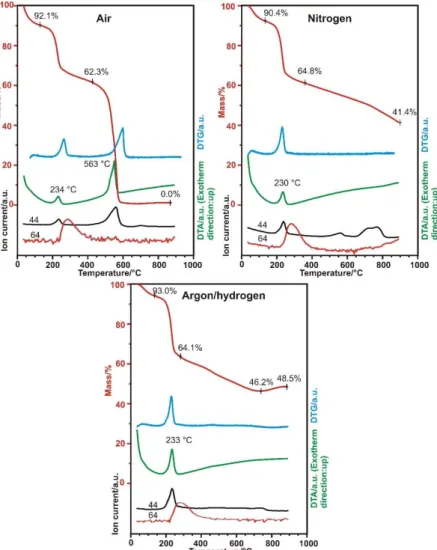
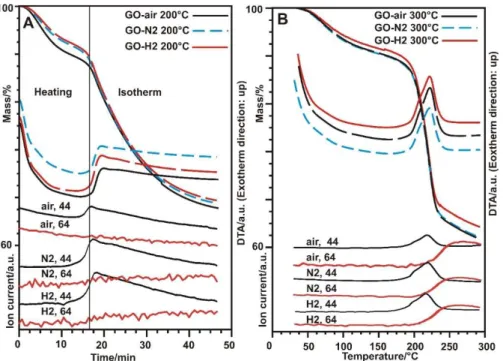
According to the TG/DTA-MS results in Figures1and2, the different atmospheres have a noticeable effect on the behavior of the GO. In the mass spectra, two ion currents belonging to CO2(at m/z=44) and SO2(at m/z=64) are shown. Around 200◦C, an exothermic decomposition step started, with the secession of CO2from the oxygen containing functional groups. No SO2evolution was detected when heated at this temperature and kept isotherm, only when heated at 300◦C. The SO2molecule came from the sulfate ester groups on the surface of the GO, which were created during the synthesis process [31]. In air at 563◦C, the sample started to burn, and fully burnt out at 600◦C. In nitrogen, the sample decomposed steadily, while in hydrogen a slight mass increase (~2%) happened above 700◦C, which is likely to result from the hydrogenation of the aromatic system [32]. For the heat treatments at 200 and 300◦C, an 8 mg sample was used to obtain more product, but the decomposition of the functional groups was very violent, causing the samples to explode out of the crucible, so the heating rate above 200◦C had to be lowered to 5◦C min−1[33].
Nanomaterials 2020, 10, x FOR PEER REVIEW 5 of 16
Figure 1. TG/DTA-MS measurements of the GO in different atmospheres to 900 °C (red: TG, blue:
DTG, green: DTA, ion currents: black: 44 m/z, red: 64 m/z).
Figure 1.TG/DTA-MS measurements of the GO in different atmospheres to 900◦C (red: TG, blue: DTG, green: DTA, ion currents: black: 44 m/z, red: 64 m/z).
Nanomaterials2020,10, 2313 5 of 14
Nanomaterials 2020, 10, x FOR PEER REVIEW 6 of 16
Figure 2. TG/DTA-MS measurements of the GO in different atmospheres to 200 °C (A) and 300 °C (B) (black: GO-air, blue: GO-N2, red: GO-H2, ion currents: black: 44 m/z, red: 64 m/z).
In the SEM and TEM images in Figures 3 and 4, the layered structure of the samples can be seen.
The heat treatments resulted in concise structures, and in the case of the SEM images, separate sheets were not visible, only agglomerates, which were, however, dismantled by sample preparation for the TEM, revealing the individual plates again. Reduction with ascorbic acid caused fragmentation (Figures 3H and 4B), because of the ultrasonication used to disperse the GO, but the plate-like structure was maintained.
Figure 3. SEM images of the GO (A), GO-air 200°C (B), GO-N2 200°C (C), GO-H2 200°C (D), GO-air 300°C (E), GO-N2 300°C (F), GO-H2 300°C (G), GO AA (H), GO-N2 900°C (I) and GO-H2 900°C (J).
Figure 2.TG/DTA-MS measurements of the GO in different atmospheres to 200◦C (A) and 300◦C (B) (black: GO-air, blue: GO-N2, red: GO-H2, ion currents: black: 44 m/z, red: 64 m/z).
In the SEM and TEM images in Figures3and4, the layered structure of the samples can be seen.
The heat treatments resulted in concise structures, and in the case of the SEM images, separate sheets were not visible, only agglomerates, which were, however, dismantled by sample preparation for the TEM, revealing the individual plates again. Reduction with ascorbic acid caused fragmentation (Figures3H and4B), because of the ultrasonication used to disperse the GO, but the plate-like structure was maintained.
Nanomaterials 2020, 10, x FOR PEER REVIEW 6 of 16
Figure 2. TG/DTA-MS measurements of the GO in different atmospheres to 200 °C (A) and 300 °C (B) (black: GO-air, blue: GO-N2, red: GO-H2, ion currents: black: 44 m/z, red: 64 m/z).
In the SEM and TEM images in Figures 3 and 4, the layered structure of the samples can be seen.
The heat treatments resulted in concise structures, and in the case of the SEM images, separate sheets were not visible, only agglomerates, which were, however, dismantled by sample preparation for the TEM, revealing the individual plates again. Reduction with ascorbic acid caused fragmentation (Figures 3H and 4B), because of the ultrasonication used to disperse the GO, but the plate-like structure was maintained.
Figure 3. SEM images of the GO (A), GO-air 200°C (B), GO-N2 200°C (C), GO-H2 200°C (D), GO-air 300°C (E), GO-N2 300°C (F), GO-H2 300°C (G), GO AA (H), GO-N2 900°C (I) and GO-H2 900°C (J).
Figure 3.SEM images of the GO (A), GO-air 200◦C (B), GO-N2 200◦C (C), GO-H2 200◦C (D), GO-air 300◦C (E), GO-N2 300◦C (F), GO-H2 300◦C (G), GO AA (H), GO-N2 900◦C (I) and GO-H2 900◦C (J).
Nanomaterials2020,10, 2313 6 of 14
Nanomaterials 2020, 10, x FOR PEER REVIEW 7 of 16
Figure 4. TEM images of the GO (A), GO AA (B), GO-air 200°C (C), GO-air 300°C (D), GO-N2 200°C (E), GO-N2 300°C (F) and GO-N2 900°C (G).
From the EDX spectra, the C/O ratio (Figure 5A) for the GO is around 3, meaning that the GO is considerably oxidized. After thermal reduction at 200 °C in all atmospheres, this ratio doubled, and increased further at 300 °C due to further reduction. At 900 °C in nitrogen and argon/hydrogen atmospheres, the remaining oxygen content was very low. In terms of C/O ratio, the sample chemically reduced with ascorbic acid is similar to the 200 °C thermal reduction. The sulfur content (Figure 5B) increased when heated to 200 °C, because only the oxygen-containing functional groups left the samples, as seen in the TG/DTA-MS results, and decreased with further annealing in all atmospheres, since the organosulfates decomposed as well [34]. In case of the GO AA, the sulfur content was negligible after the reduction with ascorbic acid [1].
Figure 5. C/O ratio (A) and sulfur content (B) of the samples from EDX measurements.
The XPS results are shown in Table 1, the survey spectra and the deconvoluted C1s and O1s peaks are presented in Figures S3–S5. After heat treatments, more carbon was present as sp2 instead of sp3, and the amount bonded to oxygen as C-O or C=O decreased as well, which indicates the restoration of the graphene structure. GO AA has a larger amount of sp3 carbon, due to the fragmentation of the plates caused by the ultrasonic treatment. The oxygen content decreased significantly with heat treatments; the largest decrease was observed in hydrogen at 300 °C, while it decreased less in air and the least in nitrogen. In the case of the sample heated in nitrogen at 300 °C, nitrogen was incorporated in the structure because its peak appeared in the XPS spectrum (Figure
Figure 4.TEM images of the GO (A), GO AA (B), GO-air 200◦C (C), GO-air 300◦C (D), GO-N2 200◦C (E), GO-N2 300◦C (F) and GO-N2 900◦C (G).
From the EDX spectra, the C/O ratio (Figure5A) for the GO is around 3, meaning that the GO is considerably oxidized. After thermal reduction at 200◦C in all atmospheres, this ratio doubled, and increased further at 300◦C due to further reduction. At 900◦C in nitrogen and argon/hydrogen atmospheres, the remaining oxygen content was very low. In terms of C/O ratio, the sample chemically reduced with ascorbic acid is similar to the 200◦C thermal reduction. The sulfur content (Figure5B) increased when heated to 200◦C, because only the oxygen-containing functional groups left the samples, as seen in the TG/DTA-MS results, and decreased with further annealing in all atmospheres, since the organosulfates decomposed as well [34]. In case of the GO AA, the sulfur content was negligible after the reduction with ascorbic acid [1].
Nanomaterials 2020, 10, x FOR PEER REVIEW 7 of 16
Figure 4. TEM images of the GO (A), GO AA (B), GO-air 200°C (C), GO-air 300°C (D), GO-N2 200°C (E), GO-N2 300°C (F) and GO-N2 900°C (G).
From the EDX spectra, the C/O ratio (Figure 5A) for the GO is around 3, meaning that the GO is considerably oxidized. After thermal reduction at 200 °C in all atmospheres, this ratio doubled, and increased further at 300 °C due to further reduction. At 900 °C in nitrogen and argon/hydrogen atmospheres, the remaining oxygen content was very low. In terms of C/O ratio, the sample chemically reduced with ascorbic acid is similar to the 200 °C thermal reduction. The sulfur content (Figure 5B) increased when heated to 200 °C, because only the oxygen-containing functional groups left the samples, as seen in the TG/DTA-MS results, and decreased with further annealing in all atmospheres, since the organosulfates decomposed as well [34]. In case of the GO AA, the sulfur content was negligible after the reduction with ascorbic acid [1].
Figure 5. C/O ratio (A) and sulfur content (B) of the samples from EDX measurements.
The XPS results are shown in Table 1, the survey spectra and the deconvoluted C1s and O1s peaks are presented in Figures S3–S5. After heat treatments, more carbon was present as sp2 instead of sp3, and the amount bonded to oxygen as C-O or C=O decreased as well, which indicates the restoration of the graphene structure. GO AA has a larger amount of sp3 carbon, due to the fragmentation of the plates caused by the ultrasonic treatment. The oxygen content decreased significantly with heat treatments; the largest decrease was observed in hydrogen at 300 °C, while it decreased less in air and the least in nitrogen. In the case of the sample heated in nitrogen at 300 °C, nitrogen was incorporated in the structure because its peak appeared in the XPS spectrum (Figure
Figure 5.C/O ratio (A) and sulfur content (B) of the samples from EDX measurements.
The XPS results are shown in Table1, the survey spectra and the deconvoluted C1s and O1s peaks are presented in Figures S3–S5. After heat treatments, more carbon was present as sp2 instead of sp3, and the amount bonded to oxygen as C-O or C=O decreased as well, which indicates the restoration of the graphene structure. GO AA has a larger amount of sp3 carbon, due to the fragmentation of the plates caused by the ultrasonic treatment. The oxygen content decreased significantly with heat treatments; the largest decrease was observed in hydrogen at 300◦C, while it decreased less in air and the least in nitrogen. In the case of the sample heated in nitrogen at 300◦C, nitrogen was incorporated
Nanomaterials2020,10, 2313 7 of 14
in the structure because its peak appeared in the XPS spectrum (Figure S6). The examined samples had sulfur content similar to the EDX values, and sulfur was not detectable for the GO AA with XPS as well.
Table 1.Deconvolution of the C1s peak and elemental composition from XPS spectra.
Sample
Deconvolution of C1s Peak/at. % Elemental Composition/at. % sp2 Graphitic
Carbon284.4 eV
sp3 Carbon 285.4 eV
C-O 286.8 eV
C=O 288.4 eV
O-C=O /Loss Feature
290.4 eV
C1s S2p O1s N1s
GO 5.38 44.3 31.8 13.2 5.35 67.2 0.3 32.5
GO AA 7.73 73.2 7.45 3.63 8.02 67.6 32.4
GO-air 300◦C 46.3 32.9 3.41 8.28 9.09 80.2 0.15 19.6
GO-N2 300◦C 48.8 26.9 7.86 5.21 11.2 78.6 0.34 20.3 0.74
GO-H2 300◦C 39.5 39.1 6.85 5.73 8.80 82.6 0.67 16.8
The ATR FTIR results are shown in Figure6. The O-H peak of the GO was barely visible after heating to 200◦C, and vanished for GO AA, or when the GO was heated to 300 or 900◦C. The intensity of the C=O peaks at 1750 cm−1 decreased slightly when heated to 300◦C, compared to the peaks at 200◦C, and completely disappeared at 900◦C with the further reduction. The C=C stretching at 1650 cm−1showed similar behavior to the previously mentioned C=O stretching, except this peak was not present for the GO AA. The C-O and S=O peak at 1100 cm−1decreased when annealed at 200◦C or was reduced chemically with ascorbic acid, and was not visible after any further heat treatment, in accordance with the XPS measurements. This confirms that at 200◦C, only oxygen-containing functional groups were released from the samples. A significant=C-H peak appeared at 900◦C in hydrogen atmosphere, which suggests, along with the TG/DTA-MS data, the hydrogenation of the aromatic rings.
Nanomaterials 2020, 10, x FOR PEER REVIEW 8 of 16
S6). The examined samples had sulfur content similar to the EDX values, and sulfur was not detectable for the GO AA with XPS as well.
Table 1. Deconvolution of the C1s peak and elemental composition from XPS spectra.
Sample
Deconvolution of C1s Peak/at. % Elemental Composition/at.
% sp2 Graphitic
Carbon 284.4 eV
sp3 Carbon 285.4 eV
C-O 286.8 eV
C=O 288.4 eV
O-C=O /Loss Feature 290.4 eV
C1s S2p O1s N1s
GO 5.38 44.3 31.8 13.2 5.35 67.2 0.3 32.5
GO AA 7.73 73.2 7.45 3.63 8.02 67.6 32.4
GO-air
300°C 46.3 32.9 3.41 8.28 9.09 80.2 0.15 19.6
GO-N2
300°C 48.8 26.9 7.86 5.21 11.2 78.6 0.34 20.3 0.74
GO-H2
300°C 39.5 39.1 6.85 5.73 8.80 82.6 0.67 16.8
The ATR FTIR results are shown in Figure 6. The O-H peak of the GO was barely visible after heating to 200 °C, and vanished for GO AA, or when the GO was heated to 300 or 900 °C. The intensity of the C=O peaks at 1750 cm-1 decreased slightly when heated to 300 °C, compared to the peaks at 200
°C, and completely disappeared at 900 °C with the further reduction. The C=C stretching at 1650 cm−1 showed similar behavior to the previously mentioned C=O stretching, except this peak was not present for the GO AA. The C-O and S=O peak at 1100 cm-1 decreased when annealed at 200 °C or was reduced chemically with ascorbic acid, and was not visible after any further heat treatment, in accordance with the XPS measurements. This confirms that at 200 °C, only oxygen-containing functional groups were released from the samples. A significant =C-H peak appeared at 900 °C in hydrogen atmosphere, which suggests, along with the TG/DTA-MS data, the hydrogenation of the aromatic rings.
Figure 6. ATR spectra of the samples with the peaks marked.
Figure 6.ATR spectra of the samples with the peaks marked.
Nanomaterials2020,10, 2313 8 of 14
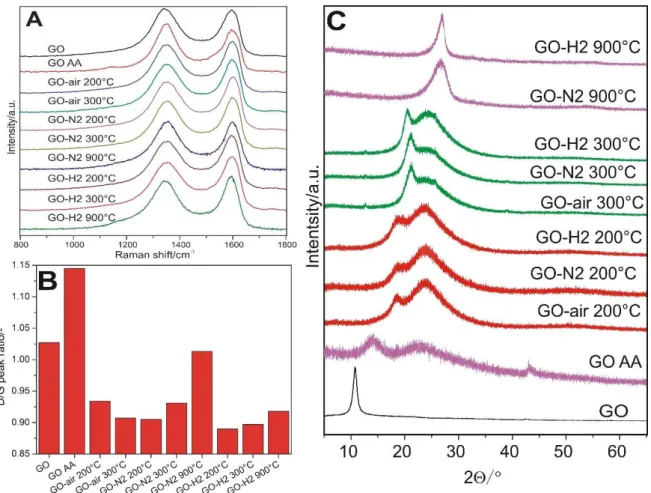
In the Raman spectra (Figure 7A), there are two characteristic peaks in the carbon, the D (~1350 cm−1) and G (~1600 cm−1) bands, whose intensity ratio gives information about the regularity of the structure (Figure7B). Compared to GO, in all cases of thermal reduction, the ID/IGratio was reduced, and the structure became more graphene-like. The ID/IGratio had its minimum when GO was heated at 300◦C in air and at 200◦C in nitrogen and hydrogen. However, then this ratio started to grow when annealing continued, particularly in nitrogen. When the GO was treated chemically with ascorbic acid, the ID/IGratio significantly increased, because the GO plates fragmented, as seen on the SEM and TEM results as well (Figures3H and4B).
Nanomaterials 2020, 10, x FOR PEER REVIEW 9 of 16
In the Raman spectra (Figure 7A), there are two characteristic peaks in the carbon, the D (~1350 cm−1) and G (~1600 cm−1) bands, whose intensity ratio gives information about the regularity of the structure (Figure 7B). Compared to GO, in all cases of thermal reduction, the ID/IG ratio was reduced, and the structure became more graphene-like. The ID/IG ratio had its minimum when GO was heated at 300 °C in air and at 200 °C in nitrogen and hydrogen. However, then this ratio started to grow when annealing continued, particularly in nitrogen. When the GO was treated chemically with ascorbic acid, the ID/IG ratio significantly increased, because the GO plates fragmented, as seen on the SEM and TEM results as well (Figures 3H and 4B).
Figure 7. Raman spectra (A), the intensity ratios of the carbon D/G peaks (B) and the XRD diffractograms (C) for the samples.
In the XRD diffractograms in Figure 7C, the characteristic 001 peak of the graphene oxide at 11°
shifted to the right with reduction, and two broad, overlapping peaks were visible at 18° and 24° at 200 °C, and at 21° and 25° when heated to 300 °C, which confirmed the formation of reduced graphene oxide sheets. At 900 °C, only one, the 002 peak, remained. The interlayer distance (in Table 2, calculated from the Bragg equation) of the GO (d001) decreased when heated to 300 from 200 °C.
However, the 002 spacing (d002) for reduced graphene oxide, along with the crystallite thickness (D002, from the Scherrer equation) and number of graphene layers (N = D002/d002), was similar at 200 and 300
°C, independently of the atmosphere used for both d001 and d002. In the case of GO AA, the d001 and d002 were the highest, and the D002 was the lowest, compared to thermally reduced samples, because GO AA was reduced to a lesser extent, and fragmentation occurred during ultrasonication [35,36].
When the GO was heated to 900 °C, the number of graphene layers increased, which is in conjunction with the Raman results.
Figure 7.Raman spectra (A), the intensity ratios of the carbon D/G peaks (B) and the XRD diffractograms (C) for the samples.
In the XRD diffractograms in Figure7C, the characteristic 001 peak of the graphene oxide at 11◦ shifted to the right with reduction, and two broad, overlapping peaks were visible at 18◦and 24◦at 200◦C, and at 21◦and 25◦when heated to 300◦C, which confirmed the formation of reduced graphene oxide sheets. At 900◦C, only one, the 002 peak, remained. The interlayer distance (in Table2, calculated from the Bragg equation) of the GO (d001) decreased when heated to 300 from 200◦C. However, the 002 spacing (d002) for reduced graphene oxide, along with the crystallite thickness (D002, from the Scherrer equation) and number of graphene layers (N=D002/d002), was similar at 200 and 300◦C, independently of the atmosphere used for both d001and d002. In the case of GO AA, the d001and d002were the highest, and the D002was the lowest, compared to thermally reduced samples, because GO AA was reduced to a lesser extent, and fragmentation occurred during ultrasonication [35,36]. When the GO was heated to 900◦C, the number of graphene layers increased, which is in conjunction with the Raman results.
Nanomaterials2020,10, 2313 9 of 14
Table 2.Different properties of the samples calculated from XRD measurements.
Sample d001/nm d002/nm D002/nm N/-
GO 0.81
GO AA 0.63 0.39 0.62 1.6
GO-air 200◦C 0.47 0.37 2.25 6.0
GO-N2 200◦C 0.47 0.37 2.13 5.7
GO-H2 200◦C 0.48 0.37 2.33 6.2
GO-air 300◦C 0.42 0.37 2.06 5.5
GO-N2 300◦C 0.42 0.37 2.25 6.0
GO-H2 300◦C 0.43 0.36 2.16 6.0
GO-N2 900◦C 0.34 2.58 7.7
GO-H2 900◦C 0.33 5.61 17.0
3.2. Application Studies
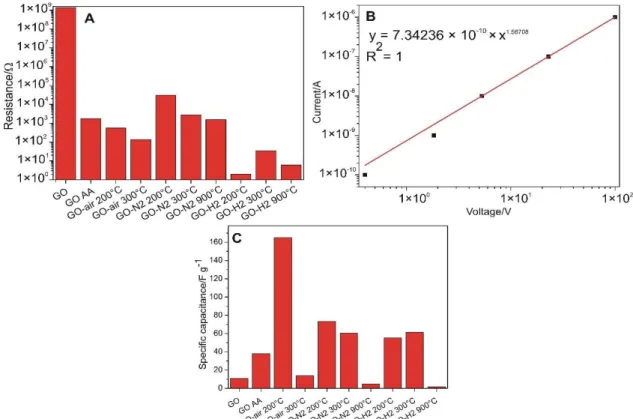
The measured electrical resistance (R) values are shown in Figure 8A. GO had its average resistance value around 1.3 GΩ. It did not behave according to Ohm’s law, as expected, being a semiconductor. The non-linearity can be approximated well by fitting to a power law expression (Figure8B). The conduction increased by orders of magnitude with the heat treatment. The samples reduced in air at 200 and 300◦C had their resistances below 1 kΩ. In nitrogen, the resistance was higher compared to air, i.e., the R was 30 kΩwhen annealed at 200◦C, and became 2.8 and 1.5 kΩwith further heating to 300 and 900◦C, respectively. The higher resistances in nitrogen may result from the fact that, on the one hand, in air atmosphere in the presence of oxygen, the surface groups could decompose more easily, and thus the reduction occurred to a higher extent. On the other hand, nitrogen was incorporated in the structure, as seen from XPS results, and its presence could increase the resistance.
For the GO reduced with diluted hydrogen, miniscule resistance (only a fewΩs) was measured independently of the used temperature. This indicates that the reduction process was immensely helped by the hydrogen atmosphere, as the restored graphene structure was a very good conductor.
The chemically reduced graphene oxide (GO AA) showed similar resistance to the GO-N2 900◦C sample. These results indicate that the conductivity of GO can be varied by six orders of magnitude, offering a tool to match the electrical properties to the certain applications, e.g., for materials and tools, which need high conductivity, graphene oxide should be reduced in hydrogen atmosphere.
Cyclic voltammetric curves are shown in Figure9. The estimated specific capacitances with H2SO4(Figure8C) were calculated from the charge measured between 200 and 700 mV during the positive polarization. The GO sample gave a larger signal than the reference glassy carbon, which increased slightly after reduction with ascorbic acid. In the case of air treatment at 200◦C, the value of the specific capacity increased to the largest of all, as it became 164.9 F g−1. Then, in air, it decreased at 300◦C to a value similar as the bare GO, probably due to compaction during the heat treatment.
Samples treated at 200 and 300◦C in nitrogen and hydrogen showed similar values; in nitrogen it was slightly higher at 200◦C, while in hydrogen it was larger at 300◦C. The curves of the samples treated at 900◦C hardly differ from the glassy carbon electrode. This suggests that the available electrochemical surface is very small, which may be due to compaction due to the high-temperature heat treatment.
In order to obtain a high capacitance of GO materials to be used in supercapacitors, treatment in air atmosphere and at mild temperatures should be used. Our record capacitance (GO-air 200◦C) result corroborates the work of Zhao et al., where a differently prepared graphene oxide treated at 200◦C showed the best performance [16].
NanomaterialsNanomaterials 2020, 10, x FOR PEER REVIEW 2020,10, 2313 11 of 16 10 of 14
Figure 8. Measured resistance values for the samples (A), the current-voltage relationship for the bare GO (B) and the specific capacitances calculated from the cyclic voltammograms obtained in 0.5 M H2SO4 (C).
Cyclic voltammetric curves are shown in Figure 9. The estimated specific capacitances with H2SO4 (Figure 8C) were calculated from the charge measured between 200 and 700 mV during the positive polarization. The GO sample gave a larger signal than the reference glassy carbon, which increased slightly after reduction with ascorbic acid. In the case of air treatment at 200 °C, the value of the specific capacity increased to the largest of all, as it became 164.9 F g−1. Then, in air, it decreased at 300 °C to a value similar as the bare GO, probably due to compaction during the heat treatment.
Samples treated at 200 and 300 °C in nitrogen and hydrogen showed similar values; in nitrogen it was slightly higher at 200 °C, while in hydrogen it was larger at 300 °C. The curves of the samples treated at 900 °C hardly differ from the glassy carbon electrode. This suggests that the available electrochemical surface is very small, which may be due to compaction due to the high-temperature heat treatment. In order to obtain a high capacitance of GO materials to be used in supercapacitors, treatment in air atmosphere and at mild temperatures should be used. Our record capacitance (GO- air 200°C) result corroborates the work of Zhao et al., where a differently prepared graphene oxide treated at 200 °C showed the best performance [16].
Figure 8.Measured resistance values for the samples (A), the current-voltage relationship for the bare GO (B) and the specific capacitances calculated from the cyclic voltammograms obtained in 0.5 M H2SO4(C).
Nanomaterials 2020, 10, x FOR PEER REVIEW 12 of 16
Figure 9. Cyclic voltammetry measurements for the samples in 0.5 M H2SO4. (A: samples GO and GO AA, B: samples in air, C: samples in nitrogen, D: sample in argon/hydrogen)
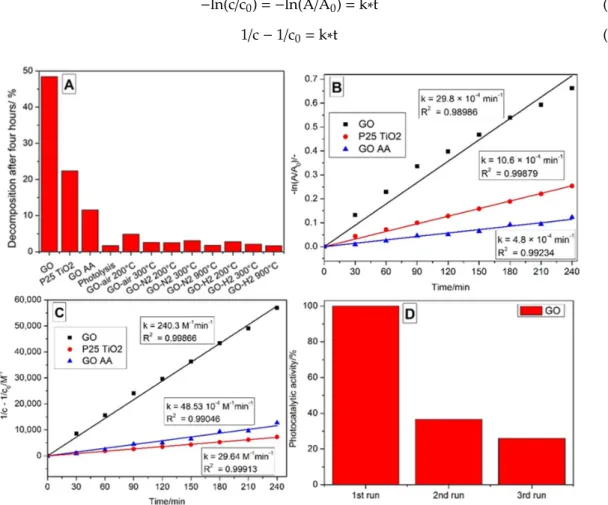
The photocatalytic activity of the bare GO is considerable. It decomposed almost half of the methyl orange dye after four hours of illumination (Figure 10A), which was more than two times better performance than the reference P25 titania. This high activity can be explained by the higher specific surface area of the GO compared to the P25, and the enhanced light absorption because of its black color (Figure S7). The reduction decreased the activity in the case of all samples, however, the thermal reduction affected it far more significantly. The reduced activity can be explained by the increased conductivity through the restored graphene-like structure, and the loss of functional groups de-emphasizes the semiconductor characteristics. This process is beneficial when RGO is used in conjunction with a semiconductor oxide because the reduced graphene oxide can act as an electron sink, but the reduction inhibits its innate photocatalytic properties. The difference between the activity of the chemically and thermally reduced GO is related to the regularity of the structure and the number of defects. While during the thermal reduction the samples aggregated because of the restacking, in the case of chemical reduction, the fragmentation caused a higher surface area, less regular structure and was the least reduced sample. Comparing the thermally reduced samples, it can be seen that the lowest activity comes from the 300 °C reduction in hydrogen, while the highest comes from 200 °C reduction in air, but all of them portray considerably lower photocatalytic activity than bare GO. The GO, GO AA and P25 TiO2 samples followed a Langmuir–Hinshelwood mechanism during the photocatalysis (Figure 10B), which is indicated by the goodness of fitted line to the assumed pseudo first-order kinetics (Equation (1)). The behavior could be approximated by second-order kinetics (Figure 10C) as well (Equation (2)), with slightly better fitting [37–39]. The current and starting concentration of the dye is c and c0, respectively, A and A0 is the measured and starting absorbance, k is the reaction rate constant and t is time, and the Lambert–Beer law holds true for these concentrations. The repeatability measurements for the GO on Figure 10D show that after consecutive experiments on the same sample, the activity decreases.
−ln(c/c0) = −ln(A/A0) = k*t (1)
Figure 9.Cyclic voltammetry measurements for the samples in 0.5 M H2SO4. (A) samples GO and GO AA, (B) samples in air, (C) samples in nitrogen, (D) sample in argon/hydrogen.
The photocatalytic activity of the bare GO is considerable. It decomposed almost half of the methyl orange dye after four hours of illumination (Figure10A), which was more than two times
Nanomaterials2020,10, 2313 11 of 14
better performance than the reference P25 titania. This high activity can be explained by the higher specific surface area of the GO compared to the P25, and the enhanced light absorption because of its black color (Figure S7). The reduction decreased the activity in the case of all samples, however, the thermal reduction affected it far more significantly. The reduced activity can be explained by the increased conductivity through the restored graphene-like structure, and the loss of functional groups de-emphasizes the semiconductor characteristics. This process is beneficial when RGO is used in conjunction with a semiconductor oxide because the reduced graphene oxide can act as an electron sink, but the reduction inhibits its innate photocatalytic properties. The difference between the activity of the chemically and thermally reduced GO is related to the regularity of the structure and the number of defects. While during the thermal reduction the samples aggregated because of the restacking, in the case of chemical reduction, the fragmentation caused a higher surface area, less regular structure and was the least reduced sample. Comparing the thermally reduced samples, it can be seen that the lowest activity comes from the 300◦C reduction in hydrogen, while the highest comes from 200◦C reduction in air, but all of them portray considerably lower photocatalytic activity than bare GO. The GO, GO AA and P25 TiO2samples followed a Langmuir–Hinshelwood mechanism during the photocatalysis (Figure10B), which is indicated by the goodness of fitted line to the assumed pseudo first-order kinetics (Equation (1)). The behavior could be approximated by second-order kinetics (Figure10C) as well (Equation (2)), with slightly better fitting [37–39]. The current and starting concentration of the dye is c and c0, respectively, A and A0is the measured and starting absorbance, k is the reaction rate constant and t is time, and the Lambert–Beer law holds true for these concentrations. The repeatability measurements for the GO on Figure10D show that after consecutive experiments on the same sample, the activity decreases.
−ln(c/c0)=−ln(A/A0)=k∗t (1)
1/c−1/c0=k∗t (2)
Nanomaterials 2020, 10, x FOR PEER REVIEW 13 of 16
1/c − 1/c0 = k*t (2)
Figure 10. Decomposed amount of methyl orange dye during the photocatalytic experiments (A), pseudo first order (B) and second order (C) linear fitting for the GO, GO AA and P25 TiO2 samples, and photocatalytic activity of the GO after repeated measurements (D).
4. Conclusions
By annealing the graphene oxide made with Hummers’ method, at 200 °C, only the oxygen- containing functional groups decompose, while the sulfur-containing ones remain, which are only released when heated above this temperature. From 700 to 900 °C in a partial hydrogen atmosphere, the sample weight increased by 2%, signaling hydrogenation of the aromatic rings, which was confirmed by a relatively high ATR peak for =C-H. The ultrasonication used for the chemical reduction in GO with ascorbic acid fragmented the graphene oxide plates, while the heat treatments resulted in tight structures, which were reflected in the SEM and TEM images. According to EDX, XPS, ATR-FTIR, Raman and XRD measurements, due to the thermal and chemical reduction, the GO transformed into RGO; however, the used reduction parameters strongly affected the composition, functional groups and bonds in the samples.
The electrical resistance measurements show that the conductivity of GO can be varied with the treatment, offering a tool to match its electrical properties to the certain applications. The electrical conductivity increased by orders of magnitude after any reduction, most notably under hydrogen atmosphere.
The specific capacitances of the GO and RGO samples were estimated from cyclic voltammetric curves. Low temperature reduction (200 °C) in air offers the RGO material with the highest capacitance, with a tempting value (164.9 F g−1) to be used in a supercapacitor application. Based on our studies, in order to obtain a high capacitance of GO materials to be used in supercapacitors, treatment of GO in air atmosphere and at mild temperatures should be applied.
Figure 10. Decomposed amount of methyl orange dye during the photocatalytic experiments (A), pseudo first order (B) and second order (C) linear fitting for the GO, GO AA and P25 TiO2samples, and photocatalytic activity of the GO after repeated measurements (D).
Nanomaterials2020,10, 2313 12 of 14
4. Conclusions
By annealing the graphene oxide made with Hummers’ method, at 200 ◦C, only the oxygen-containing functional groups decompose, while the sulfur-containing ones remain, which are only released when heated above this temperature. From 700 to 900◦C in a partial hydrogen atmosphere, the sample weight increased by 2%, signaling hydrogenation of the aromatic rings, which was confirmed by a relatively high ATR peak for=C-H. The ultrasonication used for the chemical reduction in GO with ascorbic acid fragmented the graphene oxide plates, while the heat treatments resulted in tight structures, which were reflected in the SEM and TEM images. According to EDX, XPS, ATR-FTIR, Raman and XRD measurements, due to the thermal and chemical reduction, the GO transformed into RGO; however, the used reduction parameters strongly affected the composition, functional groups and bonds in the samples.
The electrical resistance measurements show that the conductivity of GO can be varied with the treatment, offering a tool to match its electrical properties to the certain applications. The electrical conductivity increased by orders of magnitude after any reduction, most notably under hydrogen atmosphere.
The specific capacitances of the GO and RGO samples were estimated from cyclic voltammetric curves. Low temperature reduction (200◦C) in air offers the RGO material with the highest capacitance, with a tempting value (164.9 F g−1) to be used in a supercapacitor application. Based on our studies, in order to obtain a high capacitance of GO materials to be used in supercapacitors, treatment of GO in air atmosphere and at mild temperatures should be applied.
According to photocatalysis tests, the bare graphene oxide shows a significant photocatalytic effect in decomposing methyl orange dye under UV light irradiation, more than two times better than the commonly used P25 TiO2reference. Reduction by ascorbic acid impaired the photocatalytic properties and, after thermal treatment, considerably less activity remained because most of the functional groups broke off. According to these, RGO can be used as a beneficial electron sink in composite photocatalysts, but it does not contribute to the photocatalytic activity by itself.
Supplementary Materials:The following are available online athttp://www.mdpi.com/2079-4991/10/11/2313/s1, Figure S1: Schematic picture of the electrical resistance measurement setup, Figure S2: Spectrum of the UV lamp used for the photocatalytic experiments, Figure S3: XPS survey spectra for five samples, Figure S4: Deconvolution of the C1s peaks for five samples, Figure S5: Deconvolution of the O1s peaks for five samples, Figure S6: N1s peak for sample GO-N2 300◦C, Figure S7: UV-Vis reflectance spectra for GO, GO AA and P25 TiO2.
Author Contributions:L.P.B. contributed to the design of the experiments, characterization, analysis of the data and writing the manuscript; L.S. contributed to the synthesis and characterization; K.L. contributed to the synthesis process, J.M. contributed to the electrical resistance measurements; Z.K. and G.H. contributed to the XPS, K.H., A.S. and D.B. contributed to the TEM, I.B. contributed to the cyclic voltammetry; I.M.S. supervised the work.
All authors have read and agreed to the published version of the manuscript.
Funding:A GINOP-2.2.1-15-2017-00084, an NRDI K 124212 and an NRDI TNN_16 123631 grants are acknowledged.
The work performed within project VEKOP-2.3.2-16-2017-00013 was supported by the European Union and the State of Hungary, co-financed by the European Regional Development Fund. The research reported in this paper was supported by the BME Nanotechnology and Materials Science TKP2020 IE grant of NKFIH Hungary (BME IE-NAT TKP2020).
Acknowledgments:The authors are grateful to György Bosznai (Department of Physical Chemistry and Materials Science, Budapest University of Technology and Economics, Budapest, Hungary) for the help with synthesis of the graphene oxide, and to Tamás Igricz (Department of Organic Chemistry and Technology, Budapest University of Technology and Economics, Budapest, Hungary) for making the Raman and ATR-FTIR measurements.
Conflicts of Interest: The authors declare no conflict of interest. The funders had no role in the design of the study; in the collection, analyses, or interpretation of data; in the writing of the manuscript, or in the decision to publish the results.
Nanomaterials2020,10, 2313 13 of 14
References
1. Justh, N.; Berke, B.; László, K.; Szilágyi, I.M. Thermal analysis of the improved Hummers’ synthesis of graphene oxide.J. Therm. Anal. Calorim.2018,131, 2267–2272. [CrossRef]
2. Park, S.; Ruoff, R.S. Chemical methods for the production of graphenes.Nat. Nanotechnol.2009,4, 217–224.
[CrossRef]
3. Geim, A.K. Graphene: Status and Prospects.Science2009,324, 1530–1534. [CrossRef] [PubMed]
4. Zhang, J.; Yang, H.; Shen, G.; Cheng, P.; Zhang, J.; Guo, S. Reduction of graphene oxide via L-ascorbic acid.
Chem. Commun.2010,46, 1112–1114. [CrossRef] [PubMed]
5. Mathkar, A.; Tozier, D.; Cox, P.; Ong, P.; Galande, C.; Balakrishnan, K.; Leela Mohana Reddy, A.; Ajayan, P.M.
Controlled, Stepwise Reduction and Band Gap Manipulation of Graphene Oxide.J. Phys. Chem. Lett. 2012,3, 986–991. [CrossRef] [PubMed]
6. Wang, Z.; Xu, D.; Huang, Y.; Wu, Z.; Wang, L.-M.; Zhang, X.-B. Facile, mild and fast thermal-decomposition reduction of graphene oxide in air and its application in high-performance lithium batteries.Chem. Commun.
2012,48, 976–978. [CrossRef] [PubMed]
7. Ong, W.-J.; Tan, L.-L.; Chai, S.-P.; Yong, S.-T.; Mohamed, A.R. Surface charge modification via protonation of graphitic carbon nitride (g-C3N4) for electrostatic self-assembly construction of 2D/2D reduced graphene oxide (rGO)/g-C3N4 nanostructures toward enhanced photocatalytic reduction of carbon dioxide to methane.
Nano Energy2015,13, 757–770. [CrossRef]
8. Abdolhosseinzadeh, S.; Asgharzadeh, H.; Seop Kim, H. Fast and fully-scalable synthesis of reduced graphene oxide.Sci. Rep.2015,5, 10160. [CrossRef]
9. Kong, W.; Kum, H.; Bae, S.-H.; Shim, J.; Kim, H.; Kong, L.; Meng, Y.; Wang, K.; Kim, C.; Kim, J. Path towards graphene commercialization from lab to market.Nat. Nanotechnol.2019,14, 927–938. [CrossRef]
10. Fernández-Merino, M.J.; Guardia, L.; Paredes, J.I.; Villar-Rodil, S.; Solís-Fernández, P.; Martínez-Alonso, A.;
Tascón, J.M.D. Vitamin C Is an Ideal Substitute for Hydrazine in the Reduction of Graphene Oxide Suspensions.
J. Phys. Chem. C2010,114, 6426–6432. [CrossRef]
11. Guerrero-Contreras, J.; Caballero-Briones, F. Graphene oxide powders with different oxidation degree, prepared by synthesis variations of the Hummers method.Mater. Chem. Phys.2015,153, 209–220. [CrossRef]
12. Velasco-Soto, M.A.; Pérez-García, S.A.; Alvarez-Quintana, J.; Cao, Y.; Nyborg, L.; Licea-Jiménez, L. Selective band gap manipulation of graphene oxide by its reduction with mild reagents. Carbon2015,93, 967–973.
[CrossRef]
13. Hunt, A.; Kurmaev, E.Z.; Moewes, A. Band gap engineering of graphene oxide by chemical modification.
Carbon2014,75, 366–371. [CrossRef]
14. Tu, N.D.K.; Choi, J.; Park, C.R.; Kim, H. Remarkable Conversion Between n- and p-Type Reduced Graphene Oxide on Varying the Thermal Annealing Temperature.Chem. Mater.2015,27, 7362–7369. [CrossRef]
15. Chen, L.; Tang, Y.; Wang, K.; Liu, C.; Luo, S. Direct electrodeposition of reduced graphene oxide on glassy carbon electrode and its electrochemical application.Electrochem. Commun.2011,13, 133–137. [CrossRef]
16. Zhao, B.; Liu, P.; Jiang, Y.; Pan, D.; Tao, H.; Song, J.; Fang, T.; Xu, W. Supercapacitor performances of thermally reduced graphene oxide.J. Power Sources2012,198, 423–427. [CrossRef]
17. El-Kady, M.F.; Shao, Y.; Kaner, R.B. Graphene for batteries, supercapacitors and beyond.Nat. Rev. Mater.
2016,1, 16033. [CrossRef]
18. Wu, H.; Zhang, Y.; Cheng, L.; Zheng, L.; Li, Y.; Yuan, W.; Yuan, X. Graphene based architectures for electrochemical capacitors.Energy Storage Mater.2016,5, 8–32. [CrossRef]
19. Xiang, Q.; Yu, J.; Jaroniec, M. Graphene-based semiconductor photocatalysts. Chem. Soc. Rev. 2012,41, 782–796. [CrossRef]
20. Tong, H.; Ouyang, S.; Bi, Y.; Umezawa, N.; Oshikiri, M.; Ye, J. Nano-photocatalytic Materials: Possibilities and Challenges.Adv. Mater.2012,24, 229–251. [CrossRef]
21. Leary, R.; Westwood, A. Carbonaceous nanomaterials for the enhancement of TiO2 photocatalysis.Carbon 2011,49, 741–772. [CrossRef]
22. Khalid, N.R.; Majid, A.; Tahir, M.B.; Niaz, N.A.; Khalid, S. Carbonaceous-TiO2 nanomaterials for photocatalytic degradation of pollutants: A review.Ceram. Int.2017,43, 14552–14571. [CrossRef]
23. Kavitha, T.; Gopalan, A.I.; Lee, K.-P.; Park, S.-Y. Glucose sensing, photocatalytic and antibacterial properties of graphene–ZnO nanoparticle hybrids.Carbon2012,50, 2994–3000. [CrossRef]
Nanomaterials2020,10, 2313 14 of 14
24. Wang, A.; Li, X.; Zhao, Y.; Wu, W.; Chen, J.; Meng, H. Preparation and characterizations of Cu2O/reduced graphene oxide nanocomposites with high photo-catalytic performances.Powder Technol.2014,261, 42–48.
[CrossRef]
25. Sharma, M.; Behl, K.; Nigam, S.; Joshi, M. TiO2-GO nanocomposite for photocatalysis and environmental applications: A green synthesis approach.Vacuum2018,156, 434–439. [CrossRef]
26. Li, X.; Yu, J.; Wageh, S.; Al-Ghamdi, A.A.; Xie, J. Graphene in Photocatalysis: A Review. Small2016,12, 6640–6696. [CrossRef] [PubMed]
27. Justh, N.; Berke, B.; László, K.; Bakos, L.P.; Szabó, A.; Hernádi, K.; Szilágyi, I.M. Preparation of graphene oxide/semiconductor oxide composites by using atomic layer deposition.Appl. Surf. Sci.2018,453, 245–251.
[CrossRef]
28. Yeh, T.F.; Syu, J.M.; Cheng, C.; Chang, T.H.; Teng, H. Graphite oxide as a photocatalyst for hydrogen production from water.Adv. Funct. Mater.2010,20, 2255–2262. [CrossRef]
29. Velasco, L.F.; Carmona, R.J.; Matos, J.; Ania, C.O. Performance of activated carbons in consecutive phenol photooxidation cycles.Carbon2014,73, 206–215. [CrossRef]
30. Marcano, D.C.; Kosynkin, D.V.; Berlin, J.M.; Sinitskii, A.; Sun, Z.; Slesarev, A.; Alemany, L.B.; Lu, W.; Tour, J.M.
Improved Synthesis of Graphene Oxide.ACS Nano2010,4, 4806–4814. [CrossRef]
31. Eigler, S.; Dotzer, C.; Hof, F.; Bauer, W.; Hirsch, A. Sulfur Species in Graphene Oxide.Chem. A Eur. J.2013, 19, 9490–9496. [CrossRef] [PubMed]
32. Whitener, K.E. Review Article: Hydrogenated graphene: A user’s guide. J. Vac. Sci. Technol. A2018,36, 05G401. [CrossRef]
33. Qiu, Y.; Guo, F.; Hurt, R.; Külaots, I. Explosive thermal reduction of graphene oxide-based materials:
Mechanism and safety implications.Carbon2014,72, 215–223. [CrossRef] [PubMed]
34. Eigler, S. Controlled Chemistry Approach to the Oxo-Functionalization of Graphene.Chem. A Eur. J.2016, 22, 7012–7027. [CrossRef] [PubMed]
35. Hun, S. Thermal Reduction of Graphene Oxide. InPhysics and Applications of Graphene-Experiments; InTech:
Rijeka, Croatia, 2011.
36. Wang, K.; Pang, J.; Li, L.; Zhou, S.; Li, Y.; Zhang, T. Synthesis of hydrophobic carbon nanotubes/reduced graphene oxide composite films by flash light irradiation.Front. Chem. Sci. Eng.2018,12, 376–382. [CrossRef]
37. Tang, C.-H.; Chen, K.-Y.; Chen, C.-Y. Solution-processed ZnO/Si based heterostructures with enhanced photocatalytic performance.New J. Chem.2018,42, 13797–13802. [CrossRef]
38. Tang, C.-H.; Hsiao, P.-H.; Chen, C.-Y. Efficient Photocatalysts Made by Uniform Decoration of Cu2O Nanoparticles on Si Nanowire Arrays with Low Visible Reflectivity. Nanoscale Res. Lett. 2018, 13, 312.
[CrossRef]
39. Hsiao, P.-H.; Li, T.-C.; Chen, C.-Y. ZnO/Cu2O/Si Nanowire Arrays as Ternary Heterostructure-Based Photocatalysts with Enhanced Photodegradation Performances.Nanoscale Res. Lett.2019,14, 244. [CrossRef]
Publisher’s Note:MDPI stays neutral with regard to jurisdictional claims in published maps and institutional affiliations.
©2020 by the authors. Licensee MDPI, Basel, Switzerland. This article is an open access article distributed under the terms and conditions of the Creative Commons Attribution (CC BY) license (http://creativecommons.org/licenses/by/4.0/).