Neuropharmacology 192 (2021) 108612
Available online 21 May 2021
0028-3908/© 2021 The Author(s). Published by Elsevier Ltd. This is an open access article under the CC BY-NC-ND license
(http://creativecommons.org/licenses/by-nc-nd/4.0/).
N,N-Dimethyltryptamine attenuates spreading depolarization and restrains neurodegeneration by sigma-1 receptor activation in the ischemic rat brain
´ Irisz Szab ´ o
a, Vikt oria ´ E. Varga ´
a, Szabolcs Dvor ´ acsk ´ o
b,c, Attila E. Farkas
d, Tímea K orm ¨ ¨ oczi
c,e, R ´ obert Berkecz
c,e, Szilvia Kecsk ´ es
a, Akos Menyh ´ ´ art
a, Rita Frank
a, D ora Hantosi ´
a,
Nicholas V. Cozzi
f,g, Ede Frecska
h, Csaba T omb ¨ oly ¨
b, Istv ´ an A. Krizbai
d,i, Ferenc Bari
a, Eszter Farkas
a,*aDepartment of Medical Physics and Informatics, Faculty of Medicine and Faculty of Science and Informatics, University of Szeged; Kor´anyi Fasor 9, Szeged, 6720, Hungary
bLaboratory of Chemical Biology, Institute of Biochemistry, Biological Research Centre, Temesv´ari Krt 62, Szeged, 6726, Hungary
cDepartment of Medical Chemistry, Faculty of Medicine, University of Szeged, D´om T´er 8, Szeged, 6720, Hungary
dNeurovascular Unit Research Group, Molecular Neurobiology Research Unit, Institute of Biophysics, Biological Research Centre, Temesv´ari Krt 62, Szeged, 6726, Hungary
eInstitute of Pharmaceutical Analysis, Faculty of Pharmacy, University of Szeged, Somogyi U 4, Szeged, 6720, Hungary
fNeuropharmacology Laboratory, University of Wisconsin School of Medicine and Public Health, 1300 University Avenue, Madison, WI 53706, USA
gAlexander Shulgin Research Institute, 1483 Shulgin Road, Lafayette, CA, 94549, USA
hDepartment of Psychiatry, Faculty of Medicine, University of Debrecen, Nagyerdei Krt 94, Debrecen, 4032, Hungary
iInstitute of Life Sciences, UVVG, 94 Bulevardul Revoluției, Arad, 310025, Romania
A R T I C L E I N F O Keywords:
N,N-Dimethyltryptamine Cerebral ischemia Sigma-1 receptor Spreading depolarization Stroke
A B S T R A C T
Dimethyltryptamine (DMT), an endogenous ligand of sigma-1 receptors (Sig-1Rs), acts against systemic hypoxia, but whether DMT may prevent cerebral ischemic injury is unexplored. Here global forebrain ischemia was created in anesthetized rats and aggravated with the induction of spreading depolarizations (SDs) and subse- quent short hypoxia before reperfusion. Drugs (DMT, the selective Sig-1R agonist PRE-084, the Sig-1R antagonist NE-100, or the serotonin receptor antagonist asenapine) were administered intravenously alone or in combi- nation while physiological variables and local field potential from the cerebral cortex was recorded. Neuro- protection and the cellular localization of Sig-1R were evaluated with immunocytochemistry. Plasma and brain DMT content was measured by 2D-LC-HRMS/MS. The affinity of drugs for cerebral Sig-1R was evaluated with a radioligand binding assay. Both DMT and PRE-084 mitigated SDs, counteracted with NE-100. Further, DMT attenuated SD when co-administered with asenapine, compared to asenapine alone. DMT reduced the number of apoptotic and ferroptotic cells and supported astrocyte survival. The binding affinity of DMT to Sig-1R matched previously reported values. Sig-1Rs were associated with the perinuclear cytoplasm of neurons, astrocytes and microglia, and with glial processes. According to these data, DMT may be considered as adjuvant pharmaco- logical therapy in the management of acute cerebral ischemia.
1. Introduction
N,N-Dimethyltryptamine (DMT) is a natural indole alkaloid found in
plants (e.g. Psychotria viridis and Diplopterys cabrerana) and is known for its psychedelic effects when ingested by humans as spiritual medicine or with recreative purposes (e.g. ayahuasca brew) (Luna, 2011). Importantly, DMT has also been identified as an endogenous trace amine in mammalian
* Corresponding author. Department of Medical Physics and Informatics Faculty of Medicine, and Faculty of Science and Informatics University of Szeged, Kor´anyi fasor 9, H-6720, Szeged, Hungary.
E-mail addresses: szabo.irisz@med.u-szeged.hu (´I. Szabo), ´ varga.viktoria.eva.22@gmail.com (V.´E. Varga), dvoracsko.szabolcs@brc.hu (S. Dvor´acsk´o), farkas.
attilae@brc.mta.hu (A.E. Farkas), kormoczi.timea@med.u-szeged.hu (T. K¨orm¨oczi), berkecz.robert@szte.hu (R. Berkecz), szilvikecskes84@gmail.com (S. Kecsk´es), menyhartakos89@gmail.com (A. Menyh´ ´art), ritafrank993@gmail.com (R. Frank), dora.hantosi@gmail.com (D. Hantosi), cozzi@wisc.edu (N.V. Cozzi), efrecska@hotmail.com (E. Frecska), tomboly.csaba@brc.hu (C. T¨omb¨oly), krizbai.istvan@brc.mta.hu (I.A. Krizbai), bari.ferenc@med.u-szeged.hu (F. Bari), farkas.eszter.1@med.u-szeged.hu (E. Farkas).
Contents lists available at ScienceDirect
Neuropharmacology
journal homepage: www.elsevier.com/locate/neuropharm
https://doi.org/10.1016/j.neuropharm.2021.108612
Received 20 January 2021; Received in revised form 23 April 2021; Accepted 13 May 2021
tissues (e.g. lung, pineal gland, brain) (Christian et al., 1977; Mandel et al., 1977; Barker et al., 2013) and body fluids (urine, blood plasma and ce- rebrospinal fluid) (Barker et al., 2012). The actual production of DMT from the amino acid tryptophan in mammalian tissues is supported by the (co-)localization of the enzymes aromatic-L-amino acid decarboxylase (AADC) and indolethylamine-N-methyltransferase (INMT) implicated in DMT biosynthesis (Mavlyutov et al., 2012; Carbonaro and Gatch, 2016;
Dean et al., 2019). DMT, however, is rapidly biodegraded by monoamine oxidases (MAO), which may be the reason for the very low endogenous DMT concentration measured (e.g. ng/mL or ng/g tissue). Still, DMT may be encapsulated in neurotransmitter storage vesicles at concentrations regarded to be pharmacologically relevant (Carbonaro and Gatch, 2016).
The physiological and pathophysiological role of endogenous DMT has been the subject of ongoing debate and speculations. Psychedelic and behavioral effects (Jenner et al., 1978), a potential role in psychi- atric disorders (Daumann et al., 2010) and altered states of conscious- ness (Strassman, 2001) have all been attributed to naturally occurring DMT. Besides all of these elusive associations, investigators have recently turned their attention to the prospective general tissue pro- tective (Frecska et al., 2013), and specific neuroprotective potential of the substance (Szabo et al., 2016; Nardai et al., 2020). DMT has been claimed to be produced at increased concentration in the rodent brain when exposed to environmental stress delivered by electrical shock (Barker et al., 1981). More importantly, the DMT content of the rat brain was found elevated after experimental cardiac arrest (Dean et al., 2019).
Recently, DMT was shown to protect human primary iPSC-derived cortical neurons against hypoxia, coincident with the reduction of hypoxia-inducible factor-1 (HIF-1) expression and function (Szabo et al., 2016). Further, DMT injected intraperitoneally limited infarct size in a rodent model of focal cerebral ischemia, and facilitated the recovery of motor function following ischemic injury (Nardai et al., 2020). Finally, DMT was suggested to achieve notable anti-inflammatory effects (Szabo et al., 2014), because the serum levels of pro-inflammatory cytokines (TNF-α, IL-1β, IL-6) were found to be decreased in the presence of DMT in the above rat focal cerebral ischemia model (Nardai et al., 2020).
The pharmacological mechanisms of DMT action have been exten- sively explored, revealing a complex interaction with numerous signaling pathways including biogenic amine receptors, (Ray, 2010), uptake transporters (Blough et al., 2014), and trace amine-associated receptors (Bunzow et al., 2001). In addition, fundamental evidence has been gathered that DMT acts as an endogenous sigma-1 receptor (Sig-1R) agonist (Fontanilla et al., 2009). Sig-1Rs are intracellular
receptors localized to the segment of the endoplasmic reticulum (ER) membrane, which is apposed to the mitochondrial outer membrane (the mitochondria-associated ER membrane, MAM). Via precise molecular machinery, Sig-1Rs control Ca2+ trafficking between the MAM and mitochondria, regulate the expression of specific potassium channels, suppress the generation of reactive oxygen species, and ultimately promote cell survival under stress (Hayashi, 2015; Penke et al., 2018). A wealth of experimental data suggests that Sig-1R activation yields neuroprotection in ischemic stroke. For example, fluvoxamine, a potent antidepressant with high affinity for Sig-1R has been demonstrated to suppress ER stress-related apoptosis, reduce infarct size after focal ce- rebral ischemia, and alleviate ischemia-linked motor dysfunction in mice (Omi et al., 2014; Sato et al., 2014). These results have been confirmed by increased apoptotic neuronal death in Sig-1R knockout mice exposed to global forebrain ischemia, and the suppression of ischemia-induced apoptosis in wild-type mice by the administration of PRE-084, a selective Sig-1R agonist pharmacon (Zhao et al., 2019).
Coincidentally, a significant upregulation of Sig-1R has been linked to the ischemic penumbra (Zhang et al., 2017). Collectively, these data are highly suggestive that Sig-1R activation may be exploited for the pur- pose of ischemic neuroprotection.
Here we set out to explore whether DMT administration achieves neuroprotection via Sig-1R activation in the acute phase of experi- mental, transient, cerebral forebrain ischemia, which we aggravated by the recurrent induction of spreading depolarizations (SD) (Somjen, 2001) and a subsequent transient hypoxic episode. We have chosen to induce SDs and an episode of anoxia superimposed on global cerebral ischemia to increase the metabolic stress to a level which may cause acute neurodegeneration and is relevant to observe DMT action. Inci- dentally, SD initiates the fission of the ER (the intracellular host of Sig-1Rs), which may serve as a target of neuroprotection (Kurcharz and Lauritzen, 2018). The physiological impact of administered DMT was evaluated by the assessment of cerebral blood flow (CBF) variations and the characteristic features of SD, a neurophysiological phenomenon that had been recognized to accelerate the conversion of the ischemic pen- umbra to the infarcted region (Hartings et al., 2017). Furthermore, SD is a relevant target of investigation in the context of neuroprotection, because SD inhibition has been repeatedly proposed as an effective approach for tissue salvage in brain injury (Carlson et al., 2018, 2020;
Klass et al., 2018; Varga et al., 2020). As a final point in our experiments, DMT-related neuroprotection was evaluated with comprehensive his- tological examination.
Abbreviations
2D-LC-HRMS/MS two-dimensional liquid chromatography coupled to quadrupole-Orbitrap mass spectrometry
2VO two vessel occlusion 4-HNE 4-hydroxynonenal 5-HTR serotonin receptor
AADC aromatic-L-amino acid decarboxylase aCSF artificial cerebrospinal fluid ANOVA analysis of variance ATP adenosine triphosphate AUC area under the curve BSA bovine serum albumin CBF cerebral blood flow CC3 cleaved caspase 3 DAB diaminobenzidine DC direct current DG dentate gyrus DMSO dimethyl sulfoxide DMT N,N-dimethyltryptamine
EDTA ethylenediamine tetraacetic acid ECoG electrocorticogram
ER endoplasmic reticulum GFAP glial fibrillary acidic protein HIF-1 hypoxia-inducible factor 1
Iba-1 ionized calcium-binding adapter protein INMT indolethylamine N-methyltransferase i.m. intramuscular
i.v. intravenous
LDF laser-Doppler flowmetry MABP mean arterial blood pressure
MAM mitochondria-associated ER membrane MAO monoamine oxidase
NeuN neuronal nuclear protein NMDA N-methyl-D-aspartate PBS phosphate buffered saline PFA paraformaldehyde SD spreading depolarizations Sig-1R Sigma-1 receptor TBS Tris-buffered saline
To confirm the role of Sig-1Rs in the DMT-linked effects, we measured the binding affinity of DMT to Sig-1Rs in rat brain tissue and we evaluated the response to DMT in the presence of the selective Sig-1R agonist PRE-084 or the Sig-1R antagonist NE-100. To discriminate the potential contribution of serotonin receptors to DMT-related effects, asenapine, an antagonist of a wide range of serotonin receptors (Shadid et al., 2009), was applied alone, or in combination with DMT. Next, to confirm that DMT infused over the experimental protocol accumulated in the blood and brain to a pharmacologically relevant concentration, we determined the DMT content in these tissues with an analytical chemical method (K¨orm¨oczi et al., 2020). Finally, we confirmed the co-localization of Sig-1Rs with neurons, astrocytes and microglia cells, as potential cellular targets of DMT treatment.
2. Materials and methods
The ethical approach conformed to previously reported guidelines (Szabo et al., 2019; M. T´ oth et al., 2020; Varga et al., 2020), and the ´ experiments are reported in compliance with the ARRIVE guidelines (Kilkenny et al., 2010). The experimental procedures were approved by the National Food Chain Safety and Animal Health Directorate of Csongr´ad County, Hungary. The procedures were performed according to the guidelines of the Scientific Committee of Animal Experimentation of the Hungarian Academy of Sciences (updated Law and Regulations on Animal Protection: 40/2013. (II. 14.) Gov. of Hungary), following the EU Directive 2010/63/EU on the protection.
The animals were housed according to standrad conditions reported earlier (Szab´o et al., 2019; M. T´oth et al., 2020; Varga et al., 2020).
Young adult, male Sprague-Dawley rats (Charles River Laboratories, 340 ±37 g, n =69) were used in this study. Standard rodent chow and tap water were supplied ad libitum. The animals were housed under constant temperature, humidity, and lighting conditions (23∘C, 12:12 h light/dark cycle, lights on at 7 a.m.).
The estimation of sample size adhered to previously applied princi- ples (Szab´o et al., 2019; Varga et al., 2020). The designed rate of the seven groups of the in vivo experiment (untreated and treated) was 1.
The necessary number of animals in each group was at least 6 to support 80% power (β =20% risk of second species), which was calculated based on the standard deviation of electrophysiological and hemodynamic parameters in earlier studies and the presumed differences between the means of groups. The calculations and statistical analyses were con- ducted in SPSS version 20 (Vanderbilt University, U.S.A.) and were also run in GPower 3.1 (Heinrich Heine University of Düsseldorf, Germany).
2.1. Surgical procedures
The preparation has followed previously establihsed guidelines (Szabo et al., 2019; Varga et al., 2020). On the day of the experiments, ´ animals were anesthetized with 1.5–2% isoflurane in N2O:O2 (3:2), and were allowed to breathe spontaneously through a head cone during surgical interventions (n =56). Body temperature was kept at 37.2 ◦C by a feedback controlled heating pad (Harvard Apparatus, Holliston, MA, U.S.A.). In order to avoid the production of airway mucus, atropine was administered (0.1%, 0.05 mL; i.m.) shortly before surgical procedures.
The left femoral artery was cannulated for blood sampling and the continuous monitoring of mean arterial blood pressure and heart rate (MABP, Mikro-Tip BP Foundation System, ADInstruments, Australia).
The adjacent femoral vein was also cannulated for the administration of drugs.
Actual surgical procedures have also replicated previously estab- lished methods (Szabo et al., 2019; ´ Varga et al., 2020). For the later initiation of incomplete global forebrain ischemia, a midline incision was made in the neck and both common carotid arteries were carefully separated from the vagal nerves. Lidocaine (1%) was administered topically before opening the skin and each tissue layer underneath. A surgical thread used as occluder was looped around each artery for the
later occlusion. All rats were placed prone in a stereotaxic apparatus.
The skin above the skull and the temporal muscle were retracted from the underlying left parietal and temporal bones. Two cranial windows (~3 ×3 mm) 1 mm apart were prepared over the right parietal cortex (3 mm from bregma and 5 mm lateral from the sagittal suture) (Fig. 1). A high-precision electrical drill (ProLab Basic, Bien Air 810, Switzerland) was used to thin the bone under saline cooling, and the remaining soft bone layer was gently peeled away to reveal the dura surface. The dura was then carefully opened in each craniotomy. The rostral window was later used for data acquisition (i.e. electrophysiology and CBF mea- surement) while the caudal window served SD elicitation (Fig. 1). The cranial windows were constantly kept moist by artificial cerebrospinal fluid (aCSF; mM concentrations: 126.6 NaCl, 3 KCl, 1.5 CaCl2, 1.2 MgCl2, 24.5 NaHCO3, 6.7 urea, 3.7 glucose bubbled with 95% O2 and 5% CO2 to achieve a constant pH of 7.4).
2.2. Recording of electrophysiological variables
Electrophysiological data were acquired as reported earlier (Szab´o et al., 2019; Varga et al., 2020). For the acquisition of the electrocorti- cogram (ECoG) and slow cortical or direct current (DC) potential, a saline-filled (120 mM NaCl) glass capillary microelectrode (20 μm outer tip diameter) was inserted 700 μm deep into the right somatosensory cortex. An Ag/AgCl reference electrode was implanted under the skin of the animal’s neck. The electrophysiological signals were recorded via a high input impedance pre-amplifier (NL102GH, NeuroLog System, Digitimer Ltd., United Kingdom), connected to a differential amplifier (NL106, NeuroLog System, Digitimer Ltd., United Kingdom) with asso- ciated filter (ECoG filtered in wideband scale: 0.5–35 Hz, DC filtered in DC mode; <0.5 Hz) and conditioner systems (NL125, NL144, NL530, NeuroLog System, Digitimer Ltd., United Kingdom). Line frequency noise (50 Hz) was removed by a high-quality noise eliminator (HumBug, Quest Scientific Instruments Inc., Canada). The electrical signals along with MABP were digitalized at a sampling frequency of 2 kHz by a PowerLab data acquisition device (ADInstruments, Australia) controlled through a dedicated software written in LabChart 8 (ADInstruments, Australia).
2.3. Monitoring of local cerebral blood flow
CBF measurements were conducted as reported earlier (Szab´o et al., 2019). Laser-Doppler flowmetry (LDF) was used to record changes in local CBF with ischemia/reperfusion, and associated with SD events. A laser-Doppler needle probe (Probe 403 connected to PeriFlux 5000;
Perimed AB, Sweden) was positioned above the parietal cortex. The ideal position of the LDF probe was identified prior to the actual experimental protocol: the probe was positioned over the region where the baseline perfusion varied closely around 300 perfusion units (PFU), as near as possible to the tip of the glass microcapillary, and avoiding visible pial blood vessels. The LDF signal was digitalized and acquired, together with the DC potential and ECoG, essentially as described above.
2.4. Pharmacological treatment
All drugs were dissolved in physiological saline, administered at a dose of 1 mg/kg/h (Maurice et al., 1995; Ghanbari et al., 2009; Sato et al., 2014; Nardai et al., 2020), and infused through the left femoral vein continuously throughout the experimental protocol (Fig. 1).
Although DMT has poor solubility in aqueous media, intensive vortexing at 37 ◦C resulted in a transparent solution at the low concentration used.
The concentration of the DMT solution was 0.18 mg/mL (0.956 mM).
The following treatments were applied: DMT (Lipomed AG, Switzerland) alone (n =7), the highly selective Sig-1R agonist PRE-084 (Sigma-Aldrich, U.S.A.) alone (n =8), the selective Sig-1R antagonist NE-100 (Sigma-Aldrich, U.S.A.) alone (n =6) or in combination with DMT (n =6), and the non-subtype specific serotonin receptor (5-HTR)
antagonist asenapine (Sigma-Aldrich, U.S.A.) alone (n =6) or in com- bination with DMT (n =6). Vehicle (i.e. physiological saline) served as control for the treatments (n =7). NE-100 and DMT or asenapine and DMT were used in combination to test the receptor-specificity of DMT.
2.5. Experimental protocol
The experimental protocol was initiated 30–60 min after completion of the preparation. After a baseline period (5 min), cerebral ischemia was induced by the occlusion of both common carotid arteries (two vessel occlusion: 2VO). Successful 2VO was confirmed by a sharp drop of CBF below 50% of baseline, as reported earlier (Menyh´art et al., 2017;
Szab´o et al., 2019). Ischemia induction was not followed by spontaneous SD occurrence, probably because the hypoperfusion threshold to trigger SD (Menyh´art et al., 2017) was not reached. The administration of DMT, PRE-084, or vehicle was initiated through the femoral vein immediately after completion of the ischemia induction, with the aid of a micro- injector syringe pump (CMA/100 Micro Injection Pump, Carnegie Medicin, Sweden). Due to the dead volume in the tubing, it could have taken a few minutes before the DMT solution actually reached the brain.
Since the common carotid arteries had been occluded by that time, blood flow compensation from the posterior supplying vessels was ex- pected to be the route of drug delivery to the brain. Residual CBF during ischemia varied around 40% (see: Results – Physiological variables), which was considered sufficient for drug delivery. In the case of DMT co-application with NE-100 or asenapine, the infusion of NE-100 or asenapine began 10 min before ischemia induction to act on receptors before DMT application. The intravenous (i.v.) infusion of the drugs was continuous and maintained until the end of the experiment.
As further metabolic challenge superimposed on ischemia, three SD events were triggered at an inter-SD interval of at least 15 min with a 1 M KCl-soaked cotton ball placed on the cortex in the caudal craniotomy (Farkas et al., 2011), starting 10 min after 2VO onset (Fig. 1). The cotton ball was removed and the craniotomy rinsed with aCSF after each SD event. After the three SDs had subsided, the ischemic insult was further aggravated by an episode of transient hypoxia (maximum of 1 min) achieved by the controlled withdrawal of O2 from the anesthetic gas mixture. The duration of hypoxia had been determined in pilot experi- ments. Longer episodes of hypoxia caused the failure of cardiac function, therefore we adjusted hypoxia duration according to the tolerance of each animal: hypoxia was maintained in the presented experimental protocol as long as arterial pressure (monitored continuously live) was stable enough for prospective recovery from the insult. The hypoxic
episode was followed by reoxygenation and the prompt release of the common carotid arteries to afford cerebral reperfusion for another hour.
2.6. Immunocytochemistry
Immunolabeling followed procedures that are in routine use in our lab (M. Toth et al., 2020; Varga et al., 2020). For all staining protocols, ´ antibody specificity was confirmed by performing the staining in the absence of the primary antibody in the solution prepared for the primary incubation step. Naïve (n =3), and vehicle- or DMT-treated rats exposed to the full experimental protocol (i.e. 2 h after ischemia induction and 1 h after reperfusion induction; n =4/4) were transcardially perfused with ice-cold physiological saline followed by 4% paraformaldehyde (PFA) under deep anesthesia (5%, i.p., 500 mg/kg). The brains were removed, stored in 4% PFA at 4 ◦C overnight, and cryoprotected in 30%
sucrose in phosphate buffered saline (PBS). Coronal, 20 μm thick fore- brain sections were cut with a freezing microtome (Leica CM, 1860 UV, Leica, Germany).
Apoptotic cell death was characterized with permanent immunocy- tochemical staining of cleaved caspase-3 (CC3), ferroptotic injury by 4- hydroxinonenal (4-HNE), whereas neuronal loss was identified with the neuron marker neuronal nuclear protein (NeuN), and astrocyte damage with the astrocyte marker glial fibrillary acidic protein (GFAP) on selected coronal slices (bregma +1, − 3 and − 6 mm, Paxinos and Watson atlas coordinates; three slices per plane). Microglial activation was detected with ionized calcium-binding adapter protein (Iba-1) immu- nohistochemistry. In all cases, endogenous peroxidases were blocked with 5% H2O2, nonspecific protein-binding sites were blocked with 5%
normal goat serum (Merck, Kenilworth, U.S.A.), and slices were per- meabilized with 0.5% Triton X-100 (Merck, Kenilworth, U.S.A.) in Tris- buffered saline (TBS). Slices were incubated with rabbit anti-CC3 (Abcam, ab13847, 1:300), mouse anti-4-HNE (Abcam, ab48506, 1:100), rabbit anti-NeuN (Abcam, ab177487, 1:300), mouse anti-GFAP (Abcam, ab4648, 1:1000) or rabbit anti Iba-1 (Wako, #019–19741, 1:3000) overnight at 4 ◦C. The subsequent steps of incubation included an enhancer reagent for 1 h at room temperature, and horseradish- peroxidase-linked secondary antibody for 3 h at room temperature, both being components of the Polink-2 Plus HRP Detection Kit (for rabbit or mouse primary antibody with diaminobenzidine (DAB) chro- mogen, D39–18 for rabbit and D37-18 for mouse, GBI Labs, U.S.A.). The staining was visualized with DAB. The slices were mounted on micro- scopic slides with Eukit® (Merck, U.S.A.) and photomicrographs were obtained with a Nikon-DS Fi3 camera attached to a Leica DM 2000 Led Fig. 1. Graphical illustration of the experimental protocol. a, In the preparation, black circles indicate the position of the two open cranial windows (3 mm caudal from bregma and 5 mm lateral from the sagittal suture), created for the recording of the electrocorticogram (ECoG), direct current (DC) potential and cerebral blood flow (CBF) with laser-Doppler flowmetry (rostral window) and the experimental elicitation of spreading depolarizations (SD) with KCl (caudal window). b, The schematic drawing illustrates the subsequent phases of the experimental protocol. After the initiation of global forebrain ischemia, the i.v. infusion of either of the Sig-1R agonists (DMT or PRE-084) or their vehicle was initiated and maintained until the termination of the experiment. When the Sig-1R or the serotonin receptor (5-HTR) antagonists NE-100 or asenapine were applied, their i.v. infusion was initiated before ischemia onset. Subsequently, SDs were triggered at the ipsilateral cerebral cortex, then O2 was partially and briefly withdrawn from the anesthetic gas mixture to aggravate ischemia further by transient hypoxia. After an hour of reperfusion, the brains were removed under deep anesthesia for histological examination. Arterial blood samples were collected repeatedly ( ) for blood gas analysis and the measurement of blood plasma DMT content.
light microscope (Leica Microsystems GmbH, Germany).
Finally, in order to identify the cellular and subcellular localization of Sig-1Rs, the receptors were co-labeled with NeuN (neuronal marker), GFAP (astrocyte marker) and Iba-1 (microglia marker) in slices from a naïve animal. Antigens were retrieved with 10-min-long boiling in 6 M urea in Tris-HCl buffer (pH 9.5; 80 ◦C, shaking at 300 rpm) (Hayashi et al., 2011). All slices were permeabilized with 0.2% Triton X-100 in PBS for 30 min. Non-specific protein-binding sites were blocked with 3%
bovine serum albumin (BSA) for 1 h at room temperature. Slices were incubated with primary antibodies overnight at 4 ◦C (anti-Sig-1R: rabbit, Abcam, ab53852, 1:500; anti-NeuN: mouse, Millipore, MAB377, 1:250;
anti-GFAP: mouse, Sigma, G3893, 1:500; anti-Iba-1: mouse, Wako,
#016–26721, 1:200 in 3% BSA in PBS). Secondary antibodies were applied for 1 h at room temperature (anti-rabbit STAR RED; goat, Abberior, 1:500 and anti-mouse STAR 580, goat, Abberior, 1:500 for NeuN and GFAP-labelling; anti-rabbit Alexa-488, goat, Thermo Fisher Scientific, #A11034, 1:500, anti-mouse Alexa-647, donkey, Thermo Fisher Scientific, #A32787, 1:500 for Iba-1 labelling) in 1% BSA in PBS.
Slices were mounted with Mount Solid antifade© (Abberior, Germany).
Representative epifluorescent (20x) and confocal (100x) images were taken of the somatosensory cortex with a Zeiss Axio Observer Z1 inverted microscope (Carl Zeiss GmbH, Germany) equipped with a laser confocal imaging capable Stedycon (Abberior Instruments, Germany), and pieced together, re-coloured and processed in ImageJ (National Institutes of Health, Bethesda, Maryland, USA) (Schneider et al., 2012).
2.7. In vitro radioligand binding assay
PRE-084 (Sig1-R agonist), asenapine (5-HTR antagonist), fluvox- amine (Sig-1R agonist), (+)-pentazocine (Sig-1R agonist), haloperidol (Sig-1R antagonist) and buffer components (TRIS-HCl) were purchased from Sigma-Aldrich Kft. (Budapest, Hungary). The radioligand [3H]- (+)-pentazocine (specific activity 1.98 TBq/mmol) was prepared in the Laboratory of Chemical Biology (BRC, Hungary). Tritium labeling was carried out in a self-designed vacuum manifold (Dvor´acsk´o et al., 2019) and radioactivity was measured with a Packard Tri-Carb 2100 TR liquid scintillation analyzer using Insta Gel scintillation cocktail of Perki- nElmer. Drugs were dissolved at 100 mM (DMT) or 1 mM (PRE-084, (+)-pentazocine, asenapine, fluvoxamine) in dimethyl sulfoxide (DMSO) and were stored at − 20 ◦C, and then diluted in the binding buffer.
Preparation of rat brain tissue membrane homogenates was per- formed according to a previous method (Narita et al., 1996; Ishima et al., 2014), with a slight modification. Male Sprague–Dawley rats (n =10, 250 g) were decapitated in deep anesthesia, and their brains were removed rapidly. The brains without cerebellum were homogenized in 20 vol of ice-cold 50 mM Tris-HCI (pH 8.0 at 25 ◦C), using a Braun Teflon-glass homogenizer at the highest speed for 30 s. The homogenate was centrifuged at 48.000 g for 10 min at 4 ◦C. The resulting pellet was resuspended in 50 mM Tris-HCI buffer (pH 8.0) and recentrifuged. This procedure was repeated twice. The final pellet was suspended in 20 vol of 50 mM Tris-HCI (pH 8.0) and stored in aliquots at − 80 ◦C. The protein content of the samples was measured by the Bradford method (Bradford, 1976) and samples were diluted to obtain the appropriate amount for the assay.
Binding assays for the Sig-1R followed previously establihsed methhods with slight modification (Ishima et al., 2014). Samples were incubated at 27 ◦C for 120 min in a 50 mM Tris–HCl binding buffer (pH 8.0) in plastic tubes in a total assay volume of 1 mL that contained 0.5 mg/mL of membrane protein. Competition binding experiments were carried out by incubating rat brain membranes with 3.6 nM of [3H]
(+)-pentazocine (Kd =13.1 nM) in the presence of increasing concen- trations (10−11–10−3 M) of various competing unlabeled ligands.
Non-specific binding was determined in the presence of 10 μM halo- peridol. The incubation was terminated by diluting the samples with ice-cold wash buffer (50 mM of Tris–HCl, pH 8.0), followed by repeated
washing and rapid filtration through Whatman GF/B glass fiber filters (Whatman Ltd., Maidstone, England) presoaked with 0.1% poly- ethyleneimine. Filtration was performed with a 24-well Brandel Cell Harvester (Gaithersburg, MD, U.S.A.). Filters were air-dried and immersed into Ultima Gold MV scintillation cocktail, and then radio- activity was measured with a TRI-CARB 2100 TR liquid scintillation analyzer (Packard, PerkinElmer, Waltham, MA, U.S.A.).
2.8. Measurement of exogenous DMT in rat tissue
Because the enzymatic degradation of DMT is rapid, we set out to confirm that DMT supplied to the animals was present at detectable levels and sufficient concentration in the blood plasma and brain to potentially achieve neuroprotection. Blood samples were collected through the femoral artery at baseline (i.e. prior to ischemia onset), under ischemia, after hypoxia, and under reperfusion (n =4/4, vehicle/
DMT). Full blood was centrifuged promptly in EDTA coated Eppendorf tubes (5000 G, 5 min, 4 ◦C, Heraeus Fresco 17 Microcentrifuge, Thermo Scientific, U.S.A.), and supernatant plasma (0.2 mL) was separated into another Eppendorf vial. To collect brain tissue samples, the animals (n
=4/4, vehicle/DMT) were transcardially perfused with ice-cold physi- ological saline under deep anesthesia (5%, i.p., 500 mg/kg) at the end of the experimental protocol to wash out any blood from the brain. The full brains were quickly removed, snap-frozen in liquid nitrogen, and stored at − 70 ◦C until further processing. The DMT content of blood plasma and brain tissue was measured by using heart-cutting two-dimensional liquid chromatography coupled to quadrupole-Orbitrap mass spec- trometry (2D-LC-HRMS/MS)), which is presented in detail in a previous study (Korm¨ ¨oczi et al., 2020).
2.9. Data analysis
Data analysis was conducted according to establihsed principles (Szab´o et al., 2019; M. Toth et al., 2020; Varga et al., 2020). Physio-´ logical variables (i.e. DC potential and MABP) were simultaneously ac- quired, displayed live, and stored using a personal computer equipped with the software LabChart 8 (ADInstruments, Australia). Data analysis was assisted by the inbuilt instructions of the software AcqKnowledge 4.2 for MP 150 (Biopac Systems, Inc., Goleta, U.S.A.). Blinding data analysis was intended by assigning codes to files and recordings, which do not reveal the experimental condition (i.e., date of the experiment).
The experimental data were not processed in cases the animals died during SD elicitation or due to the hypoxic episode (n =6, random distribution over pharmacological treatments).
Raw LDF recordings were downsampled to 1 Hz and expressed relative to baseline by using the average CBF value of the first 5 min (100%) and the recorded biological zero obtained after the termination of the experiments (0%) as reference points. Raw DC recordings were also downsampled to 1 Hz.
For SD events, peak amplitude, duration at half amplitude, the rate of depolarization and repolarization, and area under the curve (AUC) were measured on the DC potential trace of all three SDs. The SDs elicited were associated with a prominent hyperemia, rather than spreading ischemia, because CBF during ischemia was approximately around the upper limit typical of the ischemic penumbra (i.e. 40 % relative to baseline). The CBF response to SD tends to be hyperemic under such flow conditions, which we have shown earlier (Bere et al., 2014). For SD-associated hyperemia, only the second and third SDs were consid- ered, due to the substantially different CBF response to the first SD. Peak amplitude, duration at half amplitude, the rate of depolarization and repolarization, and AUC were measured.
The CC3-labeled and 4-HNE slides were evaluated by manual cell counting with the CellCounter plugin of ImageJ (National Institutes of Health, Bethesda, Maryland, USA) by two observers blind to the experimental design. Cell count was expressed for a unit surface of 1 mm2. The intensity of the 4-HNE labeling was estimated for the
perinuclear cytoplasm of CA1 pyramidal cells and granule cells of the dentate gyrus. The cellular cytoplasm of individual labeled cells was delineated manually. The density of the labeling was evaluated with respect to background by the NIS Elements Advanced Research Software (Version 5.20, Nikon) (Nikon Instruments, Tokyo, Japan). Neuronal and astrocytic loss was characterized by the estimation of NeuN- or GFAP- positive immunolabeling, respectively, in all observed brain regions.
After masking binary images in ImageJ, the relative surface covered by immunopositive cells was expressed. The Iba-1 labelling was evaluated with a ramification index as previously described (T´oth et al., 2020).
Briefly, a lower ramification index value represents a more activated microglial status.
Data and statistical analysis followed previously accepted guidelines (Szabo et al., 2019; ´ Varga et al., 2020). Data are given as mean ± standard deviation (stdev). The results were statistically analyzed with the software SPSS (IBM SPSS Statistics for Windows, Version 23.0, IBM Corp.). A Grubbs test was applied to identify potential outliers (n =4, random distribution over pharmacological treatments). The normal distribution of data sets was evaluated with a Shapiro–Wilk test. In case the data showed normal distribution, an independent samples t-test, a one-way analysis of variance (ANOVA) or a two-way ANOVA model was used, dependent on the type of data set. A Fisher post hoc test was used for group comparisons, whenever applicable. In case of nonnormal distribution, a Kruskal-Wallis H test was applied, followed by a Mann-Whitney U test for group comparisons. Levels of significance were defined as p <0.05* and p <0.01**. All relevant statistical methods are given in each figure legend.
The results of the competition binding studies are reported as earlier (Ishima et al., 2014). Data are provided as means ±standard error of the mean (S.E.M.) of at least three independent experiments, each per- formed in duplicate. In competition binding studies, the inhibitory constants (Ki) were calculated from the inflection points of the displacement curves using nonlinear least-square curve fitting and the Cheng–Prusoff equation, Ki =EC50/(1 +[ligand]/Kd). Ki values of DMT in the absence or presence of 10 μM asenapine were compared by un- paired t-test with two-tailed P value. One sample t-test with a hypo- thetical value of 100% was applied when specific binding values were compared to total specific binding (100%) in receptor binding assays.
Significance was accepted at P <0.05 level. All data and curves were analyzed by GraphPad Prism 5.0 (San Diego, CA, U.S.A.).
3. Results
3.1. Physiological variables
Blood gases varied in the physiological range throughout the experimental protocol, yet these physiological variables significantly shifted over the reperfusion period with respect to baseline and ischemia/hypoxia. In particular, by the end of the reperfusion period, blood pH showed a decreasing tendency (pH 7.27 ±0.17 vs. 7.31 ±0.11 and 7.30 ±0.12, reperfusion vs. baseline and ischemia/hypoxia; F = 2.525, p <0.085), pCO2 noticeably increased (42.3 ±13.6 vs. 33.2 ±7.6 and 34.3 ±10.5 mmHg, reperfusion vs. baseline and ischemia/hypoxia;
F =9.102, p <0.0003**) and pO2 decreased (99.6 ±24.3 vs. 111.2 ± 17.0 and 108.4 ±26.6; F =3.534, p <0.033*).
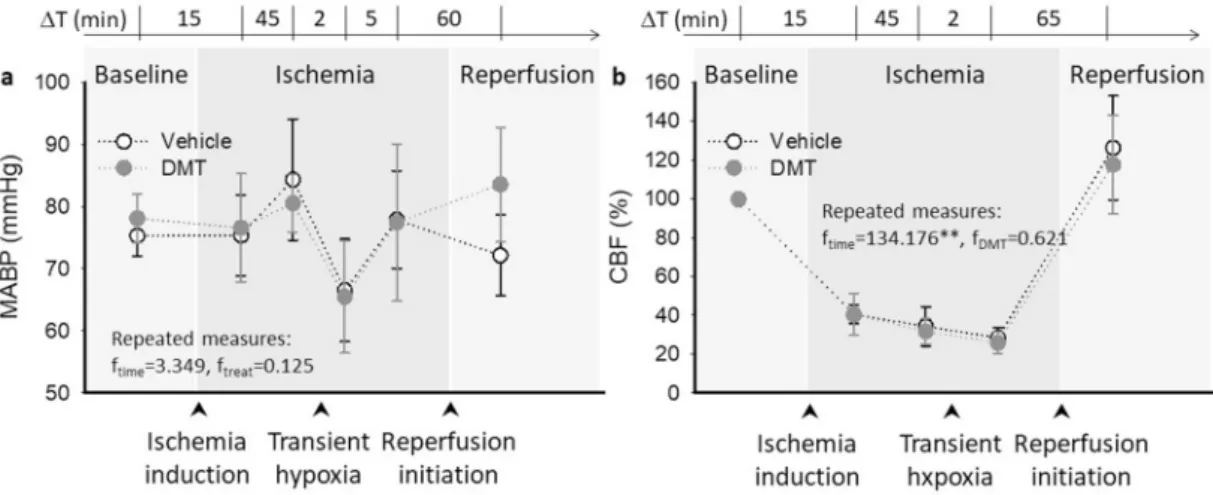
MABP values confirmed sufficiently deep anesthesia. MABP slightly elevated during ischemia (83 ± 8 vs. 77 ± 4 mmHg, ischemia vs.
baseline) and fell due to transient hypoxia (to 66 ±8 mmHg), at no statistical significance over the experimental protocol (F =3.349, p <
0.127). DMT application had no discernible impact on MABP (F =0.125, p <0.738) (Fig. 2a). Heart rate was stable throughout the experimental protocol (e.g. vehicle group: 331 ±27, 327 ±41 and 319 ±43 bpm, baseline, ischemia and reperfusion; F =0.012, p <0.918). DMT elevated heart rate slightly but not significantly (e.g. reperfusion: 344 ±19 vs.
319 ±43 bpm, DMT vs. vehicle; F =1.290, p <0.307).
Any consequence of DMT application on baseline CBF variation was also considered. After ischemia induction, CBF dropped sharply and then stabilized at 40.3 ±4.8% prior to SD1, and at 34.2 ±10.1% prior to the induction of transient hypoxia in the vehicle-treated group (Fig. 2b).
With hypoxia, perfusion decreased further (to 28.3 ±5.4%). Reactive hyperemia was not obvious as reperfusion was imposed; instead, CBF peaked at 70.1 ±17.8%. DMT did not alter baseline CBF at any time point or condition considered (Fig. 2b).
3.2. The impact of DMT on the evolution of spreading depolarization As the suppression of spontaneous, recurrent SDs by pharmacolog- ical means has emerged as a promising target in ischemic neuro- protection (Klass et al., 2018; Szab´o et al., 2019; Varga et al., 2020), we have sought to explore the SD limiting potential of DMT. We have also aimed to tackle by pharmacological means whether DMT action may be achieved via Sig-1R activation.
The amplitude of SD was significantly reduced in the presence of DMT (− 16.5 ±4.1 vs. − 20.1 ±1.3 mV, DMT vs. vehicle) (Fig. 3a–b).
Fig. 2.Mean arterial blood pressure (MABP) and cerebral blood flow (CBF) variations over the experimental protocol. a, DMT exerted no impact on MABP over the experimental protocol. b, While CBF was obviously reduced during ischemia, DMT did not change the CBF baseline variations with respect to the vehicle group. In
“a” and “b”, data are given as mean ±stdev. A repeated measures model was used for statistical analysis (p <0.05* and p <0.01**).
Likewise, the rate of depolarization proved to be also slower in the DMT- treated group with respect to control (− 2.62 ±1.28 vs. − 3.48 ±0.94 mV/s, DMT vs. vehicle) (Fig. 3c). Finally, the cumulative duration of SD events was shortened in the DMT-treated group (140 ±38 vs. 191 ±42 s, DMT vs. vehicle) (Fig. 3d).
The share of Sig-1R activation in DMT-linked SD attenuation was explored by the application of a highly selective Sig-1R agonist PRE-084, or the use of a Sig-1R antagonist NE-100 alone or in combination with DMT. In the presence of PRE-084, the DMT-related reduction of SD amplitude and slower rate of depolarization were replicated (i.e.
amplitude: − 16.2 ±5.6 vs. − 20.1 ±1.3 mV, PRE-084 vs. vehicle; rate of depolarization: − 2.26 ± 1.06 vs. − 3.48 ± 0.94 mV/s, PRE-084 vs.
vehicle) (Fig. 3b–c), and the cumulative duration of SDs also tended to be shorter (149 ±31 vs. 191 ±42 s, PRE-084 vs. vehicle). NE-100 alone did not cause any notable change in SD amplitude, rate of depolarization or cumulative duration (e.g. amplitude: − 18.7 ±2.6 vs. − 20.1 ±1.3 mV, NE-100 vs. vehicle) (Fig. 3b–d). In contrast with DMT applied alone, the co-application of NE-100 and DMT did not achieve any meaningful reduction of SD amplitude (− 19.2 ± 4.5 vs. − 20.1 ± 1.3 mV, NE- 100+DMT vs. vehicle), depolarization rate (− 3.06 ±1.18 vs. − 3.48 ± 0.94 mV/s, NE-100+DMT vs. vehicle), or cumulative duration (220 ± 12 vs. 191 ±42 s, NE-100+DMT vs. vehicle) either (Fig. 3b–d).
Next, we considered the possibility that DMT may activate 5-HTRs (Carnonaro and Gatch, 2016) and thereby inhibit SD (Guedes et al., 2017). To this end, we administered the broad spectrum 5-HTR antag- onist asenapine (Shadid et al., 2009) alone or co-applied with DMT. The amplitude of SD was significantly greater in the presence of asenapine alone as compared with vehicle (− 22.6 ±2.6 vs. − 20.1 ±1.3 mV, asenapine vs. vehicle). The co-application of DMT with asenapine re-established SD amplitude to control level (− 19.1 ±1.3 vs. − 22.6 ± 2.6 mV, asenapine +DMT vs. asenapine) (Fig. 3b). The relative ampli- tude of SD was greater in asenapine +DMT group with respect to DMT alone (− 22.6 ±2.6 vs. − 16.5 ±4.1 mV), albeit the difference was sta- tistically not significant. These data collectively suggest that the SD-suppressing action of DMT was likely realized, at least in part, via Sig-1R activation.
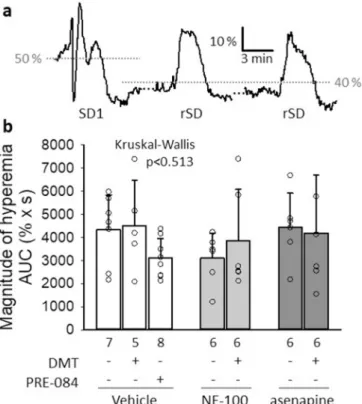
Of the three subsequent elements of the CBF response to SD (i.e. brief transient hypoperfusion, transient peak and late hyperemia, and long- lasting oligemia) (Ayata and Lauritzen, 2015) our analysis predomi- nantly focused on the phase of hyperemia, which evolved reliably with
Fig. 3. The impact of pharmacological treatments on the electrophysiological features of spreading depolarization (SD). a, Representative traces demonstrate that DMT treatment progressively attenuated the amplitude of subsequent SD events compared to vehicle-treated control, which action was prevented by the co- application of the Sig-1R antagonist NE-100. b, Similar to DMT, the highly specific Sig-1R agonist PRE-084 also decreased the amplitude of SDs. NE-100 co- application with DMT diminished DMT action. DMT co-applied with the broad-spectrum serotonin receptor antagonist asenapine achieved SD amplitude reduction compared to asenapine application alone. Data are given as mean ±stdev. The number of animals (mean of 3 SD events per animal) is indicated in each bar. The test of normality indicated that the distribution of data was not normal (Shapiro-Wilk test: df =46 p =0.001**). Consequently, a Kruskal-Wallis H test was applied (p <
0.01**), followed by an independent-samples Mann-Whitney U test (p <0.05* and p <0.01** vs. vehicle alone, p <0.01$$ vs. DMT alone, p <0.05# vs. asenapine alone). c, DMT and PRE-084 administration also decreased the rate of depolarization, which was prevented by both NE-100 and asenapine. d, DMT and PRE-084 reduced the cumulative duration of SD events, while NE-100 (alone or in combination with DMT) exhibited the opposite effect. In “c-d”, data are given as mean ± stdev. The number of animals (mean of 3 SD events per animal) is indicated in each bar. Statistical analysis indicated a normal distribution of data (c: Shapiro-Wilk test: df =46 p =0.360; d: Shapiro-Wilk test: df =40 p =0.383), therefore the analysis proceeded with a one-way ANOVA paradigm followed by a Fisher (least significant difference, LSD) post hoc test (p <0.05* vs. vehicle alone, p <0.05$ and p <0.01$$ vs. DMT/PPRE-084 alone).
Fig. 4.The impact of pharmacological treatments on the cerebral blood flow (CBF) response to spreading depolarization (SD). a, A trace representative of the vehicle group depicts the CBF response to the first (SD1) and recurrent SDs (rSD), as acquired with laser-Doppler flowmetry. b, The area under the curve (AUC) of the hyperemic component of the CBF response represents the magnitude of SD-related hyperemia, which was not modulated by any of the pharmacological treatments. Data are given as mean ±stdev. The number of animals (mean of 3 SD events per animal) is given in each bar. The test of normality indicated that the distribution of data was not normal (Shapiro-Wilk test: df =44 p =0.031*). Consequently, a Kruskal-Wallis H test was applied.
each SD (Fig. 4a). We narrowed down our analysis to recurrent SDs, because the kinetics of the CBF response to the first SD in a train is substantially different from the response given to recurrent SDs (Farkas et al., 2008; Ayata and Lauritzen, 2015) (Fig. 4a).
In our experiments, the CBF response to recurrent SDs appeared to be resistant to all of the used pharmacological agents, including DMT or the selective Sig-1R agonist PRE-084. Like other parameters (i.e. amplitude or duration of hyperemia), the magnitude of hyperemia characterized by the area under the curve (AUC) was similar across various treatment regimes (Fig. 4b).
3.3. Neuroprotection achieved with DMT
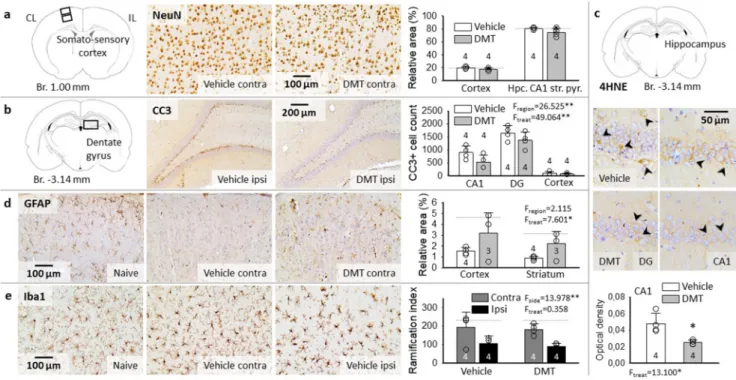
Neuronal survival has been characterized by the surface area occu- pied by NeuN-labeled neurons relative to the full field of view, in the somatosensory cortex and the hippocampus (Fig. 5a). With respect to naïve animals, no significant difference in NeuN immunopositivity was noted due to ischemia/hypoxia/reperfusion (e.g. somatosensory cortex:
19.9 ±1.9 vs. 19.3 ±1.4%, vehicle vs. naive). Neuronal loss that might have been associated with SD was not found, either (e.g. somatosensory cortex: 19.5 ±3.1 vs. 20.2 ±3.2%, ipsi-vs. contralateral side to SD).
Finally, DMT treatment exerted no meaningful effect on NeuN labeling (e.g. contralateral somatosensory cortex: 17.4 ±2.0 vs. 19.9 ±1.9%, DMT vs. vehicle).
As neurons in the hippocampus CA1 and dentate gyrus (DG), the most vulnerable regions to ischemia are packed with pericarya so tightly that NeuN staining may not reveal individual cell loss, we labeled cells engaged in apoptotic cell death with CC3 immunostaining (Fig. 5b).
Sections from naïve animals were virtually devoid of CC3-positive cells (i.e. DG: 163 ±14 CC3+cells per mm2), while CC3 labeled cell bodies were obvious in the cortex, hippocampus CA1 region, and particularly in the DG after ischemia/hypoxia/reperfusion in the vehicle group (DG:
1649 ±278 CC3+cells per mm2) (Fig. 5b). The aggravation of apoptosis by recurrent SDs was anticipated in the cortex, where SDs propagated (Jahanbazi et al., 2018), but no lateralization of CC3 cell count was detected (vehicle group: 106 ±46 vs. 104 ±67 CC3+cells per mm2, ipsi-vs. contralateral). For this reason, CC3+cell counts obtained from the two hemispheres were averaged for each region. Importantly, significantly fewer CC3 labeled apoptotic cells were counted in the DMT-treated compared to vehicle-treated animals in the somatosensory cortex (66 ±33 vs. 105 ±56 CC3+cells per mm2, DMT vs. vehicle), hippocampal CA1 region (532 ±268 vs. 893 ±249 CC3+cells per mm2, DMT vs. vehicle) and DG (1367 ±311 vs. 1649 ±278 CC3+cells per mm2, DMT vs. vehicle) (Fig. 5b).
In addition to apoptosis, ischemic/hypoxic stress may induce fer- roptosis, an alternative pathway of programmed cell death that has been recognized recently (Dolma et al., 2003; Stockwell et al., 2017). The typical hallmark of ferroptosis is the iron-dependent accumulation of lipid hydroperoxides, hence the cellular process can be detected by 4-HNE immunohistochemistry (Cao and Dixon, 2016). Ferroptosis was obvious in selected neurons in the hippocampus CA1 and dentate gyrus (Fig. 5c). The number of ferroptotic cells tended to be lower in the DMT-treated CA1 (4.53 ±0.39 vs. 6.13 ±2.49 count/mm2, DMT vs.
vehicle), but this difference was statistically not significant. Also, the cell counting approach was not fully reliable due to the cell density in the CA1 pyramidal cell layer and the dentate gyrus granule cell layer (i.
Fig. 5.Representative light microscopic images of immuno-labeled sections and bar charts demonstrate neuroprotection achieved by DMT administration in cortical (sensory cortex and hippocampus) and subcortical gray matter (striatum). a, No changes were observed in the density of NeuN-labeled neurons, either due to ischemia/reperfusion, or DMT treatment. b, Cleaved caspase-3 (CC3) positive apoptotic cells in the granule cell layer of the dentate gyrus (DG) were obvious, and were also present to a lesser degree in the hippocampus CA1 region after ischemia/reperfusion in the vehicle group. DMT administration reduced the number of CC3- positive apoptotic cells. Cell count is given for 1 mm2 surface area. c, Representative sections labeled for 4-hydroxynonenal (4-HNE) indicate ferroptotic cell death (arrowheads) in the hippocampus dentate gyrus (DG, image pair to the left) and CA1 region (image pair to the right). Note that even though the number of 4-HNE- positive cells was not significantly different between experimental groups, the optical density of the perinuclear cytoplasm was considerably lower after DMT treatment (bar chart below). d, Glial fibrillary acidic protein (GFAP)-positive astrocytes were lost following ischemia/reperfusion in the vehicle group, but were partially rescued by DMT treatment. e, Prominent microglia activation was detected in the cortex ipsilateral to SD-elicitation and the craniotomies (M. Toth et al., ´ 2020), which was not modulated by DMT application. In the bar charts of Panels “a-d”, data are presented as mean ±stdev, sample size is given in each bar.
Horizontal dotted lines indicate levels measured in naïve rats (n =3). Statistical analysis was conducted using a one-way (e.g. 4-HNE) or two-way ANOVA model with treatment and region (e.g. NeuN, GFAP, CC3), or side and treatment (Iba-1) as factors (p <0.05*; p <0.01**).
e. discriminating individual cells carries uncertainty). However, the lower intensity of the 4-HNE staining in the perinuclear cellular cyto- plasm after DMT treatment was conspicuous and indicated an anti-ferroptotic effect of DMT (0.025 ±0.002 vs. 0.048 ±0.012, DMT vs. vehicle) (Fig. 5c).
Because astrocytes have been widely known to support neuronal function under ischemia (Rossi et al., 2007), and GFAP-positive proto- plasmic astrocytes may become selectively vulnerable to ischemic con- ditions (Lukaszevicz et al., 2002), we have explored whether DMT has the potential to protect astrocytes. We used GFAP immunocytochemistry to label astrocytes (Fig. 5d). The relative area occupied by GFAP immunolabeled compartments considerably decreased after ischemia/- hypoxia/reperfusion compared to naive animals, which reduction was counteracted by DMT-treatment in the cortex and striatum (cortex: 3.2
±1.9 vs. 1.5 ±0.3 vs. 4.7 ±0.9%, striatum: 2.3 ±1.1 vs. 0.9 ±0.2 vs.
3.2 ±1.6%, DMT vs. vehicle vs. naive), but not in the hippocampus (i.e.
CA1 stratum oriens 10.6 ±4.9 vs. 11.1 ±5.8 vs. 15.5 ±2.7%, DMT vs.
vehicle vs. naive) (Fig. 5d).
Ischemic insults trigger microglial activation and neuro- inflammatory reaction that may be modulated via Sig-1Rs (Szabo et al., 2016; Jia et al., 2018). In the cerebral cortex ipsilateral to the craniot- omies and SD initiation, decreasing microglial arborization was ex- pected to denote the amplification of microglial activation (Varga et al., 2020; M. T´oth et al., 2020). The current data confirm the previous ob- servations by showing less dense microglia ramification in the ipsilateral cortex compared to the contralateral side (vehicle group: 106.6 ±50.5 vs. 194.3 ±95.6, ipsi-vs. contralateral) (Fig. 5e). Yet, the administration of DMT did not exert any distinguishable effect on the microglial ramification index (i.e. ipsilateral cortex: 89.5 ±37.4 vs. 106.6 ±50.5 DMT vs. vehicle) (Fig. 5e).
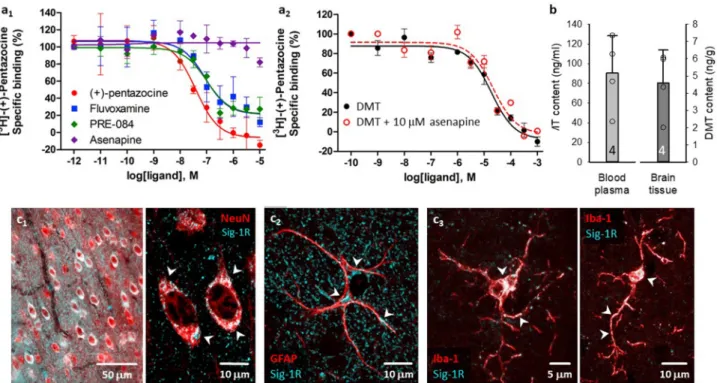
3.4. Receptor binding, tissue DMT content and Sig-1R co-localization The binding affinities of the compounds for the Sig-1R were deter- mined in competitive binding assays. The assay conditions were vali- dated with various Sig-1R ligands and the following order of potency for Sig-1R binding was found: (+)-pentazocine >fluvoxamine >PRE-084 (Fig. 6a). All three compounds exhibited nanomolar Sig-1R affinities and induced a similar maximal displacement (around 90–100%). To eval- uate if DMT exerts its action by binding to Sig-1R, the Sig-1R binding affinity of DMT was investigated in the absence or presence of asena- pine, a potent serotonin- and dopamine receptor antagonist (Shadid et al., 2009).
Competition binding assays in rat brain membrane homogenate against the Sig-1R specific radioligand [3H](+)-pentazocine revealed that DMT bound the Sig-1R with an inhibitory constant value of 15.1 μM. This is in agreement with the results of Fontanilla et al. (2009), who found that DMT bound the Sig-1R at low micromolar concentrations (Kd
=14.7 μM) in guinea pig liver membrane homogenate. Asenapine could not displace the radioligand from the [3H](+)-pentazocine binding sites (10 μM asenapine reduced total specific binding of the radioligand to 82%) indicating the lack of specific affinity of asenapine for the Sig-1R (Fig. 6a1). When 10 μM asenapine was added to DMT, no significant difference was observed in the Sig-1R binding affinity of DMT, indi- cating that asenapine did not influence the Sig-1R binding of DMT (Fig. 6a2).
Since DMT is rapidly degraded by monoamine oxidases (MAO) in peripheral tissues (Burchett and Hicks, 2006), we evaluated blood plasma and brain tissue DMT content with 2D-LC-MS/MS (K¨ormoczi ¨ et al., 2020). Importantly, DMT administered at a dose of 1 mg/kg/h by i.v. infusion was clearly detectable in blood plasma measured 50 min
Fig. 6. Sig-1R ligand binding affinities in rat brain homogenates, blood plasma and brain tissue DMT content, and the cellular localization of Sig-1R in the rat cerebral cortex. a, Competitive binding curves of various Sig-1R ligands against the radioactive Sig-1R ligand [3H](+)-pentazocine (A1) and of DMT in the absence or presence of 10 μM asenapine (A2) in rat brain membrane homogenates. Curves are shown as percent specific binding (10 μM haloperidol). b, Blood plasma and brain tissue were enriched in DMT after intravenous infusion, as measured by two-dimensional liquid chromatography coupled to quadrupole-Orbitrap mass spectrometry (2D-LC-MS/MS). In contrast, DMT was undetectable in blood plasma and brain tissue of control rats by 2D-LC-MS/MS (data not shown). c, Immuno-labeled brain slices demonstrate the perinuclear localization of Sig-1R in NeuN-labeled cortical pyramidal cells (epifluorescent and confocal microscopic images; c1). In GFAP- positive astrocytes, Sig-1R was seen in the perinuclear soma, and in processes (confocal microscopic image; c2). Both the soma and processes of Iba-1-labeled microglia were endowed with Sig-1Rs (confocal microscopic image; c3).
after the initiation of DMT infusion (90.5 ±37.9 ng/mL, ca. 0.5 μM), and in the brain tissue sampled upon the termination of the experimental protocol (4.6 ±1.9 ng/g tissue, ca. 0.02 μmol/kg) (Fig. 6b). Potential endogenous DMT concentration in the vehicle group remained below detection level.
Finally, to identify cell types that may be targeted by DMT, we co- localized Sig-1R with neurons, astrocytes, and microglia with fluores- cent immunocytochemistry in naïve rats. Sig-1Rs were expressed abundantly in neurons (Fig. 6c1), and were also associated with astro- cytes (Fig. 6c2), and resting microglia (Fig. 6c3).
4. Discussion
The objective of our current study was to explore whether DMT administration achieves neuroprotection via Sig-1R activation in the acute phase of experimental, transient, cerebral forebrain ischemia, aggravated by the recurrent induction of SDs and a subsequent transient hypoxic episode. DMT is a natural, endogenous Sig-1R ligand, which is thought to pose as an advantage of DMT application as opposed to other, synthetic Sig-1R agonists.
The impact of DMT treatment on physiological variables was screened comprehensively, because single intravenous doses of DMT have been reported to cause sympathetic activation, and to prominently increase blood pressure and heart rate within minutes after adminis- tration (Strassman and Qualls, 1994). In our experiments, DMT exerted no obvious impact on cardiovascular or cerebrovascular function (Fig. 2), which may be attributed to the continuous, slow infusion of DMT (rather than a bolus application), controlled anesthesia, or their combination. The absence of apparent cardio- or cerebrovascular effects in our study proved to be favorable, as the neuroprotective potential of DMT could be assessed free of any marked changes in physiological variables.
Recurrent SD events have served here the evaluation of the ischemic neuroprotective potential of DMT, linked to Sig-1R activation. SD is the synchronized depolarization of a critical bulk of tissue in the cerebral gray matter, which is thought to be triggered by local metabolic supply- demand mismatch under ischemia (von Bornst¨adt et al., 2015). SD propagates over the cerebral cortex at a slow rate of a few mm/min, by progressively involving neighboring tissue in the depolarization (Leao, 1944; Somjen, 2001). Further, SD is accompanied by a CBF response dominated typically by a remarkable hyperemic element (Fig. 4a), which serves the replenishment of ATP necessary for timely repolari- zation behind the SD wave front (Ayata and Lauritzen, 2015). Impor- tantly, recurrent SDs have been recognized as a universal principle of lesion progression in the injured cerebral gray matter (Hartings et al., 2017; Dreier et al., 2017)], and SD suppression has been considered as a promising therapeutical approach to improve neurological outcome after acute brain injury (Carlson et al., 2018, 2020; Klass et al., 2018).
In our current experiments, SD amplitude, the rate of depolarization and cumulative SD duration were reduced under intravenous DMT administration, exhibiting the SD limiting impact of DMT. Further, the application of the selective Sig-1R agonist PRE-084 reproduced the SD hampering action of DMT, and the Sig-1R antagonist NE-100 co-applied with DMT diminished the DMT-related SD inhibition (Fig. 3). These results collectively suggest that DMT may impede SD evolution by Sig- 1R activation. The implication of Sig-1Rs is supported by previous re- ports demonstrating that dextromethorphan or carbetapentane – two ligands known as Sig-1R agonists – reproducibly and reliably blocked SD occurrence in live brain slice preparations (Anderson and Andrew, 2002;
Anderson et al., 2005; Church et al., 2005).
Recurrent SDs may accelerate ischemic lesion maturation because SD is associated with an intracellular rise of calcium (Siesjo and Bengtsson, ¨ 1989; Reinhart and Shuttleworth, 2018), which potentially contributes to the calcium overload known to initiate ischemic neurodegeneration (Szydlowska and Tymianski, 2010). Indeed, the non-competitive NMDA receptor antagonist ketamine inhibited SD evolution with a concomitant
reduction of neuronal calcium content in brain slice preparations (Reinhart and Shuttleworth, 2018), and voltage-gated calcium channel blockers reduced SD amplitude in anesthetized rats (Richter et al., 2002;
Szabo et al., 2019), similar to that seen here. Intriguingly, Sig-1R ago-´ nism was shown to attenuate the NMDA receptor activation-linked calcium response in cultured neurons (Klette et al., 1997), and to depress calcium currents with a corresponding inactivation of neuronal voltage-gated calcium channels (Zhang et al., 2002). On the basis of these and our experimental data together, we postulate that DMT in our experiments possibly inhibited SD via Sig-1R-linked modulation of intracellular calcium homeostasis.
The suggestion that DMT predominantly achieved SD inhibition by Sig-1R activation – rather than through 5-HTR binding (Yanai et al., 1986; Deliganis et al., 1991) – is also substantiated by our finding that DMT counteracted the SD potentiating effect of asenapine (Fig. 3), an antagonist of multiple 5-HTRs (Shahid et al., 2009). In other words, when 5-HTRs were occupied by asenapine, DMT still reduced SD amplitude with respect to the condition when asenapine was given alone. Of note, our results that 5-HTR antagonism increased SD ampli- tude (Fig. 3) are complementary to previous reports showing that ablation of the dorsal raphe serotonergic neurons accelerated SD prop- agation in the cerebral cortex (Cui et al., 2013), electrical stimulation of the dorsal raphe or the administration of sumatriptan, a 5-HT1D receptor agonist decelerated SD (Guedes et al., 2017), and sumatriptan also suppressed SD evolution in experimental focal cerebral ischemia (Mies et al., 1998). Thus, serotonergic activity appears to restrain SD, and, conversely, serotonergic deficiency may augment SD.
Finally, we evaluated the impact of the pharmacological treatments on the CBF response to SD, especially because it is unknown whether and how DMT might alter neurovascular coupling. Another consideration has been that the CBF response to SD in the hypoperfused cerebral cortex is understood to be insufficient to meet the metabolic demand of the nervous tissue (Dreier, 2011; Hoffmann and Ayata, 2013), therefore the pharmacological enhancement of the SD-associated CBF response may support neuronal survival in tissue at risk (Dreier et al., 1998; Varga et al., 2020). DMT treatment in our experiments, however, did not alter the SD-related hyperemia (Fig. 4). Furthermore, none of the other agents used (the Sig-1R agonist PRE-084, the Sig-1R antagonist NE-100 or the 5-HTR antagonist asenapine) proved to be effective at modulating the SD-associated CBF response in any meaningful way (Fig. 4). The implication of Sig-1R in the mediation of the SD-associated hyperemia has been previously unattended, and our current results do not support the notion that Sig-1R signaling may augment the SD-related CBF response, at least not under ischemic conditions. On the other hand, the 5-HT1D/1B receptor agonist zolmitriptan increased, while the 5-HT2A/2C
receptor antagonist ritanserin attenuated the amplitude of hyperemia in the optimally perfused cerebral cortex (Gold et al., 1998). The non-specific 5-HTR antagonist asenapine would then be expected to curb the hyperemic response to SD, but exerted no effect. The condition that SDs occurred here in ischemic tissue could have possibly overridden physiological blood flow regulation with SD (Varga et al., 2016) – indeed, ischemia is known to impair neurovascular coupling (Jackman and Iadecola, 2015). Taken together, we assume that Sig-1R or 5-HTR-based modulation of the CBF response to SD in the ischemic ce- rebral cortex proves to be ineffective.
Several groups have reported independently that Sig-1R agonism successfully reduced infarct size estimated 24 h or a number of days after an episode of experimental focal cerebral ischemia (Ajmo et al., 2006;
Omi et al., 2014; Sato et al., 2014; Nardai et al., 2020). Therefore, we proceeded to investigate the neuroprotective potential of DMT at his- tological level as early as 2 h after ischemia induction and 1 h after reperfusion initiation (Fig. 1). In our experiments, NeuN staining did not reveal significant loss of neurons, possibly because the end point was too early to detect massive neurodegeneration (i.e. infarct maturation), and the staining is too dense to be sensitive for the selective loss of scattered, individual cells. However, the network of GFAP-positive astrocytes