Theaudienceasawhole–andparticularlyitsmembers asindividuals–constitutesthelastpieceofthevalue chaininmediamanagementliterature.Themediamar- ketvaluechainischanginginparallelwiththechang- ingmediaconsumptionhabitsofmassaudiences.al- thoughthereisinterdependencebetweenthechanges inmediamarkets,technologyandtransformingaudi- ences,wewillexaminethisprocessfromtheaudience perspective.
asthemajorityoftraditionalmediacompanies(and thusmediamanagers)stillaimtoreachanddealwith mass audiences, we aim to identify media consump- tion-based audience clusters among Hungarian inter- netusersinthispaper.Wehaveintegratedgamingas anewandemergingmediaindustrysegmentintoour analysis.Foremost,weuseanintegratedapproachof traditionalmassmediaconsumptionandnewerdigital
media types and then present our findings through a kaleidoscopeview.
Weaimtodocumentemergingmediaaudiencesand theirrelationtomassmediachannelsaswellastogive anoverviewofthepotentialnewsegments,whichpro- videdirectionsfordecisionmakersinmediamanage- ment.
Theoretical Background
The value chain concept and its modified version in participatory cross-media environments helps create the market context for audience segment identifica- tion.contentprovidersonthemediamarketandmedia companies exert their influence through the packag- ingofpiecesofindividualcontent(e.g.,articles,vid- eos,shows,films,series,etc.)andcontentwithinand
Zsolt Varga – Nóra NyIrŐ
ThrOUgh The kaleIDOsCOpe:
meDIa CONsUmpTION
paTTerNs IN The parTICIpaTOry CrOss-meDIa era
The paper aims to identify actual media audiences of different mass- and non-mass media types through identifying those audience clusters consuming not different but differentiable media mixes. A major concern of the study is to highlight the transformation of mass media audiences when technology, digitalization and participation behaviors are able to reshape traditional audience forms and media diets, which may directly affect the traditional media value chain and in turn the thinking and decision making of media managers. Through such a kaleidoscope the authors examined media use and consumption patterns using an online self-reported questionnaire. They developed different media consumer clusters as well as media consumption mixes. Based on the results of the study the authors can state that internet use is today’s main base of media consumption, and as such it is becoming the real mass media, replacing television. However this “new” media has a completely different structure, being more fragmented with smaller audience reach.
At the same time, television is keeping its audience. However, there are emerging segments self-reporting non- or light television viewing. This is how the question of the viewer-television relation among different television viewer clusters evolves. At the same time only gaming exhibited demographic differentiation of audiences based on gender.
Keywords: media consumption, media audience clusters, digital media, gaming, media management
aroundthese(e.g.,commercials,trailers).Throughthis sorting,selectionandpackagingofcontent,providers deliver continuous quality control and thus build up theirownbrand,creatingbrandvaluefortheirchan- nels.
intheageofmulti-channelmediaandmulti-chan- nel television, i.e., in the analogue world, the mass audiencebreaksupandgroupand/orindividualtastes areservedbynumerousthematicchannels(mcquail, 2000).Thiserabeganinthe1980sintheamericanand european markets. content supply grows in parallel withthenumberofchannelsandafragmentationand polarizationoftheaudiencegetsunderway.
The digitalization of the multi-channel model al- lowedaccesstoanevenbroaderrangeofmediatypes andchannels.moreandmorecontentisavailable,al- thoughgenerallystillatadefinitemoment.Forexam- ple,theentryofdigitaltechnologyintothetelevision market brought computer hardware and many televi- sion-related applications, like recording video onto harddiskbymeansofadigitalvideorecorder,aswell as recording concurrently live programs without the need for an additional storage device (e.g., cassette, disk,etc.)(Nyirő,2011).
Should we emphasize the most influential mass media(regardingaudiencevolumeandadvertisingin- come)–namelytelevision–itisworthrecallingNe- groponte’shypothesis(1995),formulatedintheearly 1990s.inhisforecastondigitizedmediaconsumption Negropontearguedthatthefutureoftelevisionisinon- demandvideo.inaperiodwhereeachviewerhashis/
herownchannels–whichareplaylistsofcontentcom- piled by the users themselves – traditional television viewingwillloseitsjustification.Timeshiftingwould disappear as, by reaching content producers directly (betheyprofessionalsorcivilians(web2.0)),thisphe- nomenonwouldonlyapplytolivebroadcasts.atthe same time, his “my channel” hypothesis overlooked thetransactioncoststoindividualviewersthatarerath- erhighaseditinganown-programflow(byselecting, rating,compilingnumerousavailableprograms)would require considerable and time-consuming effort from theuser.Takingintoaccountthatmostviewersarefar
multiplatformandcross-mediacontentproduction,and interaction between the media industry and the audi- ence(Nogueraetal.,2013).
media companies are changing their production and distribution routines – especially through digital platforms–becauseoftheincreasingopportunitiesfor audience participation, in more and better ways that are still not optimized by the media. Today’s media marketisaco-producedlandscape,withinwhichaudi- enceandmediaareinterchangingtheirrolesconstantly (Nogueraetal.,2013).
Theconceptofvaluechainanalysiscoverstheverti- caldeconstructionordisaggregationofthevariouspro- cessesandrelationshipsintheindustry.itispossibleto technicallyseparatethestagesrequiredintheproduc- tionofanygoodorservice.examinationisconducted bybreakingtheindustry’sactivitiesupintoanumber ofdifferentstagesoffunctionsusuallysignifyingdif- ferentmarketplayersandorganizationsbehindthem:
this process is called vertical deconstruction (Doyle, 2002).
inthecaseofmediaindustries,therearethreestag- esofdeconstructioninthesupplyorvaluechain.These stages are production (content creation), packaging (newspaper,magazinecreation)anddistribution(phys- icalanddigital).Theprocessbeginswithwriters,jour- nalists,musiciansandnewsproductioncompaniescre- atingcontentforjournals,newspapersormagazines.in thetraditionalsupplychain,theproducers’outputtakes the form of inputs for a succeeding packaging stage.
publishinghousesaggregatecontentaswellasassem- bleitintoamediaproduct(newspaper,magazine,news website,etc.)orservicethatcanbesoldtocustomers, sometimesproducingthematerialaswell.Finally,the audiencereceivesthecontentthroughphysicalorelec- tronicordigitaldistributors.Forexample,inthecase oftheprintindustry,readersgettheircontentviasub- scriptionintotheirmailbox,buyitatnewsstandsorget itfreeofchargeatdistributionpoints.Recently,audi- enceshaveaccesseditonlineviainternetormobile.
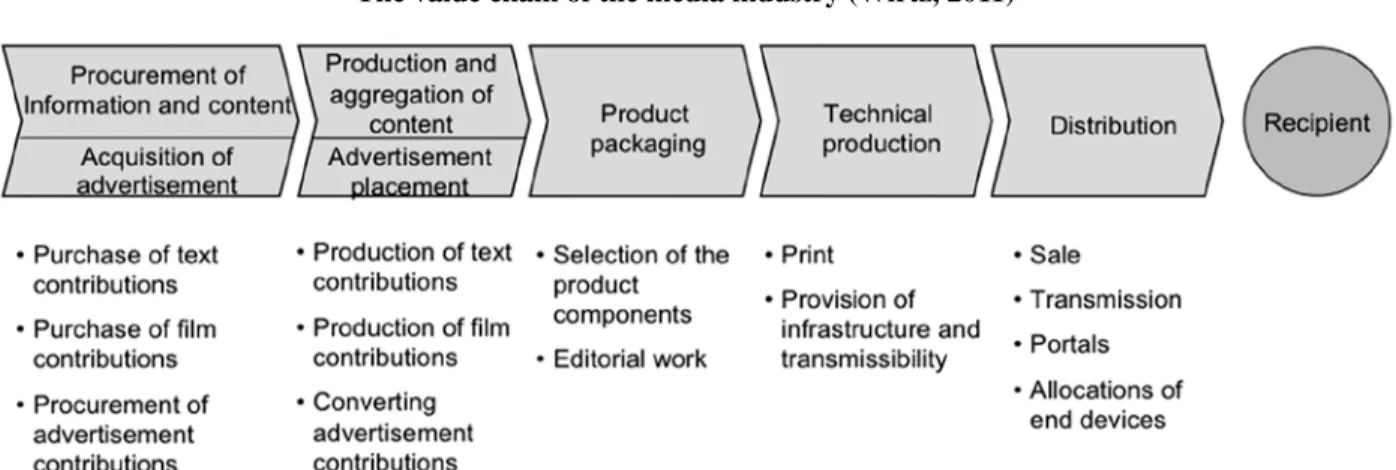
Thevaluechainmodelintheconvergent,cross-me- diaenvironmentofthemediaindustrycanbedescribed throughamorecomplex,five-stagemodel (see Figure
tioncanbegin.mediacompanieshaveseveraloptions indistributionandawiderangeofplatformstodeliver torecipientsortheaudience.Withconditionalaccess, consumers or recipients or audience members may havetopayforaccesstothemediaproductandcontent elementsatthefinalstage(Wirtz,2011).
another value chain model called the multimedia valuechainmodelwasintroducedinmediaindustries (Wirtz,1999).emphasisontechnologydrivenbynew stakeholders is part of the model. Such stakeholders act as value-added service providers through naviga- tionandinterfacing,thusofferingtoolsforconsumers toaccessmediacontent.Sabat(2002)highlightedhow
themobilewirelessenvironmenthasmorespecialized rolesandentitiescomparedtopresent,traditionalme- diacompanies.inordertotransfercontentonamobile wirelessplatformitisnecessarytoworktogetherwith mobilewirelesscontentserviceprovidersandnetwork infrastructure providers as well as user interface and accessdeviceproducers.
Byincludingallthenewstakeholdersoftraditional mediacompaniesandkeepinginmindthattodaythe productionofdigital(onlineandmobile)contentisin- evitable,wecanconsidertheparticipatorycross-media valuechainmodelproposedbyNogueraatal.(2013).
(see Figure 2)
Figure 1 The value chain of the media industry (Wirtz, 2011)
Figure 2 Model of participatory cross-media publishing house value chain – including sharing and distribution by users
(Noguera et al., 2013: p. 182.)
inourempiricalstudywehaveemphasizedmedia consumptionhabitsandpatternsoftheHungarianin- ternet user audience. We aimed to identify new clus- tersandthesegmentstructureofmediaaudiences.The identificationofthesesegmentshaveimplicationsfor traditionalmediacompaniesaswellasforcross-media companies in order that they may reshape and orient theirplatformmixandcontentmixbasedonthepro- filesofclusters.
Research questions and propositions
inthisstudyweaimedtoidentifydifferentmediacon- sumption patterns among Hungarian internet users.
Based on the theoretical background as well as our previous research, our main hypothesis was that the perceptionofasolid,somewhatsimpleaudienceisno longer viable in the cluttered media landscape of the present.
Wepresumedthatbesidesthewidespreaduseofthe internet, television will become less popular and the consumptionofaudiovisualcontent(filmsandseries) willsplitaccordingtoplatform.Wethinkthattheless- documenteduseofdigitalgamesmighthaveanemerg- ingroleinmediaconsumptionpatternsaswell.
Ourmainresearchquestionwas:
What type(s) of media audience clusters can be identified in today’s participatory cross-media envi- ronment in Hungary?
in addition to the main research question we had severalsub-questionsandpropositionsregardingnew audiencestructureanditscharacteristics.
Wealsoaimedtofindanswerstothequestionsof whatthemaindefiningmediatypesareincasesofau- dienceclusters,andhowmediamixesofdifferentclus- tersarestructuredandcomposed.
Weproposed,however,thatallclusterswillreveal multimediamix-basedconsumption,butthattherewill be one or two leading media types which drive the mediaconsumptionofthegivencluster.Wealsopre- sumedthatgamerswouldappearasaclearlyseparate
Data, variables and sample Questionnaire and variables
Data collection was conducted online with a self- reportedquestionnaire.Thequestionnairewasdistrib- uted through social media channels using snowball methodology. The sample is not representative but servesasthebasisforanexploratorystudyofthekalei- doscopeviewofHungarianinternetusersandyounger agegroups.
Thequestionnaireconsistedoffourdifferentparts:
mediaconsumptionasanalyzedinthecurrentpaper(17 items),ageneralmediagratificationblock(9items),a specificvideogamegratificationblock(20items)and ademographicblock(4items).
Wechoseandgeneratedtheitemsbasedonaprevi- ous study (see Nyirő et al., 2012). We did not try to coverallmediaconsumptionsituations,butfocusedon screen-related actions and emerging new media con- sumptionhabits.Theitemsreflectthemediaformsand contentconsumedbyyouth.Weaimedtogetthemost accuratedatawithoutmakingtheprocesstooabstract forrespondents.itisclearthatmostofthescalesare nominal; we used them as metrical scales, accepting thelimitsoftheresearch.
Description of the sample
universitystudentsandvariousrespondentsreached throughsocialnetworksfilledoutthequestionnairein mayof2012.participationinthesurveywasvoluntary.
university students received extra credit for various courses, while others were not offered any incentives.
Thesampleconsistedof450respondents.However,dif- ferentquestionsreceivedavaryingnumberofanswers, duetoincompleteanswers.Theuniversitysub-sample wascomposedof297respondents,whilethesocialnet- worksub-samplewascomposedof153respondents.as seenbelow,thesocialnetworksub-samplealsoinclud- edaveryhighratioofuniversitystudents,andthuswe integrated and analyzed the two sub-samples together, considering it homogenous enough for the university studentagegroupandlifestage.
Therewere194(43%)menand256(57%)women
analysiswasutilizedtoidentifygroupswithdifferent media consumption patterns. Our aim was – in line withthemethodologyused–toidentifyrelativelyho- mogenous groups in the sample based on the differ- ent forms of media consumption. We used the factor analysisapproachtorallythevariablesthathadahigh correlation,thustheclusteranalysiswasnotbiasedby these correlations. in addition to cluster analysis, we explored the factors with a multidimensional scaling methodtounderstandthenatureofthefactorsidenti- fied(Sajtosetal.,2007).
Results, discussion and limitations Results of the factor analysis
Thedescriptivestatisticsofmediaconsumptionvar- iablesareavailableintheappendix(see Table 1).We reducedtheinitial17itemsto6well-differentiatedfac- torswiththeaidoffactoranalysis.Themainindicators ofthefactoranalysiswerethefollowing:kmO=0,598;
the result of the Bartlett test: approximate chi- square=929,205;degreeoffreedom=120;significance 0,000.Thesixfactorsexplain59,419%ofthevariance, whichisanacceptablelevel.Thevariablesareeligible forfactoranalysis,althoughtheirqualityismediocre.
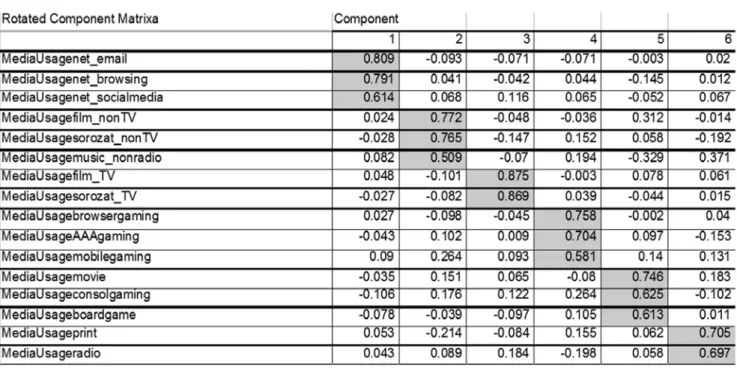
Weconductedmaincomponentanalysis.Thecorrela- tionmatrixandthemaincomponentanalysismatrixare available in the appendix(see Table 2 and Table 3).
Variablesweregroupedalongthesixfactorsandone variable(bookreading)wasleftoutfromtheanalysis.
Leavingoutbookreadingwasmotivatedbythelackof correlationwithanyotherformofmediaconsumption pattern.itislikelythatitwasinterpretedtoowidely, and students did not use it coherently (it might have includedreadingcollegetextbooks,pulp,orseriouslit- eratureaswell).
Newvariableswereformedalongthefactors:the longestfigureofcohesivevariableswastakenforthe newvariable.Wechosethismethodinsteadofthesim- pleaveragebecauseofthecharacteristicsofthevari- ablesandourgoalofmeasuringfrequency.Thenew variablesexpressedthefollowingconsumerpatterns:
• netuse:internet:e-mail,browsingoractivepres- enceonsocialsites–factor of online activities, expressing internet use,
• watchingTV:watchingfilmsorseriesonTV–
entertaining and recreational content on TV sets,
• new entertainment forms: watching series and filmsbutnotonTV;listeningtomusic,butnot onradio–television content and music consump- tion on non-traditional platforms, probably PC or laptop,
• video gaming: gaming on mobile phone or computer(withinstalledgamesorthroughweb browsers)–gaming activity on a digital platform,
• non-traditionalmedia:boardgameswithfriends, gamingonconsolesorvisitstothecinema–rare- ly done activities or those that are not represent- ed in the sample, very different media compared to the prevalent ones,
• oldschoolmedia:readinganewspaperormaga- zine, listening to the radio –according to the literature, media that is used by the older gen- eration; in other words the use of traditional, long-established media.
Thefactorsaboverepresentconventionalaudience researchtraditions.Thereisnoaudienceresearchmeth- odology for gaming as kind of media consumption.
gamingisexploredonlythroughad-hocresearchpro- jects.intheunitedStatesofamerica,theipsosgroup providesdetailedconsumerdataonproduct,publisher, buyingandgaminglevels.Thegamingconsoleisnot aswidespreadinHungaryasitisintheuSa,Western europeortheFareast.Boardgamesarethehobbyof asmallsegment,andduetotheircharacteristics,such gamescannotbeplayedoften.Thedescriptivestatis- ticsofthenewvariablescomposedalongthefactors areavailableintheappendix(see Table 4).
Table 1 Description of the two sub-samples.
Source: own tables
Variable University sample Social network sample
n % n %
Female male
172 126
58 42
84 68
55 45 Student
Notstudent
294 4
99 1
135 17
89 11 Nofulltimejob
Fulltimejob
290 8
97 3
67 85
44 56 Livingwithparents
Livingalone Livingwithfriends
183 39 76
61 13 26
52 36 64
34 24 42 ages:17–25years
ages:26–45years
285 13
96 4
59 92
39 61
Results of the cluster analysis
We conducted cluster analysis to find patterns of mediaconsumption.Ouraimwastogrouprespondents intohomogenoussubgroups,andsotobeabletoiden- tifyrelevanttargetaudiencesbasedontheirmediause andmediaconsumptionpatterns.
Analysis of the sample
For the first step of the cluster analysis we tested thesampleforsalientvalues.Thisstepisnecessarybe- cause these salient values might affect the clustering process.itismoredifficulttoidentifycorrespondence between other elements, and these correspondences might be distorted as well. We examined the sample withsinglelinkage,nearestneighbormethodandeudi- clideandistance.Onlytworesponsesstoodoutatfirst glance,however,accordingtothedendogram,thede- greeofdifferencewasnotsomuchastojustifyleaving outthesetworespondents.
Determining the number of clusters
Based on the elbow criterion, we tried to analyze two, three and four clusters (see Figure 2 in appen- dix),andbasedonthesizeandstandarddeviationof groupswechosethefour-clustervariant.Weusedthe Wardmethodofclusteranalysis.Wedidnotchoosethe two-cluster solution because the homogeneity of the clusterswashigherthanfortheentiresampleinfour outofsixinstances.(Wefoundahighernumberofless homogenousclusterswhentryingthethree-clusterso- lution,andthefour-clustersolutioncarriedmoreinfor- mationontelevisionviewingandgaming.)Thefour- clustersolutionproducedclusterswithdecentsample sizes(196,127,58,69).
cluster centroids, standard deviations and sample sizesaresummarizedinTable5intheappendix.
Thefourclustersbymediausecomparedtothetotal samplecanbedescribedasfollows:
cluster 1: the largest with 196 members (43,6%),
‘gamer’,almostnon-TVviewer.
• notsohomogenouscomparedtothetotalsample regardinginternetuse,
cluster 2: large, with 127 members (28,3%),
‘avoider’,avoidsTVandgaming.
• nodifferencefromtotalsampleregardinginter- netuse,
• notsohomogenouscomparedtothetotalsample regardingnewmediause,
• lessfrequentTVviewerthanthetotalsample,
• lessfrequentgamingthanthetotalsample,
• no difference from total sample regarding non- traditionalmediause,
• no difference from total sample regarding old schoolmediause.
cluster3:smaller,with58members(12,9%),‘Ver- satile’,TVviewerandgamer,whoisopentowardold schoolmediatypesaswell.
• nodifferenceregardinginternetusecomparedto thetotalsample,
• nodifferenceregardingnewmediausecompared tothetotalsample,
• viewsTVmoreoftenthanthetotalsample,
• doesgamingmoreoftenthanthetotalsample,
• regardingnon-traditionalmediause,theydonot differfromthetotalsample,
• usesoldschoolmediamoreoftenthanthetotal sample.
cluster4:smallerwith69members(15,4%),‘pris- onerofTV’,TVviewer,avoidsgaming.
• lesshomogenousininternetusecomparedtothe totalsample,
• nodifferenceregardingnewmediausecompared tothetotalsample,
• viewsTVmoreoftenthanthetotalsample,
• doesgaminglessfrequentlythanthetotalsample,
• regardingnon-traditionalmediause,theydonot differfromthetotalsample,
• less homogenous compared to the total sample regardingtheuseofoldschoolmedia.
Theclustersdonotdifferfromeachotherregarding internetuseornon-traditionalmediause.
Demographic description of clusters
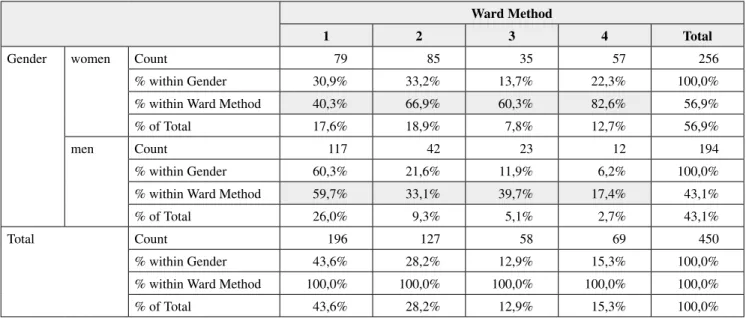
gaming is a masculine activity and the results of proportionsofclusters1and4confirmthiscommon belief.inclusters2and3theproportionofwomenis larger,being66,9%femaleto33,1%male,and60,3%
femaleto39,7%malerespectively.Therefore,theyof- tenavoidTVandgamingsimultaneously,andchoose mediafromawiderpallet.Otherdemographicvaria- blesdidnotmeettherequiredsignificanceleveland/or thenumberofthecellswasinadequate,sowemaycon- cludethatnodifferenceisidentifiablebasedonother demographicdata.
Results of multidimensional scaling
Formultidimensionalscaling,weusedthepROXScaL moduleofSpSS,creatingthefactorsandthematrix, thenmeasuringanddepictingtheeuclideandistance.
Weexaminedthepreviouslyidentifiedsixfactors:net use,TVviewing,newentertainmentforms,videogam- ing,non-traditionalmediaandoldschoolmedia.The two-dimensionalfittingwasgood:thevalueofstress was0,0458.ThealignmentcanbeseeninFigure3.
Factors are divergent enough: the farthest are tradi- tional media and internet, while the closest are new mediaformsandtheinternet.Thefirstdimensionex- pressesthefrequencyofuse:theinternetandnewme- diaformswerethemostfrequentlyusedmediawhile non-traditionalmediaweretheformsusedleastoften.
apossibleexplanationoftheseconddimensionisthe interactivityofthemedia:videogamesarehighlyin- teractive,whiletelevisionandotheroldschoolmedia (radio, newspapers and magazines) can be described
as lacking interactivity. another possible explanation for the second dimension is the novelty factor of the media:intheanalyzedpopulation,televisionisanold medium,whileinternetandnewmediatypesconnect- edwithpersonalcomputersaresomewhatnewer,but videogamingisthemostrecentmediaform(including mobilegaming).
Table 2 Gender and clusters cross-tables. Source: own table
Figure 3 Results of the multidimensional scaling. Source: own
figure Ward Method
1 2 3 4 Total
gender women count 79 85 35 57 256
%withingender 30,9% 33,2% 13,7% 22,3% 100,0%
%withinWardmethod 40,3% 66,9% 60,3% 82,6% 56,9%
%ofTotal 17,6% 18,9% 7,8% 12,7% 56,9%
men count 117 42 23 12 194
%withingender 60,3% 21,6% 11,9% 6,2% 100,0%
%withinWardmethod 59,7% 33,1% 39,7% 17,4% 43,1%
%ofTotal 26,0% 9,3% 5,1% 2,7% 43,1%
Total count 196 127 58 69 450
%withingender 43,6% 28,2% 12,9% 15,3% 100,0%
%withinWardmethod 100,0% 100,0% 100,0% 100,0% 100,0%
%ofTotal 43,6% 28,2% 12,9% 15,3% 100,0%
We will now answer our research question by in- terpretingtheresults.itisimportanttostudythedif- ferent media in the context of other media consump- tion.Distinctgroupscanbeidentifiedbasedonmedia consumptionpatternsamongyouth,eventhoughgiven the lack of a representative sample we are unable to generalizeourstatements.
avoidance of television is a new pattern among youngpeople.Whilethewhite-collarattitudeof‘liv- ing without television’ might be a reason, attractive programs (films and series) are difficult to catch in the set program structure of broadcasting, and the presenceofcommercialbreaksmakestheexperience annoying.Forthestudiedgroup,internetandtheper- sonalcomputeristheprimarymediaplatform.There aretwodistinctwaysofavoidingtelevision,asseen bytheconfinementof‘avoider’and‘gamer’clus- ters.
inthelattercase,videogamingisanotablealterna- tiveandtakesaleadingrolealongsideothermediain therespondents’life.Fortheformercase,theaudience avoidsgamingaswellastelevision.Bothgroupscan bedescribedwithsimilarmediaconsumptionpatterns regardingothermediatypes.Theroleofgenderisim- portant in this case: in the ‘gamer’ group, males are overrepresented, while ‘avoider’ group exhibits of a highershareofwomen.Thedifferenceingenderhasa significantroleinattitudestowardvideogames:how- ever,datafromotherculturessuggeststhiswillchange.
intheunitedStates,wherevideogameshavealonger history,theratioofgenderingamingismorebalanced (eSa,2011).
Wecandifferentiateathirdgroup,the‘Versatile’.
Theyplayondigitaldevicesandwatchtelevisionmore often, choosing old school media more often, while using the same amount of internet, new media and non-traditionalmediaforms.Thehigherproportionof womenisinlinewiththeacademicliteratureandaudi- encedata.useofprintmediadecreasedlessinthepast fewyearsamongwomenthanmen,andisapartofthis factor.
Finally,televisionviewingandanalmosttotallack of gaming characterizes the fourth group. Regarding
mightchoosefromawiderselectionofmediatypes.
Wefoundtheresultsofthemultidimensionalscaling important as well, especially the second dimension.
Thefrequencyofuseor‘popularity’ofmediatypes among the young is self-explanatory. However, the distancebetweenvideogamesandoldschoolmedia isinteresting.amongyoungpeople,notonlyistel- evision considered an antiquated media, but gaming isconsideredbysometobearealalternativeforen- tertainment.
Limitations
Thenon-representativenatureofthesamplelimitsour abilitytogeneralizetheresults,andthemethodologyof clusteranalysisbearssomelimitsaswell.Thestepsof theclusteranalysisareonlyoneofthemanydifferent approaches that researchers might apply. The expan- sionofmediaconsumptionvariablesoruseofadiffer- entscalemightaffecttheresults.
Thecurrentstudyisbasedmainlyonuniversitystu- dents’andactivesocialnetworksiteusers’responses, wholeadverydifferentlifestyleswithdifferentmedia consumptionhabits.Theirlifestyle,attitudesandme- diabehaviorisdifferentfromthatofthegeneralpublic in many ways, thus the results of the study must be exploredinotheragegroupsandlifestagegroupsas well.
inthefuture,amoredetailedandmetricscaleshould beusedtomeasuremediaconsumptionhabits,which would serve as better input data for cluster analysis.
The contact of media platform and activity sets lim- itstogeneralizationregardlessofconsiderationsofthe qualitativeresults.Non-traditionalmediatypesmustbe reviewed, because their nature makes them very dis- tinctivecomparedtoothermediatypes:someofthem areexpensive,time-consumingorrequirethepresence ofotherpeople.
Therecentspreadofsmartphonesandtabletsmakes themanimportantplatformthatshouldberesearched inthefutureaswell,becausetheyhavethepotentialto recolorthemediapalletoftheaudience.
Theidentifiedaudiencesegmentshaveafewcom- moncharacteristicsregardinginternetuse.itseemsthat internet use is today’s main base of media consump- tion,sotherealmassmediatodayisnottelevisionbut the internet. However, we have to keep in mind that internetasamediumhasacompletelydifferentstruc- turethantelevisionanditmeansfarmorefragmented contentconsumptionandthussmallerandfragmented audiencereach.Wecanstatethattheinternetasaplat- formandmediachannelisinevitableforanyaudience andmaybethebestwaytoreachandattractotheraudi- encetypesaswell.
moving on to the next “big” media, i.e., televi- sion,wefacequiteadifferentmediaaudiencepicture.
Therearestillsegmentsthatarehighlydependenton televisionandthatallocateagreatdealoftimetoits consumption, while there are others who claim to be almostnon-viewers.Thismeansthatbasedontelevi- sion consumption self-perception the media audience hasbecomeamixedaudience.Formediamanagersthis is an important conclusion, as being in the television industrytheyhavetokeepinmindhowandtowhatex- tentdifferentaudienceclustersrelatetotelevisionand howintensivelytheyconsumetelevisioncontent.We canidentifydifferentmediamixusagepatternsamong different segments, which may give some indication for television managers on how to reach and attract those moving into less television-oriented consump- tion directions. also, we can see that old school and traditional media use and consumption are present in differentaudiencesegments.
Based on the clusters’ demographic characteristics wecouldnotidentifyanyspecificationofthedifferent audienceclusters,exceptfortherelationbetweengender andgaming.Thisprovesthataudiencesaremuchmore content,psychographicorotherpattern-related.Thetra- ditionaldemographic-basedsegmentationapproachhas muchlessrelevancethanbelievedtothispoint.
an overall conclusion is that the kaleidoscope of media consumption patterns provides media manag- ers with a challenging picture and audience market:
wecannotclaimthatthereexistclear,uniqueandvery homogenous media audiences. We are undergoing a
transitioninaboomingdigitalizationera.aninterest- ingaudiencesegmentstructureisprovidedbycluster andmDSanalysis,whichmayserveasanindicatorof audience consumption trends, interrelations between mediatypes,andinter-andcrossmediaconsumption habits.Thisisespeciallythecaseforyoungpeoplein higher education, who form the foundation of future consumergroups.
References
Doyle, G.(2002):understandingmediaeconomics.London:
Sage
Entertainment Software Association (2011): 2011 Sales, Demographic and usage Data, The entertainment Software association, http://www.theesa.com/facts/
pdfs/eSa_eF_2011.pdf,Retreived:Jun5,2013
McQuail, D.(2000):mcquail’smasscommunicationtheory.
London:Sage
Negroponte, N.(1995):Beingdigital.NewYork:alfreda.
knopf
Noguera J.M. – Villi M. – Nyirő N. – De Blasio E. – Bourdaa M. (2013): The role of the media industry when participation is a product. in: carpentier, N., Schrøder k., ch., Hallett, L. (eds) (2013): audience Transformations: Late modernity’s Shifting audience positions.London:Routledge
Nyirő N. – Nagy G. – Markos-Kujbus É. – Varga Zs.(2012):
internet and only the internet?, emma conference, Budapest,February10–11,2012
Nyirő, N.(2011):mediatechnologyinnovationacceptance and diffusion. Doctoral thesis. Budapest: corvinus universityofBudapest
Sabat, H.K. (2002): The evolving mobile wireless value chainandmarketstructure.Telecommunicationspolicy, Vol.26,No.9–10:p.505–535.
Sherry, J. – Lucas, K. (in press): Video game uses and gratificationsaspredictorsofuseandgamepreference.
WestLafayette,indiana:purdueuniversity
Wirtz, B.W. (2011): Textbook – media and internet management.Heidelberg:gablerVerlag
Wirtz, B.,W. (1999): convergence processes, value constellations and integration strategies in the multimedia business. international Journal on media management,Vol.1,No.1:p.14–22
appeNDIx
Table 1 Correlation matrix of media consumption variables
Table 2 Rotated component matrix
(n=450,kmO=0,598;describedvariance=59,419%)