T
The main focus of the study is the analysis of the effects of the regulatory changes on the level of local governments that have taken place in the past decade, and it explores the management and expected development trends in one of the segments with the largest population, towns with county rights.over the nearly thirty years since the politi- cal transition, the system of local governments in Hungary has faced a lot of challenges and difficulties. The history of local governments has not followed a steady development path, there have been distinctive stages, some of them critical, but we now typically see sound management at local governments.
The study analyses the situation of the Hun- garian local government system, with a spe-
Szilárd Hegedűs – Csaba Lentner – Petronella Molnár
Past and Future: New Ways in Municipal (Property)
Management after Debt Consolidation
In Focus: Towns with County Rights
Summary: The indebtedness of local municipalities is of high concern all over the world. In Hungary, after the beginning of the regime change and especially after the 2004 EU accession, when they were used as own contribution for accessing community investment development resources, bank loans and municipal bonds significantly deteriorated the financial stability of the local governmental system. After the review of the process of the accumulation and consolidation of debts, the study explores, through the example of towns with county rights, the state funding regime, which has replaced the formerly passive, debt-accumulating management and has provided stability and predictability, and the Modern Cities Programme, which is now the mainstay of development policy. Another unique feature of the paper is that it also provides numerical indicators to substantiate the improvement of the revenue structure, profitability, liquidity and capitalisation of towns with county rights. The most important result of the study is that it presents the evolution of the Hungarian local government system, the changes in the regulatory environment, and the changes in the institutional system since 2010. In the empirical research part of the study, towns with county rights are under scrutiny. In the study, we explored the positive effects on asset management, the improving situation, and expected future trends in development policy.1
KeywordS: management of local governments, efficiency analysis, consolidation, Modern Cities Programme JeL codeS: H71, H74, H72, H76
E-mail address: lentner.csaba@uni-nke.hu
cial focus on the management of towns with county rights and on the current development policy environment, while also evaluating the role of the state Audit office of Hungary in improving the management of local govern- ments.
The study provides an overview of past events and of the systems-based features of the current situation, i.e. the process in which local governments (especially those of towns with county rights), once passive stakehold- ers in public finances, turned into active eco- nomic entities that perform public services, shaping their environment.
THE sHAdows of THE PAsT:
THE lITErATUrE on THE IndEbTEdnEss of loCAl govErnMEnTs And
THE rEgUlATIon of THEIr oPErATIon In An InTErnATIonAl ConTExT
To put our focus area in context, we start discussing literature with the theory of fiscal federalism. This group of theories evolved in federal states, but its results provided a pattern that could also be applied in unitary states and supranational organisations like the European union. A key message of this group of theories is how tasks should be distributed between the central and the local level, what powers local authorities should have and to what degree, i.e. how to set the limits of their operation and their degree of independence in management.
The issue of indebtedness and debt control is a part of this.
In literature, indebtedness is traced back to several causes and aspects. The study of Beck and Stone (2017) analyses the factors that in- fluence the local governments’ ability to con- tinue their operation, i.e. the principle of go- ing concern in accounting. The study reflects on the fact that there are signs of bankruptcy that are objective and noticeable for the citi-
zens. A local government is considered dys- functional when it fails to adapt to changes and cannot provide public services the way taxpayers expect it to. In addition, the study examines what factors have an impact on the bankruptcy of a local government, how effec- tive governmental initiatives are in tackling or preventing these situations.
De Vicente Lama (Vicente et al., 2017) pointed out an interesting aspect in her study.
The study assessed the accounting consolida- tion of the companies of spanish municipali- ties, and the effects of this consolidation. The authors found that municipal companies may be used to ‘hide’ municipal budget deficit outside the budget, and, as a result, to make the financial situation of the local government look better than it actually is.
In the united states, the essence of tax in- crement financing (TIf) in the development financing of local governments is that current bond issues by local governments provide re- sources for development and renovation, and the resulting increase in the value of real prop- erty is covered by the increase of real property taxes. These did not result in high indebted- ness after the financial crisis, as local govern- ments could increase their tax revenues at a sufficient pace (Luby, Moldogaziev, 2014).
Sági (2015) and sági, Tóth (2009) exam- ined the role of and relationship between the central governance and municipalities, and municipalities and banks. They found that as the treasury system was implemented at local governments, financial flows of institutions became easier to plan and monitor. In addi- tion, there was a considerable improvement in stakeholders getting up-to-date information, especially regarding liquidity.
If we examine indebtedness internation- ally, we see that besides changes in public ad- ministration, changing international financial markets also had a significant impact on the indebtedness of local governments. This is due
to the fact that in the 1960s and 1970s, bor- rowing became popular because of the low in- terest rates, and as a result local governments were really active on the credit market. This process was enhanced by the negative real borrowing rates in the 1980s, which discour- aged saving and increased debt financing. The resulting repayment obligations later led to a decline in investments in the 1990s (Hal- mosi, 2005). This was particularly an issue in Germany, where, after the reunification, the federal state took over the debt of local gov- ernments (Dohnanyi, 2002).
In Italy, permissive regulations did not take into account that debt financing was not only used for investments, but was suitable for cov- ering operating deficit, and this process led to the point when local governments were in a debt trap in 1976. The Italian convergence programme in the mid-1990s could only re- duce the debt of local governments (Halmosi, 2005).
The main point of budgetary control is that there is a certain, strict or lax, state-level debt control, which Dafflon (2010) calls the golden rule of financing. under the golden rule, lo- cal governments can only use current revenues and tax revenues for their operational expend- iture, while they can use long-term loans or their equity or the combination of the two to finance investments. Differences among coun- tries in terms of debt control only exist with regard to the upper limit of indebtedness. one practical reason for the use of the golden rule of a balanced budget is that as it regulates the accumulation of fixed assets, public services provided by local governments will be accessi- ble to several generations. This means that the focus should be on intergenerational distribu- tion in financing as well (Heijdra, Meijdam, 2002).
from an operational approach, there are three known ways of controlling the indebt- edness and borrowing of local governments.
In the first case there is market financing, where market discipline is dominant, in the second case administrative measures are taken to make borrowing subject to approval, and in the third case, borrowing is effectively re- stricted according to certain variables by cen- tral regulations (Ter-Minassian, craig, 1997).
The regulatory basis of maintaining govern- ment deficit in the Eu was examined by Van Rompuy et al. within the stability and Growth Pact, and they also analysed it in the local sub- system of oEcD member states (Van Rom- puy, 2016). Monacelli et al. (2016) and Bur- ret and Feld (2018) described how fiscal rules work through Italian and swiss examples.
These rules are important also because they guarantee the liquidity of local governments and the going concern principle on micro and macro level as well (Duve, Dreschsler, 2011).
Foremny (2014) examined the applicability of fiscal rules in the period before the crises and concluded that despite the rules, financial equilibrium was not always maintained—this was confirmed by Levaggi and Zanola (2003) through the example of Italian regions.
HUngArIAn loCAl govErnMEnTs AfTEr THE PolITICAl TrAnsITIon And TodAy
The councils Act, which came into effect in the 1950s, disrupted the system of lo- cal governments in Hungary, as it basically eliminated local autonomy, which is shown by the fact that it considered local authorities as de-concentrated bodies besides the centralised state system. The role of county councils were stronger, as it was clear in the ‘distribution’
and financing of investments as well, yet their competence was limited, as they had no substantial influence on central decisions.
After the political transition, counties were marginalised, and an atomistic local govern-
ment structure evolved, where the focus was on municipal governments. The history of local governments in Hungary after the po- litical transition can be analysed from several aspects. These include the methods of regula- tion, the provision of funding, the evolution of public tasks and the financial situation. In view of this, the history of the local govern- ment system in Hungary since 1990 can be divided into four stages (see Table 1), which were significantly influenced by international factors as well. These include the accession to the European union and the global financial crisis that started in 2007 and reached Hun- gary in 2008. In addition to internal features, these factors had a great impact on the devel- opment of the local government system and its elements.
After 1990, the management of local gov- ernments was developed according to New Public Management, the prevalent trend of the era. This meant that local authorities were given considerable independence, including organisational structures and the freedom to organise services. In this period, some restric- tive rules were introduced, but due to the
generally lax control and weak budgetary dis- cipline, these were not enforced. What made the situation even worse was that an increas- ing number of tasks were transferred from the central public administration to local govern- ments without providing sufficient resources either in nominal or in real terms, which led to an operating deficit from the start.
The first turning point came in 1996, when restrictive elements appeared in economic reg- ulations, as the debt settlement procedure was introduced. The primary aim was to clearly define responsibilities in the crisis manage- ment of the operation of local governments.
This was when the borrowing limit was codi- fied, but it did not have the intended effect, as the supreme institution for the external audit- ing of public finances, the state Audit office of Hungary, could only indicate a breach but could not impose real sanctions.
After the Eu accession in 2004, quality re- quirements regarding the tasks of local gov- ernments increased, but no internal resources (from the central budget) were provided for this, especially after the 2006 convergence programme.
Table 1
Features oF the local government system aFter the political transition, in stages
stages no. of tasks Financing regulation
1990–1996 As provided for in the local governments Act
dominant role of state subsidies and contributions
very little in the economic field
1996–2004 Increasing tasks and quality requirements
decreasing state subsidies debt settlement, introduction of a borrowing limit
2004–2010 decentralisation decreasing state subsidies, increasing own revenues, external resources
no meaningful reaction to the situation
2011–Present recentralisation own revenues are important, task financing
Introduction of debt rules and budgetary rules
Source: own research (2019)
The causes of indebtedness
‘In theory’, the 2004 Eu accession promised a long-term increase in municipal investments in Hungary. However, resource-poor local governments did not have sufficient funds of their own for drawing down development resources, and they adopted the bridging solution proposed by the government and used bank funding, mostly in foreign currency, as own contribution. The 2006 (austerity) programme to adjust the convergence path, which tried to decrease the budgetary deficit by curtailing the education and health care systems and cutting the resources provided to local governments, only exacerbated the problem. However, economic conditions and borrowing limits were not settled satisfactorily.
After 2006, the debts of local governments increased (see Figure 1), mostly because of the foreign currency bonds issued and the foreign currency loans taken, especially as the increasing crisis led to the quick depreciation of the forint after 2007, which meant debt payments increased significantly and repayment seemed less and less attainable. The state Audit office of Hungary also predicted the risks arising from this, but had no power to do more. After 2006, we see an ‘irreversible’
indebtedness process as far as long-term liabilities are concerned, even though short term debts decreased to an extremely low level. After the Eu accession, in the first full programming period (2007–2014), lo- cal governments became the recipients of resources of approximately Huf 1,500–2,000 billion. The programmes, however, were mostly aimed at infrastructure development, but the returns on municipal investments did not cover the amounts payable to banks in connection with the developments. Typically local governments couldn’t even provide the operating costs of the investments that had been carried out. The chronic lack of
the required own contribution and the use of bank loans to secure resources led to the indebtedness of local governments, which became more vulnerable and this process had a negative impact on the stability of public finances in general. for example, the 2011 government debt target was not met because of the debts of local governments.
The sAo found that the main motivation for issuing bonds was to settle existing debts and, primarily, to secure the own contribu- tion required for investments co-financed by the Eu. one indicator of this is that no sec- ondary market developed for the bonds, they were subscribed by the account providing banks, which means this can be considered as
‘hidden’ borrowing. The reason for local gov- ernments securing resources by issuing bonds was that, as opposed to borrowing, there was no obligation to conduct a public procure- ment procedure for bond issues and also there were talks about a future tightening of bor- rowing regulations (which later proved to be unfounded) and local governments tried to avoid that in time. Atypical features included extremely long maturity, capital repayment moratorium in the first few years, foreign currency denomination (mostly cHf) and the lower interest rates it entailed. 50 percent of debts were not assigned to accumulation goals, contrary to the logic of economics, and until 2009, accumulation expenditure had been decreasing.
Kovács, Csillik (2012) examined the local governments’ exposure to financial institu- tions and the composition by currency. In their study they also found that the total net financial assets of local governments increased after 2010, turning from negative to positive.
considerable imbalances emerged in the operational and accumulation budget and the overall management of the local government system. In the local government system, there was a lack of operational and accumulation re-
sources, and as a result exposure to banks was increasing as wage, liquidity and credit agree- ments were regularly renewed. At the end of 2010, ongoing investments were burdened with future liabilities of Huf 1,154 billion.
Another substantial problem was supplier fi- nancing, which became widespread and was used by local authorities as a form of exter- nal financing in the operational budget. These risks were also confirmed by the sAo’s analy- ses. These established that exposure to banks was increasing, and that no reserves had been established to deal with this, there were no sufficient funds, and, as a result, the local gov- ernment sector carried risks for the national economy (Domokos, 2011; state Audit office of Hungary, 2012).
These circumstances together led to the development of a decentralised debt outside of the central budget, at local governments.
As a result, the financial capacity of local gov- ernments, which is the indicator of financial sustainability, became negative (Domokos, 2012). In practice, this means that local au- thorities could not even finance their existing debts, as the surplus of the operational budget did not cover the annual debt service. This would have directly led to bankruptcy for sev- eral local governments. Debts and financial difficulties developed unevenly, as different types of settlements faced different financial risks. Towns with county rights incurred con- siderable debts, their revenue structure was relatively stable. However, county local gov- ernments and small towns without substantial tax base could not fulfil the obligations arising from their increasing tasks. The fact that the costs of human public services increased and state subsidies covered only a fraction of that was highly instrumental in this.
Figure 1
external sources oF local governments
Source: Edited by the authors based on Mnb data (2019)
Billion HUF
Long-term bonds
Long-term loans Short-term loans
The two factors, the development of the accumulation deficit and of the operational deficit posed significant risks in themselves, and after 2012, the government believed the solution was debt consolidation.
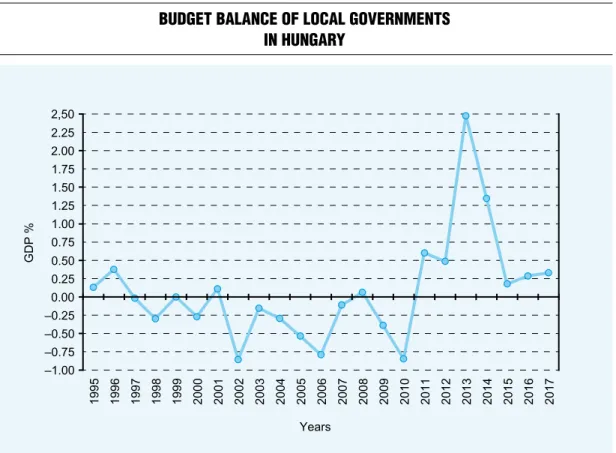
Another problem was posed by opera- tional difficulties. Figure 2 shows the budget balance of local authorities, and it is clear that the aggregated budget balance of the local governments was often negative in the 1990s already, but in the 2000s, the balance was negative every year with the exception of 2008.
The analysis of the budget balance also re- vealed that among the sources of revenue, ex- ternal, i.e. debt financing was becoming more and more prevalent, which is a symptom of the debt trap.
Local governments in the new regulatory environment
Within the period examined, the fourth stage started in 2010. The active engagement of the government with its economic policy started in 2011 with the debt consolidation, which, in four stages, took over all bank debts before 31 December 2013.
2011 was another turning point in the reg- ulation of the indebtedness of local govern- ments, which affected tasks, competences and financing, and rule-based budgetary practice became more prevalent. The new Local Gov- ernment Act was also passed this year.
Figure 3 shows to what extent the sector was compliant with the provisions of the budget- ary rule. The values were calculated as follows:
Figure 2
Budget Balance oF local governments in hungary
Source: Edited by the authors based on oECd data (2019)
the debt of local governments was divided by local tax revenues, which are a crucial part of own revenues. Management experience shows that local tax revenues amount to 90–95 per- cent of the local governments’ own revenues, with local business tax being very important, amounting to approximately 85 percent of local taxes. This means our calculations are stricter than legal regulations, as some sources of own revenue are disregarded.
We assessed how the ratio of debt and local tax revenues changed after 2011, as this was the year the stability Act came into force, in- troducing this ratio, setting 50 percent as the upper limit for–each–local government. The ratio was 219 percent in 2011, then declined to 32 percent in 2014 and to 26 percent in 2015. In 2016 and 2017, the rate increased again, but was still below the 50 percent toler- ance margin (it was 48 percent and 48.5 per-
cent). This means that on a sectoral level, local governments complied with the debt limit.
The role of the State Audit Office of Hungary after the changes in the management of local governments
As a result of legislative changes, the sAo had more control (see Table 2) and its audits covered new areas, including corruption and integrity risks (Pulay, Lucza, 2018; Németh et al., 2018). In addition to the issues examined, audits now also focus on risks arising from monetary and budgetary management (Pulay et al., 2017).
The stability Act and the regulations laid down in the Act on the Local Governments of Hungary made borrowing by local govern- ments subject to approval, but not the devel-
Figure 3
compliance with the Budgetary rule
Source: own calculations based on oECd data (2019)
debt / local tax revenue
opments co-financed by the European union.
However, new investments launched by local authorities cannot be financed from debt if the annual debt service is more than 50 percent of own revenues, which is a significantly stricter regulation than the previous one. Another ele- ment of the debt rule is that borrowing by local government-owned companies is also subject to approval, which is to prevent entities per- forming tasks outside the central budget from becoming indebted. The amendment coming into force in 2019 allows the owner local gov- ernment to provide guarantees at projects that are significant for the national economy. It is to promote the budgetary golden rule that no op- erational deficit may be planned in the budget.
In addition to the National Assembly, the state Audit office of Hungary also played an im- portant role in the creation of legal regulations (Domokos, 2016). After 2010, it was realised in the local government system that the cur- rent structure needed to be reformed – this was already seen necessary earlier, especially after the Eu accession, but there was no mandate to match the political will to implement such re- forms. The previous local government system, just like the system created after the political transition, took general trends and tendencies into consideration.
These are:
• achieving economies of scale in the framework of task performance,
• centralisation of tasks,
• implementation of budget rules, enhanced control,
• reform of the financing structure (see the last row of Table 1).
The role of the state Audit office of Hun- gary was also strengthened, it was given the power to sanction with respect to state subsi- dies, and it is clear that its role was adapted to the changing environment. certain audit and research recommendations of the sAo con- tribute to the continuous change of the regula- tory environment, which are transposed to le- gal regulations (for example when the stability Act was extended to cover local government- owned companies). New legal regulations al- low the sAo to audit state-owned and local government-owned companies as well. This was an important measure, as for good pub- lic sector management it is necessary to create and appropriately maintain a professional en- vironment for task performance (Domokos et al., 2016, Domokos et al., 2015).
Material and methodology
When discussing literature, we relied on the oEcD database: we examined the key macroeconomic indicators of the Hungarian local government system and we did calculations regarding compliance with the
Table 2
the tools oF the state audit oFFice oF hungary
prohibitive guiding
Keeping operational deficit under control Efficient closing of debt settlement procedures
Monitoring indebtedness decreasing integrity risks
Auditing investments Initiating changes in regulation
Enhanced supervision of the regulatory environment and sanctioning
scientific activities
Source: own research, 2018
debt rule. In the empirical part of our research, we reviewed the consolidated debt of county local governments with a time series analysis, with intensity ratio and per population. In the analysis of towns with county rights, we conducted a time series analysis on balance sheet and income statement data with chain and fixed-base indices. our analysis starts with 2014, as this was the year when the new public accounting regulation was introduced, and at the time of writing, 2017 is the last closed year, so the analysis does not include changes in assets induced by debt consolidation (e.g.
taking over hospital assets). To compile the database of the Modern cities Programme, we conducted document analysis on the available legal sources, and we conducted a time series analysis on these data.
CAsE sTUdy of Towns wITH CoUnTy rIgHTs
Debt consolidation
The process of debt consolidation had four stages, and it was the last two that had a significant impact on towns with county rights: the assumption of debt in 2013 and the last such measure in 2014. In 2013, the base of the tax consolidation was proportionate to the tax capacity of the settlements, and as such the assumption of debts by the state in the 2013 consolidation stage was differentiated, its volume was bigger in case of settlements with lower tax capacity and it was lower for settlements with higher tax capacity. The latter included towns with county rights. In 2014, the government made a decision to take over all debts, and the consolidated amounts changed accordingly (see Table 3).
Debt consolidation was the most signifi- cant in the case of towns with county rights, as in the two stages, it amounted to a total
of Huf 372.768 billion. In the first stage, in 2013, Huf 238 billion was assumed, while in the second stage, in 2014, the remaining Huf 134.8 billion was also taken over. These are significant amounts, especially when we consider the numbers in the next chapter.
The analysis of the consolidated amounts reveals that in the 2013 consolidation stage Huf 10.344 billion was assumed per settle- ment on average, the median was Huf 9.452 billion. In the second stage of the consolida- tion, in 2014, these values were Huf 5.862 billion and Huf 4.752 billion, respectively.
The average of the total amount was Huf 16.207 billion, and the average of the median value was Huf 15.116 billion.
The per capita amount of debt taken over is indicative of the intensity of debt assumption.
This value was the highest in Dunaújváros, Hódmezővásárhely and Pécs.
The consolidation also improved the li- quidity, debt service and revenue autonomy positions of local authorities. The reason for this is that instead of paying the foreign cur- rency denominated debt, a larger part of the revenues of the towns could be used for other purposes. As a result, revenues could be used as own contribution in aid procedures and for financing operation. In addition, the predict- ability of management also improved with the consolidation, as it eliminated the exchange- rate risk, which had a huge impact on finan- cial planning security at local authorities.
Property management at towns with county rights after the consolidation The left axis of Figure 4 shows fixed assets that belong to national assets and equity, while the right axis shows the balance sheet total, i.e.
the value of total assets.
The assets of county local governments in- creased by 21 percent in the period examined,
and these assets are significant relative to the GDP as well, as they amount to 7–8 percent of it. The asset growth is a positive process in itself, but its causes need to be explored to understand its content. What caused this
growth was that the value of liquid assets in- creased continuously and quadrupled between 2015 and 2017. on the other hand, it was an atypical feature of the 2006–2010 indebt- edness process that as debts increased, so did
Table 3
deBt consolidation in speciFic settlements
town
total consolidation of settlements with a
population over 5 thousand in 2013 (assumed and
paid)
total consolidation in
2014 (assumed and paid)
amount of consolidated debt
per capita consolidated amount (thousand
huF/person)
békéscsaba 6,002,031 3,920,774 9,922,804 160.0
debrecen 18,072,173 10,103,459 28,175,633 137.5
dunaújváros 10,843,491 5,695,756 16,539,247 339.7
Eger 4,831,453 3,401,550 8,233,003 151.1
Érd 8,093,088 3,364,343 11,457,430 175.0
Győr 3,392,210 4,455,919 7,848,129 62.1
Hódmezővásárhely 15,650,835 6,891,340 22,542,175 485.9
Kaposvár 13,987,452 5,706,299 19,693,751 297.9
Kecskemét 9,152,404 7,631,905 16,784,309 149.6
Miskolc 25,661,751 10,495,978 36,157,730 217.5
nagykanizsa 4,127,728 2,210,802 6,338,530 128.2
nyíregyháza 12,123,347 6,707,927 18,831,275 158.0
Pécs 29,227,423 16,519,422 45,746,846 300.1
salgótarján 2,090,110 1,167,397 3,257,507 84.8
sopron 11,455,657 4,103,752 15,559,409 265.5
szeged 14,075,427 11,024,642 25,100,069 151.4
székesfehérvár 9,452,942 4,752,523 14,205,465 141.9
szekszárd 3,529,058 2,414,675 5,943,733 173.8
szolnok 13,702,624 7,071,966 20,774,590 283.2
szombathely 10,638,947 4,477,818 15,116,765 193.3
Tatabánya 5,375,663 8,996,451 14,372,113 203.6
veszprém 4,987,253 2,487,933 7,475,186 129.2
Zalaegerszeg 1,448,931 1,243,940 2,692,871 45.6
Source: Edited by the authors based on data provision by the state Treasury, 2019
the value of liquid assets, which was to ensure liquidity, and funds deriving from bond issues were not immediately used, and the revenues from the normal operation of local govern- ments were 'parked' in the settlement deposit account. However, no liquidity problems are detected because of the available free cash, of which local governments had Huf 340 bil- lion, with additional liquid securities of Huf 52 billion.
However, the change in the aggregate value of equity is significantly smaller compared to asset growth, as it increased by 4 percent when calculated with a fixed-base index. The direc- tion of the change was not steady, as in 2016 equity value decreased slightly (by Huf 2 bil- lion). This negative trend did not continue in 2017, the annual result of towns with county
rights was positive, and this year also saw the highest value of the time-series.
In public accounting, assets that ensure long-term operation are called fixed assets be- longing to national assets. A major part of the asset item is real property, the amortisation of which is slow. The analysis revealed that the total assets of towns with county rights increased by Huf 200 billion, by 9 percent when calculated as a fixed-base index. There was continuous growth, but the most sig- nificant change happened between 2014 and 2015, which might be related to the phasing out of Eu resources at the end of the pro- gramming period (2007–2013). However, there was no investment boom similar to the indebtedness boom between 2006 and 2010, which means that the debt brake had an ef-
Figure 4
Key indicators (Fixed assets, assets, equity) in the consolidated Balance sheets oF towns with county rights
Source: Edited by the authors based on state Treasury data TOTAL ASSETS
Fixed assets belonging to national assets Equity
Billion HUF Billion HUF
2,550 2,500 2,450 2,400 2,350 2,300 2,250 2,200
3,000 2,500 2,000 1,500 1,000 500 0
fect on the investments of local governments.
However, it is important to know if the in- crease in fixed assets exceeds the value of rec- ognised depreciation, since, in this case, local authorities suffer a net loss in assets. Based on 2016 and 2017 data, it can be established that the increase in fixed assets exceeded deprecia- tion, which means that assets were preserved and increased, as the net investment rate was positive in these years.
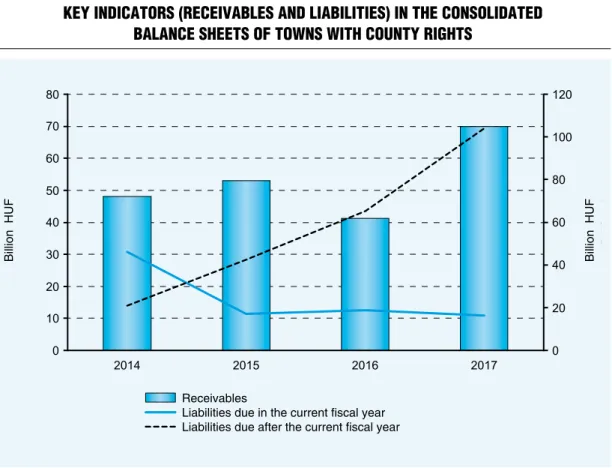
Figure 5 shows receivables and liabilities according to the effective public accounting rules. The value of receivables (right scale) fluctuated, and it reached its lowest point in 2016. In 2017, the major part of debt con- cerned local tax, mostly local business tax. As for liabilities (left scale), liabilities due in the current fiscal year decreased by 66 percent,
but liabilities due after the current fiscal year increased almost tenfold. In 2017, 23 percent of debt concerned accumulation expenditure, 30 percent financing expenditure, and 32 per- cent non-personnel expenses. Even though receivables did not fully cover liabilities, the securities and liquid assets described earlier were enough in themselves to cover liabilities.
As a result, there are no significant liquidity problems in the sector.
The accounting system in effect since 2014 brought about the transition to accrual ac- counting. The key revenue category is the accrual-based accounting of activities, which include taxes, contributions, fees and fines, other revenues and revenues from the sale of assets (right scale). from these, revenues from taxes, contributions, fees and fines are
Figure 5
Key indicators (receivaBles and liaBilities) in the consolidated Balance sheets oF towns with county rights
Source: Edited by the authors based on state Treasury data Receivables
Liabilities due in the current fiscal year Liabilities due after the current fiscal year
Billion HUF Billion HUF
the most important. Revenues had been de- creasing until 2016, with a decline of approx.
Huf 20 billion. The turning point was 2017, when revenues almost reached the 2015 re- sults. This can be attributed to the improving economic activity, and to increasing revenues from local business tax. The increase in other accrual-based revenues from shares and trans- fers without consideration compensated the loss in own revenues, while support from the central budget remained steady over the years.
The left scale of Figure 6 shows key budget support from the central budget, which de- creased in 2015 and 2016, but started to in- crease again in 2017. This is a positive devel- opment in light of the fact that towns with county rights are required, because of their high tax capacity, to pay solidarity contribu-
tion, and because of the set-off system of task financing, they receive less support.
It is a negative process, however, that accru- al-based revenues from activities decreased by nearly Huf 23 billion. This poses a problem, as the operation of local governments is based on steady revenues and revenue autonomy.
Results of activities correspond to the op- erational result of corporate accounting. In 2016, requirements regarding the content of the income statement changed, which had an effect on public accounting as well (see Figure 7). The only result category that remained un- changed was the result of activities, so this was compared in every year examined.
Results from activities decreased until 2016 in the period examined, so much so that the result of towns with county rights were nega-
Figure 6
net accrual-Based revenues From activities Between 2014 and 2016
Source: Edited by the authors based on state Treasury data
Net accrual-based revenue from activities Accrual-based revenue from central operating aid
Accrual-based revenue from taxes, contributions, fees and fines
Billion HUF Billion HUF
tive in 2016, with 10 of them making losses.
The aggregated negative value was approx.
Huf 6 billion. However, the trend changed in 2017, management in the sector was profit- able, and the surplus covered the losses from the previous year.
The equity ratio is considered favourable if it is over 75 percent, as in this case financing is ensured (see Table 4). After the debt consoli- dation, the equity ratio of towns with county rights significantly improved on a sectoral lev- el, as it exceeded the desired value every year examined. However, it can be considered as a negative trend that the ratio decreased, but this, unlike the period before the debt consoli- dation, is not due to increasing debts.
To substantiate this, it is worth taking a look at the ratio of outside capital in the structure of liabilities. The value is below 3
percent, which is far from the critical 50 per- cent, which means indebtedness is not typi- cal among towns with county rights. The debt service maximum provided for in the stability Act was only available for 2017, when it was 9.67 percent, which is below 50 percent, so this calculation also supports previous find- ings. It can also be established that in the debt service index of the whole local government sector, the ratio of towns with county rights is small.
The fixed assets ratio shows asset intensity.
The ratio is high but has been decreasing, which is due to the fact that the ratio of liquid assets and securities have increased, decreasing this one.
The long-term liabilities/long-term assets ratio reveals the strategy of financing. Here some correction is required as compared to
Figure 7
results oF activities Between 2014 and 2016
Source: Edited by the authors based on state Treasury data, 2019
Billion HUF
regular accounting categories, as certain ele- ments are considered long-term assets (in liquid assets, receivables, and liabilities). The financing strategy is stable if this value varies around 1, and the tolerance margin in 3 per- cent. Towns with county rights complied with this every year, which means their financing is stable, long-term assets are covered by long- term liabilities.
The liquidity ratio expresses the ability to repay short-term debt, and it is considered fa- vourable if its value exceeds 2. In budgetary management there is no point in calculating quick ratio, as the inventory value is very low, so the liquidity ratio provides similar informa- tion. The aggregate value of the liquidity ratio of towns with county rights is well above the required liquidity level every year – based on this, there are no problems with short-term li- quidity. This is also substantiated by the value of the cash liquidity ratio, which exceeded 1 considerably every year examined.
It is important from the aspect of the struc- ture of revenues that own revenues should be over 50 percent, as this is one of the corner- stones of stable operation. In the years exam-
ined, it was only in 2017 that it was lower, in the other years examined it converged to the desired 50 percent.
It is a negative trend that the equity growth rate is continuously decreasing, but the growth rate in 2017 covered the loss in 2016. The capital position of towns with county rights is stable and the financing position is also suf- ficient. The liquidity of local authorities is also adequate. The only problems in 2016 were with revenue-generating ability and profitabil- ity, but in 2017 an improving trend started.
Features of the Modern Cities Programme After the debt consolidation, the management of local governments with county rights was no longer characterised by dealing with ad hoc problems, but by growth using predictable development sources from the central budget.
The Modern cities Programme (hereinafter:
McP) was launched in 2015, and it allocated approx. Huf 3,400 billion from budget resources and Eu aid. The programme is complex, as it includes the development of
Table 4
Key accounting indices
incides 2014 2015 2016 2017
Equity ratio (%) 94.60 92.70 86.00 80.68
liability ratio (%) 2.20 1.90 2.30 2.97
fixed assets ratio (%) 93.20 93.40 87.30 83.41
long term liabilities / long term assets ratio (%)
101.50 99.20 98.50 101.44
liquidity index 5.20 14.70 27.30 23.41
Cash liquidity 2.80 7.30 20.80 7.21
ratio of own revenues (%) 45.50 45.80 38.90 44
Equity growth rate (%) 5.20 1.20 –0.30 0.36
Source: Edited by the authors based on Zéman, Tóth (2015)
transport infrastructure, the establishment of industrial parks and health care developments.
As for sources of financing, we can see a multi- channel structure, as sources are provided from the central budget, the Regional Development operational Programme and the Integrated Transport Development operational Prog- ramme.
for the empirical study, we relied on the allocations in the Budget Act between 2016 and 2019, where allocations for the Modern cities Programme can be found, since 2017, in Heading XI Prime Minister’s office, title 30 Heading-managed appropriations, chapter 1 Targeted appropriations, budget article 78 Modern cities Programme. from the finan- cial envelopes it can be established that the al- location was the highest in 2017 and in 2018, when support amounted to approx. Huf 150
billion, while the appropriation in the 2019 Budget Act was Huf 135 billion at the time of writing.
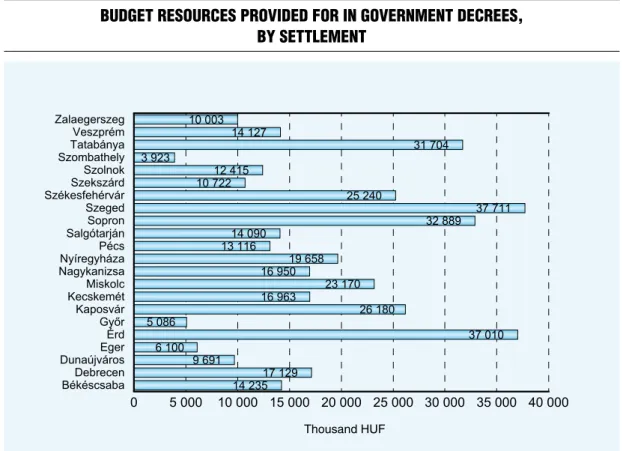
Figure 8 shows the amounts of budget support granted to local governments in the McP between 2016 and 2020. By the end of 2018 the cities that were granted the larg- est amounts in government decrees were Érd, Tatabánya, Kaposvár, sopron and szeged. The average amount of support granted to the towns examined was Huf 18 billion until November 2017.
sopron, székesfehérvár, Nyíregyháza and Miskolc were granted above-average amounts, while Kecskemét, Veszprém, Békéscsaba, Nagykanizsa and Debrecen received support slightly below the average. Naturally, these are not the final numbers, as it is still an ongoing programme.
Figure 8
Budget resources provided For in government decrees, By settlement
Source: own calculation, 2018
Thousand HUF
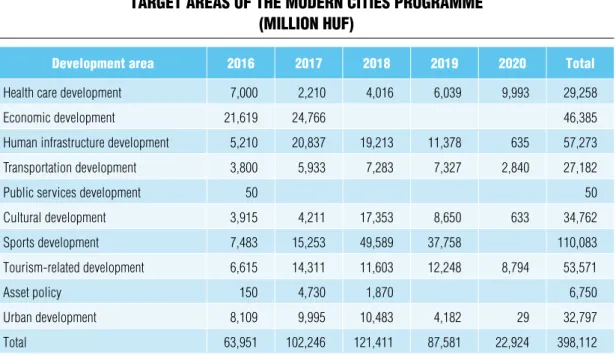
Table 5 shows the areas and the final amounts of annual support, based on govern- ment decrees. The data reveal that the largest amount of support was committed in 2018, but as developments are in progress, these amounts may change.
Development areas are connected to the task performance of local governments and the central budget. In these areas the issue of the form of operation will be dealt with in the future: voluntary task performance by lo- cal governments is an option, as it is allowed and provided for by the effective Local Gov- ernment Act. However, certain development areas, for example infrastructure investments may indirectly affect operation. Developments in tourism and the industry may directly af- fect the revenues of local governments, as they may result in additional tax revenues.
Budget support has probably played a ma- jor role since 2016 in how the value of the as- sets of towns with county rights changed and will change, as the amounts granted have been
continuously increasing. Investments carried out using this support will increase the value of fixed assets that belong to national assets by approx. Huf 121 billion in 2018, by Huf 87 billion in 2019 and by Huf 22 billion in 2020. Besides these supports, there are also sources co-financed by the Eu, but the ef- fects of those are not covered by our study.
These factors, with an average depreciation of Huf 50 billion, help keep the net asset value change in the positive range. This means the programmes contribute to the increase in the assets of local governments and to the increase in the quality of task performance.
ConClUsIon
After the debt consolidation, tasks and com–
petences changed considerably, and as a result, a major part of the local governments’ human public services became state responsibilities.
The financing system was created accordingly,
Table 5
target areas oF the modern cities programme (million huF)
development area 2016 2017 2018 2019 2020 total
Health care development 7,000 2,210 4,016 6,039 9,993 29,258
Economic development 21,619 24,766 46,385
Human infrastructure development 5,210 20,837 19,213 11,378 635 57,273
Transportation development 3,800 5,933 7,283 7,327 2,840 27,182
Public services development 50 50
Cultural development 3,915 4,211 17,353 8,650 633 34,762
sports development 7,483 15,253 49,589 37,758 110,083
Tourism-related development 6,615 14,311 11,603 12,248 8,794 53,571
Asset policy 150 4,730 1,870 6,750
Urban development 8,109 9,995 10,483 4,182 29 32,797
Total 63,951 102,246 121,411 87,581 22,924 398,112
Source: own research, 2018
and the regulatory environment changed significantly, allowing for rule-based budgetary practices. These include the introduction of the debt rule, which prevents the indebtedness of local governments by defining a debt-revenue ratio and providing for an approval procedure.
The Modern cities Programme may give a strong local boost to towns with county rights, with most of it being co-financed by the Eu- ropean union. The programme tried to take local needs into account, and when projects were created, the development goals of local governments were considered. The borrowing limit, however, may affect the implementation of the programme, as no new development may be started if debt exceeds the 50 percent of own revenues. Borrowing is automatically approved if the amount is meant to be used as own contribution or prefinancing in Eu developments. In the latter case it is bridge
financing with coverage, and it may have a slightly negative effect on the results, because of the interests paid. The debt of towns with county rights as established in this study is much lower than this limit, so when the required own contribution is secured, it cannot lead to the level of indebtedness that we saw earlier. In case of towns with county rights, the calculated borrowing limit index (the ratio of debt and equity) is currently low, below 10 percent, which means that with the current level of own revenue, it will not hinder the implementation of the programme and we do not expect financial risks.
Project management risks, on the other hand, may occur during the implementation, caused by the lack of capacity and high infla- tion in construction. In this case the elements of the programme need to be constantly mon- itored and modified, when necessary.
Note
1 csaba Lentner contributed to the study while participating in the Head Researcher Programme of the PADs foundation.
References Beck, W. A., stone, M. s. (2017). Why municipalities fail: Implications for uncertainty disclosures. Research in Accounting Regulation, 2017 (29), pp. 1–9
Burret, H., feld, L. P. (2018). Vertical effects of fiscal rules: the swiss experience. International Tax and Public Finance, 25 (3), pp. 673–721
Dafflon, B. (2010). Local Debt: from Budget Responsibility to fiscal Discipline. In IEB 6th sympo- sium on fiscal federalism, Barcelona, June 14–15
online: http://commonweb.unifr.ch/EcoDean/Pub/
telecharg/wp/417.pdf
Domokos, L. (2011). credibility and flexibility.
changes in the framework of Hungarian Public finances. Public Finance Quarterly, 56 (3), pp. 291–302
Domokos, L. (2012). operating Risks and the Increasing Indebtedness of Hungarian Local Governments. Audit experiences of the state Audit office of Hungary. Public Finance Quarterly, 57 (2), pp. 155‒163
Domokos, L., Nyéki, M., Jakovác, K., Németh, E., Hatvani, cs. (2015). Risk Analysis and Risk Ma- nagement in the Public sector and in Public Auditing.
Public Finance Quarterly, 60 (1), pp. 7–28
Domokos, L., Várpalotai, V., Jakovác, K., Né- meth, E., Makkai, M., Horváth, M. (2016). Renewal of Public Management. Public Finance Quarterly) 61 (2), pp. 178–198
Domokos, L. (2016). culmination of the Powers of the state Audit office of Hungary within the scope of New Legislation on Public funds. Public Finance Quarterly, 61 (3), pp. 291–311
Duve, T., Dreschsler, W. (2011). Insolvent local government: German approach prevention. Central European Public Administration Review, 9 (2), pp. 7–36
Dohnanyi, K. (2002). Reformstau durch födera- lismus. In: Wirtschaftsdienst, 2002 (4), pp. 187–190
foremny, D. (2014). sub-national deficits in Eu- ropean countries: The impact of fiscal rules and tax autonomy. European Journal of Political Economy, 34 (June 2014), pp. 86–110
Halmosi, P. (2005). Az önkormányzati hitelfel- vétel szabályozásának motivációja az Eu országaiban [Motivations for the Regulation of Borrowing by Local Governments in the Eu Member states]. Hitelintézeti Szemle/Financial and Economic Review 2005 (1), pp.
67–88
Heijdra, B. J., Meijdam, L. (2002). Public investment and intergenerational distribution. Jour- nal of Economic Dynamics and Control, 26 (5), pp.
707–735, doi: https://doi.org/10.1016/s0165-1889 (00)00074-9
Kovács, L., csillik, P. (2012). Adatok és ten- denciák az önkormányzati hitelezés területén [Data and Tendencies in the credit Activities of Local Governments]. Jegyző és Közigazgatás, (14) 3, pp. 21–23
Luby, M., Moldogaziev, T. (2014). Tax increment debt finance and the great recession. National Tax Jour- nal, 67 (3), pp. 675–696
Levaggi, R., Zanola, R. (2003). flypaper effect and sluggishness: Evidence from regional health expenditure in Italy. International Tax and Public Finance, 10 (5), pp. 535–547
Monacelli, D., Pazienza, M. G., Rapallini, c.
(2016). Municipality budget rules and debt: Is the Ita- lian regulation effective? Public Budgeting and Finance, 36 (3), pp. 114–140
Németh, E., Martus, B., Vargha, B. T. (2018).
Integrity Risks and controls of Public services. Public Finance Quarterly, 63 (2), pp. 155–175
Péli, L. (2017). A Modern Városok Program hatása a területi különbségekre [The Impact of the Modern Cities Programme on Regional Differences] In: futó Z. (ed.):
Magyar vidék – perspektívák, megoszlások a XXI.
században [Hungarian countryside – Perspective and Distributions in the 21st century]. sZIE Kiadó. pp.
196–202
Pulay, Gy., simon, J., szilas, I. (2017). Budget Residues constituting a Budgetary Risk Public Finance Quarterly, 62 (4) pp. 429–443
Pulay, Gy., Lucza, A. (2018). objective corruption Risks – subjective controls Public Finance Quarterly, 63 (4). pp. 490–510
sági, J. (2015). A bankszféra szerepe és érdekeltsé- ge a helyi önkormányzati kincstári rendszerek kiala- kításában és működtetésében [The Role and Interest of Banks in the Establishment and operation of the Treasury systems of Local Governments]. Prosperitas, 2 (1), pp. 98–110
sági, J., Tóth, L. (2009). Városok és önkormányza- tok: központi kormányzat és spontán szerveződések itt- hon, a nagyvilágban [Towns and Local Governments:
central Government and spontaneous organisations in Hungary and Around the World] EU Working Papers, 12 (2), pp. 118–128
Ter-Minassian, T., craig, J. (1997). Control of subnational government borrowing. In: T. Ter-Minassian (Eds.). fiscal federalism in Theory and Practice. Wa- shington: International Monetary fund. pp. 156–172
Van Rompuy, P. (2016). sub-national tax autonomy and deficits: Empirical results for 27 oEcD countries.
Regional Studies, 50 (7), pp. 1248–1259
Vicente Lama, M., cordobés Madueno, M., Torres Jiménez, M. (2017). To what extent should public corporations be consolidated? considering the effects on public deficit and debt in spanish municipalities. Transylvanian Rev. Admin, sci., 52, pp.
148–164, doi:10.24193/tras.52E.9
Zéman, Z., Tóth, A. (2015). Az önkormányzatok és közüzemi vállalatok teljesítményértékelése [Perfor- mance Review of Local Governments and Public Utility Companies] In: Lentner cs. ed: Adózási pénzügytan és államháztartási gazdálkodás: Közpénzügyek és Állam- háztartástan II. [Taxation, finance and Public finance Management, Public finances and Public finance Management II] Budapest: NKE szolgáltató Kft. pp.
829–853
Zéman, Z., Béhm, I. (2017). A pénzügyi mendzsement kontroll elemzési eszköztára [Analytical Tools of Financial Management Control]. Akadémiai Kiadó, Budapest
state Audit office of Hungary (2012). Report on the Audits on the financial situation and financial Management system of Local Governments in 2011.
Budapest