RESEARCH ARTICLE
Localization and functional consequences of a direct interaction between TRIOBP-1 and hERG proteins in the heart
David K. Jones1,*, Ashley C. Johnson2,*, Elon C. Roti Roti1,*, Fang Liu1, Rebecca Uelmen1, Rebecca A. Ayers1, Istvan Baczko3, David J. Tester4, Michael J. Ackerman4, Matthew C. Trudeau2,‡and Gail A. Robertson1,‡
ABSTRACT
Reduced levels of the cardiac human (h)ERG ion channel protein and the corresponding repolarizing currentIKrcan cause arrhythmia and sudden cardiac death, but the underlying cellular mechanisms controlling hERG surface expression are not well understood. Here, we identified TRIOBP-1, an F-actin-binding protein previously associated with actin polymerization, as a putative hERG- interacting protein in a yeast-two hybrid screen of a cardiac library.
We corroborated this interaction by performing Förster resonance energy transfer (FRET) in HEK293 cells and co-immunoprecipitation in HEK293 cells and native cardiac tissue. TRIOBP-1 overexpression reduced hERG surface expression and current density, whereas reducing TRIOBP-1 expression via shRNA knockdown resulted in increased hERG protein levels. Immunolabeling in rat cardiomyocytes showed that native TRIOBP-1 colocalized predominantly with myosin-binding protein C and secondarily with rat ERG. In human stem cell-derived cardiomyocytes, TRIOBP-1 overexpression caused intracellular co-sequestration of hERG signal, reduced nativeIKrand disrupted action potential repolarization. Ca2+
currents were also somewhat reduced and cell capacitance was increased. These findings establish that TRIOBP-1 interacts directly with hERG and can affect protein levels,IKrmagnitude and cardiac membrane excitability.
KEY WORDS: Yeast two-hybrid, TARA,IKr, iPSC-CM, FRET, Action potential, KCNH2
INTRODUCTION
The coordinated activity of different ion conductances is the foundation of signaling in excitable tissues (Hodgkin and Huxley, 1990). Nowhere is this more apparent than in the heart, where a quantitative imbalance of depolarizing and repolarizing forces can lead to arrhythmia and sudden cardiac death. Maintaining normal excitability relies not only on specific gating and selectivity properties of the ion channels involved but also on their relative densities (Anderson et al., 2014; Milstein et al.,
2012). Although tremendous advances have been made in understanding gating and selectivity, we know much less about the complex mechanisms regulating channel density at the plasma membrane.
Among the deadliest of cardiac arrhythmias are those associated with long QT syndrome (LQTS), arising from inherited mutations in as many as 15 genetic loci (for a review, see Bohnen et al., 2017).
One important target for inherited LQTS is the human ether-à-go- go-related gene 1 (hERG; also known asKCNH2), which encodes two subunits, hERG 1a and 1b, of the voltage-gated ion channels that conduct the rapid delayed rectifier K+current (IKr) (Sanguinetti et al., 1995; Trudeau et al., 1995). These channels are also the primary target of a more-prevalent, acquired form of LQTS in which drugs intended for a diverse array of therapeutic targets inhibitIKras an off-target effect (Chiamvimonvat et al., 2017; Trudeau et al., 1995). Despite advances identifying ion channel genes involved in LQTS, over half of inherited arrhythmias do not map to known disease loci (Hofman et al., 2013), suggesting that as-yet- unidentified proteins account at least in part for the remaining inherited LQTS cases.
In recent years, several cytoplasmic proteins have been identified as components of macromolecular complexes with ion channels in the heart. Among these are proteins that localize ion channels to specialized cellular structures or regulate their target levels at the surface membrane (Eichel et al., 2016; Kuo et al., 2001; Lowe et al., 2008; Rosati et al., 2001; Sato et al., 2011; Vatta et al., 2006). For example, Ca2+/calmodulin-associated serine kinase (CASK) interacts with multiple channels and receptors, linking them with the cytoskeleton, and even translocates to the nucleus where it regulates gene expression (Eichel et al., 2016). N-cadherin associates with Nav1.5 channels at intercalated discs, where the association is proposed to facilitate both conduction of the electrical signal and adhesion required for contraction of the myocardium (Leo-Macias et al., 2016).
With the goal of finding proteins that regulate hERG channel surface expression levels, we searched for cardiac proteins interacting with hERG by using a yeast two-hybrid approach.
This screen identified an F-actin-binding protein associated with actin polymerization, Trio-binding protein 1 (TRIOBP-1, a alternative transcript encoded by TRIOBP) (Bradshaw et al., 2014; Seipel et al., 2001). Here, by performing studies in heterologous systems, native tissue and cardiomyocytes derived from induced pluripotent stem cells, and applying an array of techniques including Förster resonance energy transfer (FRET), co- immunoprecipitation, whole-cell patch-clamp, and confocal and stimulated emission depletion (STED) microscopy, we show that TRIOBP-1 interacts directly with hERG and colocalizes with hERG in cardiomyocytes. TRIOBP-1 bidirectionally regulates hERG protein levels in HEK293 cells and, when overexpressed in cardiomyocytes, altersIKrmagnitude and cell excitability.
Received 12 July 2017; Accepted 12 February 2018
1Department of Neuroscience, Wisconsin Institutes for Medical Research, University of Wisconsin-Madison SMPH, 1111 Highland Ave. #5505, Madison, WI 53705, USA.2Department of Physiology, University of Maryland School of Medicine, 660 W. Redwood St., Baltimore, MD 21201, USA.3Department of Pharmacology and Pharmacotherapy, University of Szeged, Szeged 6720, Hungary.4Department of Cardiovascular Diseases, Division of Heart Rhythm Service, Mayo Clinic, Rochester, NY 55905, USA.
*These authors contributed equally to this work
‡Authors for correspondence (garobert@wisc.edu;
mtrudeau@som.umaryland.edu)
E.C.R., 0000-0002-0526-9223; R.U., 0000-0001-7888-2582; G.A.R., 0000-0003- 4694-5790
Journal of Cell Science
RESULTS
TRIOBP-1 interacts directly with hERG
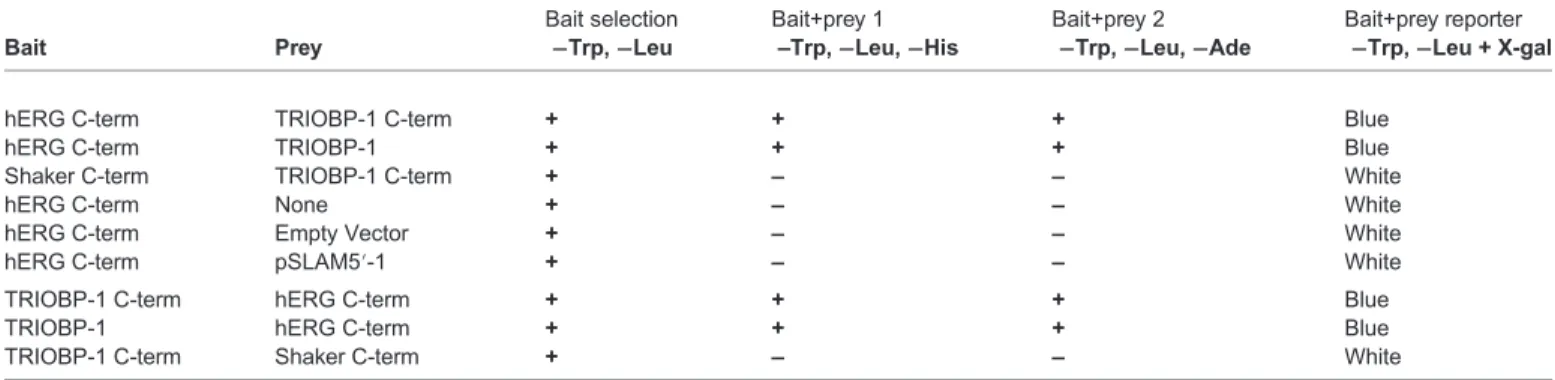
To identify hERG-interacting proteins, we conducted a yeast two- hybrid screen of 2.2×10⁶ clones in a human cardiac cDNA library using a construct encoding the hERG C-terminal region as bait (residues 669–1159, Fig. 1A). Positive interactions were scored as those exhibiting growth with histidine drop-out selection and the more stringent adenine drop-out selection (Table 1) (James et al., 1996; Roti Roti et al., 2002). Positive colonies were blue on plates containing X-gal, indicating induced expression of the β- galactosidase reporter. All markers reflect complementation of the activation and binding domains of Gal4, mediated by the interaction of the bait and prey fusion proteins, that is, hERG and the associated binding protein. Of five different genes identified, two independent clones encoded the protein TRIOBP-1, also known as Trio-associated repeat on actin (Tara) (Seipel et al., 2001) (Table 1). The two-hybrid isolates encoded TRIOBP-1 (amino acids 361–593), comprising the C-terminal end of the protein (Fig. 1A). TRIOBP-1 did not interact with the control C-terminus of Shaker B, a distantly-related DrosophilaK+channel (Fig. 1A; Table 1) (Papazian et al., 1987).
Because two-hybrid interactions occur between two proteins post- translationally targeted to the yeast nucleus where spurious
interactions between the bait and other proteins are unlikely, these data demonstrate a direct and potentially specific interaction between the hERG C-terminus and the TRIOBP-1 coiled-coil domain.
To corroborate our findings from the yeast two-hybrid experiments, we tested for association between TRIOBP-1 and isolated domains of hERG by using a FRET two-hybrid interaction assay in HEK293 cells (Gianulis et al., 2013; Wesdorp et al., 2017).
We co-expressed the C-terminal region of hERG fused to CFP or to Citrine with TRIOBP-1 fused to Citrine or to CFP, respectively, and performed fluorescence imaging and spectral analysis (Fig. 1B–D).
The C-terminal region of hERG fused to Citrine exhibited FRET with TRIOBP-1 fused to CFP (Fig. 1B,D), and the C-terminal region of hERG fused to CFP showed FRET with TRIOBP-1 fused to Citrine (Fig. 1D). We report a value proportional to FRET efficiency as RatioA−RatioA0 (Eqns 1 and 2, see Materials and Methods) where a value >0 indicates FRET and an association of the fluorophores to within∼80 Å (Fig. 1D) (Gianulis et al., 2013). In contrast, co-expression of the hERG 1a N-terminal PAS domain (amino acids 1–135) fused to CFP with TRIOBP-1 fused to Citrine did not show FRET, with a RatioA−RatioA0 value that was not significantly different from that in a negative control co-expressing the PAS domain–CFP and a calmodulin mutant that does not bind
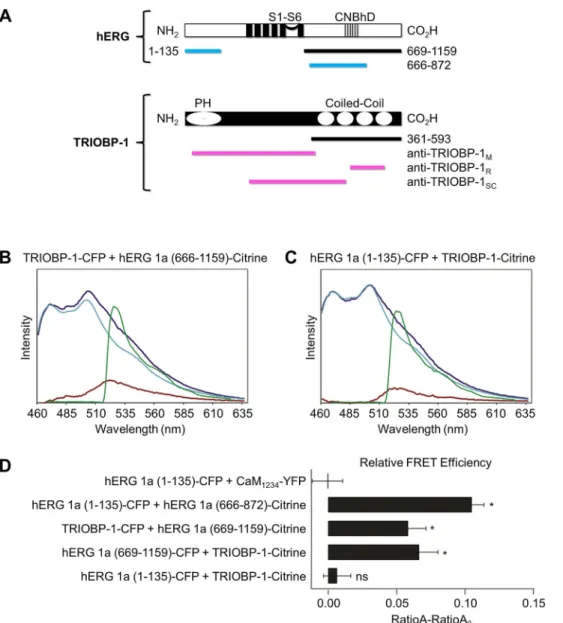
Fig. 1. hERG and TRIOBP-1 associate in a FRET two hybrid interaction assay.
(A) hERG (top) and TRIOBP-1 (bottom) structural schematics. The relative locations of the transmembrane (S1–S6) and the cyclic nucleotide-binding homology (CNBHD) domains of hERG as well as the pleckstrin homology (PH) and coiled-coil domains of TRIOBP-1 are shown. The fragments used in the yeast two-hybrid screen are depicted as black bars. Key hERG fragments used for FRET are depicted as blue bars. The regions used for generating the three anti-TRIOBP- 1 antibodies used in this study are shown as magenta bars. (B,C) Representative emission spectra from HEK293 cells expressing either (B) TRIOBP-1–CFP plus hERG (666-1159)–Citrine or (C) hERG (1– 135)–CFP plus TRIOBP-1–Citrine, which acts as a negative control. The total emission spectrum from excitation at 436 nm is shown in dark blue. The extracted spectrum (red trace) is the CFP emission (cyan trace) subtracted from the total emission spectrum (dark blue) and contains the Citrine emission with excitation at 436 nm. The green trace is the Citrine emission with 500 nm excitation.
RatioA is a ratio of the values of the red to green trace. RatioA0is the red:green ratio from the Citrine-only control. (D) Bar graph showing RatioA−RatioA0for CaM1234– YFP+hERG 1a (1-135)–CFP (the negative control), hERG 1a (1–135)–CFP plus CNBHD (666-872)–Citrine ( positive control), TRIOBP-1–CFP plus hERG 1a (666-1159)–Citrine, and hERG 1a (666- 1159)–CFP plus TRIOBP-1–Citrine. Data are mean±s.e.m. (n=7–19). *P<0.05 compared to negative control (two-tailed t-test).
Journal of Cell Science
Ca2+(CaM1234) (Fig. 1C,D). A CFP-tagged PAS co-expressed with a Citrine-tagged hERG cyclic nucleotide-binding homology domain (CNBHD) served as a positive FRET control (Fig. 1D) (Gianulis et al., 2013). Taken together with the findings from yeast-two hybrid studies, the FRET results show that the hERG C-terminal domain associates with TRIOBP-1.
TRIOBP-1 and ERG protein associate in native myocardium We used three criteria to identify TRIOBP-1 on western blots of lysate from native tissue: (1) the signal migrates according to the size predicted from the primary sequence; (2) the signal is identified by two or more antibodies generated against different epitopes; and (3) corresponding signals are present in multiple species. We used three antibodies for these studies: one monoclonal, generated against a GST-fusion protein including TRIOBP-1 residues 13–385 (anti-TRIOBP-1M) (Seipel et al., 2001), a custom rabbit polyclonal anti-peptide antibody raised against a TRIOBP-1 fragment within the coiled-coil sequence (anti-TRIOBP-1R), and a commercially available monoclonal anti-TRIOBP-1 antibody (anti-TRIOBP-1SC) (Fig. 1A) (see Materials and Methods).
We probed for TRIOBP-1 in total rat heart, canine ventricle and non-diseased human donor ventricles. In lysates from rat (n=7) and
canine (n=9) hearts, western blots probed with either TRIOBP-1Mor TRIOBP-1Rantibodies revealed a band of 65–68 kDa, corresponding to the molecular mass predicted from the cDNA (Seipel et al., 2001).
Fig. 2A shows western blots obtained from rat, canine and human heart lysates probed with the TRIOBP-1Mantibody. While additional bands were detected (Tables S1 and S2), only the 65–68 kDa band was detected by both TRIOBP-1Mand TRIOBP-1Rantibodies. In non-diseased human donor ventricular lysates, western blotting revealed a signal at 70–73 kDa (n=10) (Fig. 2A, right). Although additional bands were detected (Table S3), the 70–73 kDa band was the only band that was present in all ten hearts and corresponds to the predicted 74 kDa size of human TRIOBP-1 (Bradshaw et al., 2014;
Seipel et al., 2001). These results support the conclusion that TRIOBP-1 is expressed in canine, rat and human cardiac tissue.
We next used co-immunoprecipitation (co-IP) to determine whether hERG and TRIOBP-1 associate in HEK293 cells.
HEK293 cells stably expressing hERG 1a were transfected with TRIOBP-1 to enhance the TRIOBP-1 signal (Fig. S1). Proteins were immunoprecipitated from cell lysates using the anti-TRIOBP-1R antibody and immunoblotted for hERG (Fig. 2B,C; Fig. S1). These blots showed both mature and immature hERG 1a in protein fractions immunoprecipitated by the TRIOBP-1Rantibody (Fig. 2C).
Table 1. Summary of the yeast two-hybrid assay results
Bait Prey
Bait selection
−Trp,−Leu
Bait+prey 1 –Trp,−Leu,−His
Bait+prey 2
−Trp,−Leu,−Ade
Bait+prey reporter
−Trp,−Leu + X-gal
hERG C-term TRIOBP-1 C-term + + + Blue
hERG C-term TRIOBP-1 + + + Blue
Shaker C-term TRIOBP-1 C-term + – – White
hERG C-term None + – – White
hERG C-term Empty Vector + – – White
hERG C-term pSLAM5′-1 + – – White
TRIOBP-1 C-term hERG C-term + + + Blue
TRIOBP-1 hERG C-term + + + Blue
TRIOBP-1 C-term Shaker C-term + – – White
+, growth on plate;−, no growth.
Fig. 2. ERG and TRIOBP-1 co-immunoprecipitate.
(A) Identification of TRIOBP-1 signal (*) on western blots from freshly isolated canine (left), rat (middle) and human (right) cardiac tissue. (B) Western blot of whole-cell lysates of TRIOBP-1-transfected HEK293 cells stably expressing hERG 1a (left) and freshly isolated rat left ventricular (Rat LV) tissue (right). (C) hERG (HEK cells) and rERG (rat tissue) as in B co-immunoprecipitated with a rabbit anti- TRIOBP-1 antibody and immunoblotted with rabbit anti-hERG-KA antibody (anti-1a). Both hERG and rERG co-immunoprecipitated with TRIOBP-1 in three out of three experiments. The signals observed were not apparent in bead-only or IgG controls (right).
Journal of Cell Science
We repeated these experiments in native rat heart, where we demonstrated with co-IP the association of rat ERG and TRIOBP-1.
The membrane fraction isolated from rat ventricles revealed a 65– 68 kDa band detected by the anti-TRIOBP-1 antibody that associated with ERG that generated bands at∼130 and∼150 kDa (Fig. 2C) (Pond et al., 2000) but is not detected in bead-only or IgG controls. The co-IP of ERG with TRIOBP-1 in both HEK293 cells and in native tissues confirms the association of TRIOBP-1 and ERG protein as predicted by the two-hybrid and FRET studies.
TRIOBP-1 and ERG colocalize in cardiomyocytes
We performed immunocytochemistry in rat cardiomyocytes to define the distribution of TRIOBP-1 in relation to ERG and the sarcomeric structure of a native cell (Fig. 3). The predominant TRIOBP-1 signal colocalized with myosin binding protein C (MyBP-C; also known as MYBPC3), a thick filament-associated protein (Harris et al., 2002) (Fig. 3A,C). The secondary TRIOBP-1 signal overlapped with ERG staining between MyBP-C doublets and corresponds to the Z-line and T-tubule distribution previously described for ERG (Fig. 3B,D,E) (Jones et al., 2004). Thus, TRIOBP-1 appears to colocalize with ERG in the T-tubules along with a more prominent distribution in a separate compartment occupied by MyBP-C.
TRIOBP-1 overexpression reduces hERG protein levels in heterologous systems
To characterize the consequences of the interaction between TRIOBP-1 and hERG, we first determined whether changes in TRIOBP-1 levels altered hERG trafficking or protein levels. We measured hERG protein stably expressed in HEK293 cells by means of a western blot analysis, and monitored its maturation from the immature, endoplasmic reticulum (ER)-associated glycoform to the mature, Golgi-glycosylated form destined for the plasma membrane (Zhou et al., 1998). We measured the amount of mature and immature glycoforms normalized to total hERG protein when co- expressed with CFP (control) or TRIOBP-1–CFP. We found that the TRIOBP-1 reduced the proportion of mature hERG by a small but statistically significant margin (Fig. 4A,B). The total protein showed a larger reduction of∼20% (Fig. 4C). To more directly assess the relative levels of hERG at the plasma membrane, we used a surface biotinylation assay (see Materials and Methods). Surface protein labeled with biotin showed a more robust reduction of hERG upon TRIOBP-1 overexpression, to∼50% of control (Fig. 4D,E).
TRIOBP-1 overexpression reduces hERG current in heterologous systems
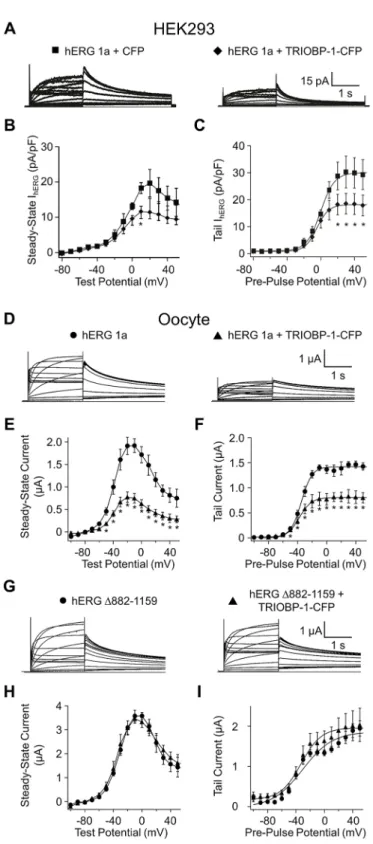
To determine whether changes in protein levels due to TRIOBP-1 overexpression corresponded to functional changes in hERG current, we measured membrane currents at room temperature using whole-cell patch-clamp of HEK293 cells stably expressing hERG 1a and transfected with cDNA encoding either CFP (control) or TRIOBP-1 with a CFP C-terminal tag (TRIOBP-1–CFP) (Fig. 5A–C). Compared to what was seen with CFP controls, TRIOBP-1–CFP-transfected cells displayed a significant decrease in hERG steady-state and maximal tail current amplitude. hERG rectification and voltage dependence of activation were unaffected (Fig. 5B,C). The reduction in membrane currents corresponds quantitatively to the reduction observed in surface membrane protein as described above (cf. Fig. 4D,E).
We conducted parallel experiments using two-electrode voltage clamp inXenopusoocytes injected with cRNA encoding hERG 1a alone or co-injected with TRIOBP-1 cRNA (Fig. 5D–I). Similar to
the findings in transfected HEK293 cells, co-expression of hERG 1a with TRIOBP-1 reduced both the steady-state and maximal tail current amplitudes by ∼50%, without a significant effect on the voltage dependence of activation (Fig. 5D–F). In contrast, currents produced by hERG 1a subunits lacking the C-terminal region distal to the CNBHD (hERG Δ882–1159) were unaffected by TRIOBP-1 coexpression, indicating that the reduction in hERG 1a current upon TRIOBP-1 overexpression requires the presence of the C-terminal region distal to the CNBHD domain. Importantly, this observation also demonstrates that suppression of wild-type hERG 1a currents is not a consequence of TRIOBP-1 competing for the translational machinery (Fig. 5G–I). Therefore, exogenous TRIOBP-1 regulates hERG current magnitude through an interaction with the hERG C-terminus comprising the TRIOBP-1- binding region.
TRIOBP-1 overexpression in human cardiomyocytes reducesIKr
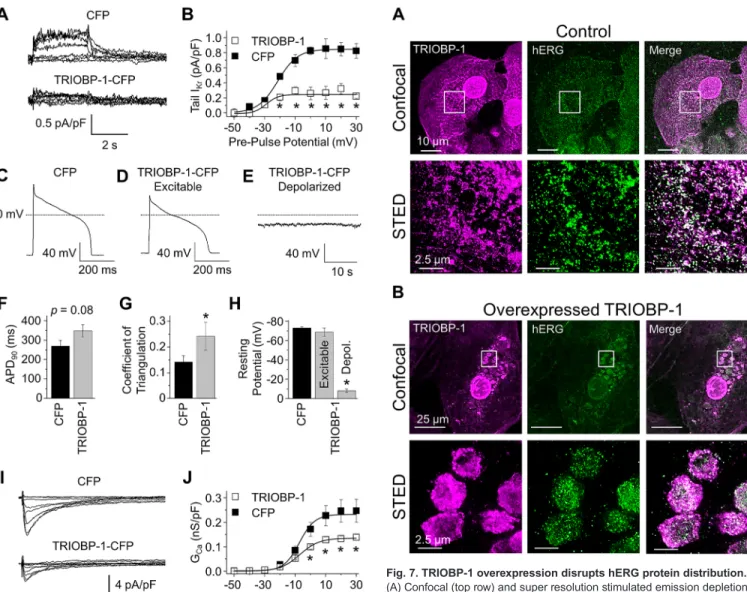
To determine whether native IKr is affected by TRIOBP-1 overexpression, we performed patch-clamp electrophysiology experiments in cardiomyocytes derived from human induced pluripotent stem cells (iPSC-CMs) (Harley et al., 2016; Jones et al., 2014, 2016; Ma et al., 2011).IKr, measured as an E-4031- sensitive current (see Materials and Methods), was markedly reduced by TRIOBP-1 overexpression (Fig. 6A,B). Only cells with a robustICa, used as an indicator of cell viability, were included for analysis. TRIOBP-1 transfection reduced the maximum IKr tail current density by∼70% relative to CFP controls (Fig. 6B; Fig. S2, Table S4). TRIOBP-1 did not affect the voltage dependence ofIKr (Fig. 6B; Table S4). The effects of TRIOBP-1 overexpression onIKr in cardiomyocytes are consistent with the effects on hERG 1a heterologously expressed in HEK293 cells.
TRIOBP-1 overexpression in human cardiomyocytes alters action potential behavior
Predicting that reducedIKrwould prolong the action potential (AP) duration (APD), we compared the APD in Kir2.1 (KCNJ2)- transduced cardiomyocytes transfected with TRIOBP-1–CFP versus CFP alone (see Materials and Methods). Unexpectedly, despite a trend toward APD prolongation, this difference was not statistically significant (Fig. 6C–F;P=0.08,n=11–14). However, we noted a significant increase in AP triangulation, a measure of phase III repolarization and marker for pro-arrhythmia (Hondeghem et al., 2001) (Fig. 6D,G; P=0.03). Furthermore, in a subset of cardiomyocytes (7 of 20 cells), exogenous TRIOBP-1 conferred depolarization block resulting from a resting membrane potential of
−8.2±1.9 mV, presumably the result of reducedIKrin the TRIOBP- 1-transfected cells (Fig. 6E,H). In contrast, all control iPSC-CMs displayed a resting membrane potential near−80 mV (Fig. 6C,H) (n=17). To confirm that the depolarized TRIOBP-1 cells were in fact cardiomyocytes, as opposed to non-excitable fibroblasts, we tested for electrical excitability by hyperpolarizing the cell prior to a depolarizing test pulse (Fig. S3). Quiescent cells were included for analysis only if they displayed an AP following manual hyperpolarization. These data indicate that exogenous TRIOBP-1 enhances AP triangulation and causes depolarization block in cardiomyocytes.
TRIOBP-1 overexpression in human cardiomyocytes also reducesICa
The failure of TRIOBP-1 overexpression to cause an increase in APD despite its effect on IKr, suggests that there is a
Journal of Cell Science
compensatory effect during the AP plateau. Indeed, we observed that TRIOBP-1 overexpression also significantly reduced ICa density by 40% (Fig. 6I,J; Fig. S2; Table S4). TRIOBP-1 did not affect the voltage dependence of ICa activation or inactivation (Table S4).
Consistent with previous reports that TRIOBP-1 overexpression increased cell size (Bradshaw et al., 2014; Seipel et al., 2001), TRIOBP-1–CFP transfection significantly increased cellular capacitance from 36.3±3.3 pF in CFP-transfected iPSC-CMs to 52.0±3.3 pF in TRIOBP-1–CFP-transfected iPSC-CMs (mean±
Fig. 3. TRIOBP-1 and ERG distribution in native rat cardiomyocytes.(A) Images showing native rat cardiomyocytes immunolabeled for TRIOBP-1 (magenta, left), MyBP-C (green, middle) and the merged signal (right). (B) Sample images showing native rat cardiomyocytes immunolabeled for TRIOBP-1 (magenta, left), rERG (green, middle) and the merged signal (right). (C) Linear fluorescence intensity profile depicting the periodic colocalization of TrioBP-1 (magenta) and MyBP-C (green) from an individual cell. (D) Linear fluorescence intensity profile depicting the periodic colocalization (arrows) of TRIOBP-1 (magenta) and ERG (green) from an individual cell. (E) 3D rendering of TRIOBP-1 staining. Orange arrows indicate secondary TRIOBP-1 fluorescence that correlates with ERG fluorescence. Scale bars: 10μm.
Journal of Cell Science
s.e.m., n=8–12, P=0.004). The magnitude of the effect of TRIOBP-1 on cell size is inversely proportional to that on ICa current density. Whether the reduction in ICa density is directly attributable to an interaction of the channel with TRIOBP-1 or an indirect effect of increasing membrane area will require further investigation.
TRIOBP-1 overexpression disrupts hERG protein distribution in human cardiomyocytes
In an attempt to understand the basis for reducedIKrlevels caused by TRIOBP-1 overexpression, we evaluated the distribution of the two proteins by performing immunocytochemistry in iPSC-CMs.
Immunostaining against TRIOBP-1 and hERG showed a strong punctate signal for both proteins when imaged through confocal and stimulated emission depletion (STED) microscopy (Fig. 7A).
Interestingly, the distribution of both TRIOBP-1 and hERG was altered following overexpression of TRIOBP-1 via transfection, as compared to what was seen with GFP vector controls. Both signals redistributed to intracellular vesicle-like structures (Fig. 7B), even as the cell size increased. These vesicular aggregates were also visible in all cells evaluated for AP and current properties, and did not appear to affect cell viability. Other studies on TRIOBP-1 also show that aggregates form upon overexpression of TRIOBP-1 without an effect on viability (Bradshaw et al., 2014, 2017). We conclude that reduction ofIKrcurrent density upon TRIOBP-1 overexpression is primarily attributable to the co-sequestration of hERG protein in internal vesicular or vacuolar structures.
To evaluate the effects of reducing TRIOBP-1 expression on hERG protein levels and hERG and IKr current magnitude, we
conducted RNAi experiments. We used two commercially available short hairpin (sh)RNA that reduced TRIOBP-1 expression by 50– 60% and observed a two-fold upregulation of hERG protein expressed in HEK293 cells, the opposite effect to what was seen with TRIOBP-1 overexpression (Fig. S4; cf. Fig. 4). Despite the upregulation of hERG protein levels, TRIOBP-1 knockdown reduced hERG currents in HEK293 cells. TRIOBP-1 knockdown did not significantly affect IKr current or AP properties in cardiomyocytes (Fig. S5).
Genetic screening
A screen using whole-exome sequencing of 28 unrelated patients with clinically robust but genetically elusive LQTS was performed in an effort to uncover potential determinants for pathology in TRIOBP-1. We identified no ultra-rare non-synonymous variants (minor allele frequency <0.005%) in TRIOBP-1 in this patient group.
DISCUSSION
Our study describes a direct ion channel interaction with the actin- binding protein TRIOBP-1 as determined through yeast and mammalian FRET two-hybrid assays. The interaction takes place between the TRIOBP-1 C-terminus and a domain within the hERG C-terminal region, which extends from the C-linker domain to the C- terminus and includes the CNBHD. We identified signals on western blots corresponding to TRIOBP-1 in multiple species, and show that TRIOBP-1 co-immunoprecipitates with ERG from native tissue lysates. In cardiomyocytes, TRIOBP-1 exhibits a periodic signal that is coincident with MyBP-C, and a secondary signal corresponding to the Z-lines where ERG has been previously localized to T-tubules (Jones et al., 2004). Overexpression of TRIOBP-1 in HEK293 cells decreased hERG protein levels and current amplitude in HEK293 cells. Current reduction was also demonstrated inXenopusoocytes, but not when the distal C-terminal region (TRIOBP-1-binding region) was deleted, supporting the conclusion that the reduction of current was attributable to the interaction of TRIOBP-1 and the hERG C-terminal region and not a competition for the protein translational machinery. In iPSC-CMs, TRIOBP-1 overexpression correspondingly reduced native IKr. Although a trend in AP prolongation was observed, the change did not reach statistical significance, possibly because of a concomitant reduction inICa. However, the coefficient of triangulation, a measure of phase III repolarization and marker for pro-arrhythmia (Hondeghem et al., 2001), was significantly increased (by about half ), and many cells exhibited depolarization block as compared to the controls that exhibited normal AP parameters and resting potential. The reduction inIKrcorresponded to a vesicular or vacuolar sequestration of hERG and TRIOBP-1 protein in the iPSC-CMs.
TRIOBP-1 is one of several isoforms encoded by alternative transcripts and splicing at theTRIOBPlocus (Shahin et al., 2006). It has been shown to directly bind actin in a periodic pattern corresponding to myosin II in HeLa cells, where its interaction stabilizes actin in the presence of depolymerization agents (Seipel et al., 2001; Shahin et al., 2006). None of the signals that we detected on western blots of heart tissue or HEK293 cells corresponds to the predicted size of any other TRIOBP isoforms, which supports previous RT-PCR and northern blot data showing that TRIOBP-1 is the only isoform expressed in human heart (Seipel et al., 2001;
Shahin et al., 2006). Although TRIOBP isoforms 4 and 5 are involved in bundling actin at the base of the stereocilia in the inner hair cell, the region associated with this mechanism is not represented in the TRIOBP-1 isoform (Kitajiri et al., 2010; Riazuddin et al., 2006;
Fig. 4. TRIOBP-1 regulates hERG protein expression in HEK293 cells.
(A) Example western blot of HEK293 cells stably expressing hERG 1a and transfected with CFP or TRIOBP-1–CFP. Protein disulfide isomerase (PDI) is shown as a loading control. (B) Quantification of the amount of mature hERG protein (155 kDa band) divided by total hERG protein (155 kDa plus 135 kDa bands). (C) Quantification of total hERG protein (155 kDa plus 135 kDa bands) divided by the loading control (PDI). (D) Representative immunoblot showing biotinylated hERG protein (top) and unbiotinylated PDI loading controls (bottom) from HEK293 cells stably expressing hERG 1a and transfected as in A. (E) Quantification showing that the amount of the biotinylated 155 kDa hERG protein band is substantially reduced upon TRIOBP-1–CFP expression as compared to CFP controls. Data are plotted as mean±s.e.m. (n=3).*P<0.05.
Journal of Cell Science
Shahin et al., 2006). Thus, the effects of TRIOBP-1 on the actin cytoskeleton likely arise from a distinct mechanism.
What is the physiological role of the interaction between TRIOBP-1 and hERG? Actin and actin-binding proteins, like TRIOBP-1, have a wide range of effects on ion channels. Ion channels such as Kv4.2, or Cavβsubunits, are stabilized by a direct interaction with actin (Petrecca et al., 2000; Stölting et al., 2015), and cortical actin can serve to restrict movement of channels to delimited regions (Sadegh et al., 2017). The small-conductance Ca2+-activated K+channel SK2 colocalizes with filamin A along the
Z-line (Rafizadeh et al., 2014). Ankyrins localize ion channels via interactions with the cytoskeleton, and can harbor mutations giving rise to LQTS (Makara et al., 2014; Mohler et al., 2003). The physiological role of the interaction between TRIOBP-1 and hERG remains to be fully elucidated, but in addition to its interaction with hERG, TRIOBP-1 stabilizes actin polymerization (Seipel et al., 2001). This independent action may explain why TRIOBP-1 knockdown in HEK293 cells caused a reduction in hERG current despite a twofold increase in hERG protein: a loss of actin filaments would interfere with the stabilizing effect of actin at the membrane.
Indeed, a dependence of ERG current levels on the cytoskeleton was previously observed in GH3/B6 cells where treatment with cytochalasin D, which inhibits actin polymerization, reduces ERG currents by 70% (Schledermann et al., 2001). We speculate that TRIOBP-1 provides a scaffold between the membrane-bound ERG channel and the actin filaments, linking excitability with membrane structure and cell motility.
The large reductions in hERG current andIKrat the membrane when TRIOBP-1 levels are elevated was not fully explained by the reduction in total protein or a trafficking delay in the ER. Instead, TRIOBP-1 overexpression in cardiomyocytes results in internal concentration of hERG in vesicular bodies reminiscent of autophagic vacuoles, which were also described in HeLa cells (Seipel et al., 2001). Whether TRIOBP-1 and hERG colocalization in iPSC-CMs is an artifact of overexpression or a clue to mechanism, the colocalization of TRIOBP-1 and hERG in these subcellular structures reinforces the conclusion that the two proteins interact in cardiomyocytes. Moreover, it is interesting to note that autophagic vacuoles are abundant in failing human heart tissue, and vacuole formation is triggered by stress in experimental systems (Saito et al., 2016). Whether they are deleterious or cardioprotective is unclear, but ifIKrchannels are sequestered during the process, the concomitant current reduction could contribute to arrhythmia risk associated with heart failure.
The aggregation observed with exogenous TRIOBP-1 expression may also have relevance to other disease processes. Antibodies raised to aggregates found postmortem in brains of patients with schizophrenia identified TRIOBP-1 as a major constituent (Bradshaw et al., 2014).
The same study demonstrated that overexpression of TRIOBP-1, but not TRIOBP-4, triggered similar protein aggregates in neuroblastoma cells, much like the intracellular compartments we observed in iPSC-CMs. Interestingly, upregulation of the hERG isoform KV11.1-3.1 has also been linked to schizophrenia via
Fig. 5. TRIOBP-1 overexpression reduces hERG current in two heterologous systems.(A) Sample current traces recorded from HEK293 cells stably expressing hERG 1a and transfected with pcDNA-CFP (left) or TRIOBP-1–CFP (right). (B) Steady-state current plotted as a function of test potential for hERG 1a plus CFP (squares) and hERG 1a plus TRIOBP-1–CFP (diamonds). (C) Maximal tail current plotted as a function of pre-pulse potential for hERG 1a plus CFP (circles) and hERG 1a plus TRIOBP-1–CFP (triangles) and fitted to a Boltzmann equation (Eqn 3). (D) Sample current traces recorded fromXenopusoocytes expressing hERG 1a–CFP alone (left) or hERG 1a plus TRIOBP-1–CFP together (right). (E) Steady-state current plotted as a function of test potential for hERG 1a (circles) and hERG 1a plus TRIOBP-1–CFP (triangles). (F) Maximal tail current plotted as a function of pre-pulse potential for hERG 1a (circles) and hERG 1a plus TRIOBP-1–CFP (triangles) and fitted to a Boltzmann equation (Eqn 3). (G) Sample current traces recorded from a C- terminal truncated hERG 1a mutant (hERGΔ882-1159, left) or hERGΔ882- 1159 plus TRIOBP-1–CFP together (right). (H) Steady-state current plotted as a function of test potential for hERGΔ882-1159 (circles) and hERGΔ882-1159 plus TRIOBP-1 (triangles). (I) Maximal tail current plotted as a function of pre- pulse potential for hERGΔ882-1159 (circles) and hERGΔ882-1159 plus TRIOBP-1 (triangles) and fitted to a Boltzmann equation (Eqn 3). Data are plotted as mean±s.e.m. (n=6–12). *P<0.05 (two-tailedt-test).
Journal of Cell Science
genome-wide association and experimental studies (Apud et al., 2012; Atalar et al., 2010; Carr et al., 2016; Huffaker et al., 2009);
it would be interesting to know whether association of hERG with TRIOBP-1 plays a role in schizophrenia pathogenesis at the cellular level.
We have established an interaction between hERG and TRIOBP- 1 that may be important in cardiac excitability. Future studies will be
required to determine whether the interaction plays a regulatory role in cardiac excitability or contributes to pathology, particularly in light of the paradoxical increase in hERG protein and decrease in hERG current levels when TRIOBP-1 levels are reduced.
Perturbation of the interaction in cardiomyocytes via introduction of peptides or small-chain variable antibodies through the recording pipette may yield such insights (Harley et al., 2016). Moreover, the physiological role of the interaction in iPSC-CMs, which are considered to be at an embryonic stage (Mummery et al., 2003), may differ from that in mature cardiomyocytes. Ultimately, the identification of human disease mutations in TRIOBP-1 through additional genomic analysis may help resolve the physiological role of its interaction with hERG and theIKrchannel in the heart.
MATERIALS AND METHODS Yeast two-hybrid screen
Binary interactions were evaluated by using a yeast two-hybrid assay as previously described (Roti Roti et al., 2002). Briefly, PJ69-4a yeast were transformed singly or dually with plasmids containing recombinant clones fused to either the Gal4 activation domain ( pACT2) or the Gal4 binding domain ( pAS2-1). Initial transformants were selected on synthetic dropout Fig. 6. TRIOBP-1 modifies cardiomyocyte electrophysiology.(A) E-4031-
sensitive traces, representingIKr, recorded from iPSC-CMs transfected with either CFP (top) or TRIOBP-1–CFP (bottom). (B) Maximal tailIKrrecorded from iPSC-CMs transfected with either CFP (closed squares) or TRIOBP-1–CFP (open squares), plotted as a function of pre-pulse potential, and fitted to a Boltzmann function (Eqn 3). (C–E) Sample AP traces from iPSC-CMs transfected with CFP (C) or TRIOBP-1–CFP (D,E). TRIOBP-1–CFP transfection triggered two AP morphologies, excitable cells with triangulated AP morphologies (D) and depolarized cells (E). (F) Summary data showing APD90recorded from iPSC-CMs transfected with CFP or TRIOBP-1–CFP.
(G) Summary data showing APD triangulation (Eqn 4) recorded from iPSC-CMs transfected with CFP or TRIOBP-1–CFP. (H) Resting potential recorded from CFP-transfected iPSC-CMs and the two morphologies of TRIOBP-1–CFP- transfected iPSC-CMs (cf. D,E). (I)ICarecorded from iPSC-CMs transfected with either CFP (top) or TRIOBP-1–CFP (bottom). (J) GCarecorded from iPSC-CMs transfected with either CFP (closed squares) or TRIOBP-1–CFP (open squares), plotted as a function of test potential, and fitted to a Boltzmann function (Eqn 3). Data are plotted as mean±s.e.m. (n=7–17); see Results section for details on sample size. *P<0.05 compared to CFP (two-tailedt-test).
Fig. 7. TRIOBP-1 overexpression disrupts hERG protein distribution.
(A) Confocal (top row) and super resolution stimulated emission depletion (STED) images (bottom row, from the same cell) showing endogenous TRIOBP-1 (magenta) and hERG (green) fluorescence in human iPSC-CMs.
(B) Confocal (top row) and STED images (bottom row, from the same cell) showing TRIOBP-1 (magenta) and hERG (green) fluorescence in iPSC-CMs following TRIOBP-1–CFP overexpression.
Journal of Cell Science
plates (SD) lacking leucine (–Leu), tryptophan (−Trp), or both, as appropriate for the transformed vector(s). Colonies were replica-plated to selection media additionally lacking adenine or histidine; growth on these plates reports a protein–protein interaction. Yeast colonies were also replica- plated to selection media containing X-Gal, where a blue colony phenotype indicates a positive protein–protein interaction. Representative colonies from each set of transformants were restreaked onto SD–Leu−Trp plates and replica plated to interaction selection plates (−Ade,−His, +X-Gal).
Cell membrane protein preparations
HEK293 cells were maintained and transfected in 60 mm tissue culture dishes (Corning Inc., Corning, NY). Cells were washed with ice-cold PBS at 48 h post transfection and resuspended in lysis buffer [150 mM NaCl, 25 mM Tris-HCl, 5 mM glucose, 20 mM NaEDTA, 10 mM NaEGTA 10 mM, 1% Triton X-100, 50μg/ml 1,10 phenanthroline, 0.7μg/ml pepstatin A, 1.56μg/ml benzamidine, and 1× Complete Minitab (Roche Applied Science)]. After sonicating twice (amplitude 20 for 10 s on ice), samples were rotated for 20 min at 4°C, centrifuged at 10,000gat 4°C, and supernatants analyzed. Protein concentration was determined with a modified Bradford assay (DC Protein Assay, Bio-Rad).
Sprague-Dawley rat ventricles were excised from anesthetized adult males after intraperitoneal injection of sodium pentobarbital (100 mg/kg body weight). All animal experiments were performed according to procedures approved by the University of Wisconsin Institutional Animal Care and Use Committee. Ventricular tissue was homogenized in tissue homogenization solution [25 mM Tris-HCl, pH 7.4, 10 mM NaEGTA, 20 mM NaEDTA, 50μg/ml 1,10 phenanthroline, 0.7μg/ml pepstatin A, 1.56μg/ml benzamidine, and 1× Complete Minitab (Roche Applied Science)]. After homogenization with a Tissue Tearor (2×10 s bursts), lysates were sonicated twice for 10 s on ice, and then centrifuged at 1000gfor 10 min at 4°C. The supernatant was decanted and the pellet resuspended in tissue homogenization solution and the homogenization, sonication and centrifugation repeated.
Supernatants were combined and centrifuged at 40,000gfor 30 min at 4°C, and pellets resuspended in RIPA buffer [150 mM NaCl, 50 mM Tris-HCl, pH 7.4, 1 mM NaEDTA, 1% Triton X-100, 1% sodium deoxycholate, 0.1%
sodium dodecyl sulfate, 50μg/ml 1,10 phenanthroline, 0.7μg/ml pepstatin A, 1.56μg/ml benzamidine, and 1× Complete Minitab (Roche Applied Science)], and incubated at 4°C with rotation for 2–3 h, and were then centrifuged at 10,000gfor 10 min at 4°C to remove any insoluble material.
The supernatants were retained for analysis. Integral membrane proteins from canine ventricular tissue (a gift from Dr Cynthia Carnes, Ohio State University, OH) were isolated as described for rat tissue.
Human cardiac tissue samples from non-diseased human hearts deemed unusable for transplantation were frozen immediately in liquid nitrogen until further processing. Before explantation of the heart, organ donors did not receive medication other than dobutamine, furosemide and plasma expanders. The investigations conformed to the principles of the Declaration of Helsinki, and samples were obtained with informed consent. The experimental protocols were approved by the Scientific and Research Ethical Committee of the Medical Scientific Board at the Hungarian Ministry of Health (ETT-TUKEB: 4991-0/2010-1018EKU).
For crude membrane preparations, ventricular tissue was broken into small pieces in liquid nitrogen and homogenized in Tris-EDTA buffer [5 mM Tris- HCl pH 7.4, 2 mM EDTA, 50μg/ml 1,10 phenanthroline, 0.7μg/ml pepstatin A, 1.56μg/ml benzamidine, and 1× Complete Minitab (Roche Applied Science)] to a final concentration of 50 mg/ml Tris-EDTA. Tissue was homogenized with a Tissue Tearor, and centrifuged at 40,000gfor 30 min at 4°C. The resulting pellet was solubilized in solubilization buffer [50 mM Tris-HCl pH 7.4, 150 mM NaCl, 1% Triton X-100, 1% sodium deoxycholate, 0.1% SDS, 50μg/ml 1,10 phenanthroline, 0.7μg/ml pepstatin A, 1.56μg/ml benzamidine, and 1× Complete Minitab (Roche Applied Science)] to a final concentration of 0.1 g tissue/1 ml solubilization buffer, and incubated for 2 h at 4°C with rotation. Solubilized proteins were then centrifuged at 4000gfor 10 min at 4°C, and the supernatant was analyzed.
Immunoprecipitation
HEK293 whole cell lysates (250μg) were precleared with 30μl protein A–Sepharose beads for 1 h at 4°C. After centrifugation (1 min at 10,000g
and 4°C) to remove beads, 0.25μg rabbit anti-hERG-KA R2 antibody (custom made) was added to the supernatant and incubated with rotation for∼16 h at 4°C. Protein A–Sepharose beads were then added and incubated for an additional 2 h. Immunoprecipitates were washed three times in 0.5 ml lysis buffer, and eluted into 30μl Laemmeli sample buffer (LSB) (25 mM Tris-HCl, pH 6.8, 2% sodium dodecysulfate, 10% glycerol, 0.2 M DL-dithiothreitol).
Integral membrane proteins isolated from rat three rat ventricles were precleared with 50μl protein G–Sepharose beads for 1 h. Beads were removed and 15μl mouse anti-hERG antibody (Axxora) was added to the supernatant and incubated for∼16 h at 4°C with rotation. After incubation with 35μl protein G–Sepharose beads for 2 h, beads were washed three times with 250μl buffer [150 mM NaCl, 50 mM Tris-HCl pH 7.4, 1 mM NaEDTA, 0.1% Triton X-100, 50μg/ml 1,10 phenanthroline, 0.7μg/ml pepstatin A, 1.56μg/ml benzamidine, and 1× Complete Minitab (Roche Applied Science)]. Samples were eluted in 30μl Laemmeli sample buffer.
Western blots
Whole-cell lysates and integral membrane protein preparations were separated by 7.5% SDS-PAGE, and transferred onto polyvinylidene difluoride membranes or nitrocellulose membranes. Membranes were blocked and then probed with a 1:5000 dilution of rabbit anti-hERG KA (ALX-215049- R100, ENZO), 1:500 dilution of rabbit anti-TRIOBP-1r(ab151320, Abcam).
Membranes were washed and then incubated with 1:10,000 dilutions of secondary Ab Alexa Fluor 647 goat anti-rabbit IgG 21245 or secondary Ab Alexa Fluor 488 donkey anti-mouse IgG 21202 (Life Technologies) for 1 h, and imaged using a Chelidon-MP Imaging System (Bio-Rad).
Biotinylation assay
At∼48 h post-transfection, cells were washed twice with ice-cold PBS and then treated with 1 mg/ml of EZ-link Sulfo-NHS-SS-biotin (Pierce) dissolved in PBS for 30 min at 4°C. The unreacted biotin was quenched following an incubation with 50 mM Tris-HCl ( pH 7.5) for 20 min at 4°C. Cells were washed three times with ice-cold PBS. Following cell lysis, biotinylated proteins were collected by incubating the cell lysates with neutravidin-coated agarose beads (Pierce) in PBS buffer containing 0.1% SDS for 2 h at 4°C.
Biotin-bound beads were then washed five times with PBS plus 0.1% SDS.
Biotinylated proteins were eluted from the beads in 2×LSB+β- mercaptoethanol (Bio-Rad) at room temperature for 30 min. Eluted proteins were resolved by 7.5% SDS-PAGE followed by western blot analysis.
TRIOBP-1 knockdown
HEK293 cells stably expressing hERG1a or iPSC-CMs were transfected with 1 µg/ml DNA encoding either a scrambled shRNA control or one of two shRNA vectors targeting TRIOBP-1 (catalog nos HSH001235-31-CU6 and HSH001235-32-CU6; GeneCopoeia). mRNA, protein levels and currents were assessed at 48 h post transfection.
FRET two-hybrid assay
The FRET two-hybrid assay was performed as described previously (Gianulis et al., 2013). HEK293 cells were plated on 35-mm poly-D-lysine- coated glass-bottom dishes (MatTek) and transiently transfected with Citrine-tagged or CFP-tagged hERG cDNA constructs and CFP or Citrine- tagged TRIOBP-1. At∼24–48 h after transfection, FRET measurements were taken using an inverted epifluorescence microscope (TE2000-U;
Eclipse; Nikon). Fluorescence emission and spectroscopic measurements were taken using a spectrograph (SpectraPro 2150i; Acton Research Corporation) and a camera (CCD97; Roper Scientific). Fluorescence imaging and analysis were performed with Metamorph software (version 6.3r7; Universal Imaging). FRET analysis was performed by measuring the fluorescent emission of the acceptor following excitation of the donor where aRatioA–RatioA0value greater than 0.0 indicates FRET, and where:
Ratio A¼F436
F500¼ F436FRET
F500
þ F436direct
F500
; ð1Þ
Ratio A0¼F436direct
F500 ; ð2Þ
Journal of Cell Science
where F436 is fluorescence at 436 nm andF500fluorescence at 500 nm.
F436directand F500 are measured in separate control experiments where hERG (666–1159)–Citrine fluorescence emission is measured alone following excitation from a 436 nm and 500 nm light, respectively.
Electrophysiology Oocytes
Oocytes isolated from femaleXenopus laevisfrogs were purchased from Ecocyte Bioscience (for University of Maryland site experiments) and Nasco (for University of Wisconsin experiments). hERG constructs were cloned into a pGH19 vector and TRIOBP-1 was cloned into pcDNA3- mycB/his (Invitrogen). cRNA was transcribedin vitrousing a mMESSAGE mMACHINE T7 kit (Invitrogen). Purified cRNA was quantified and injected using a Nanoinject II oocyte injector (Drummond). Oocytes were injected with hERG or a 1:3 molar ratio of cRNA (50 nl) encoding hERG and TRIOBP-1, respectively, and incubated at 18°C. At 48 h post injection, two-electrode voltage-clamp experiments were completed at room temperature in bath solution containing (in mM): 5 KCl, 93 NaCl, 1 MgCl2, 1.8 CaCl2 and 5 HEPES, and titrated to pH 7.4 using NaOH.
Pipettes were filled with 3 M KCl. From a holding potential of−80 mV, channels were activated by a series of test potentials from−100 to +60 mV in 10 mV increments, followed by a repolarization pulse to−60 mV. Data were recorded using Patchmaster software (HEKA) and analyzed using Igor Pro software (Wavemetrics) at the University of Maryland. Data were recorded using pClamp software (Molecular Dynamics) and analyzed with Origin at the University of Wisconsin site.
HEK293 cells
Cells stably expressing hERG (hERG-HEK293 cells) were cultured in Dulbecco’s Modified Eagle Medium (DMEM) supplemented with 10%
fetal bovine serum, 1% L-glutamine, 1% penicillin and 1% streptomycin and grown at 37°C with 5% CO2. HEK293 cells were plated on 35-mm cell culture dishes and transfected with 1 µg TRIOPBP-1 cDNA. After 24–48 h, membrane currents were measured using whole-cell patch-clamp at room temperature by using an EPC10 patch-clamp amplifier and PatchMaster v 2.0 (HEKA). The pipette solution contained (mM): 130 KCl, 1 MgCl2, 5 EGTA, 5 MgATP and 10 HEPES, titrated to pH 7.2 with KOH. The bath solution contained (mM): 137 NaCl, 4 KCl, 1.8 CaCl2, 1 MgCl2, 10 glucose, 5 tetraethylammonium and 10 HEPES, titrated to pH 7.4 with NaOH. Ion currents were measured from a holding potential of−80 mV, with a series of test potentials from −80 mV to +60 mV in 10 mV increments, followed by a repolarization pulse to−50 mV. All recorded data was analyzed using the IgorPro Software (version 5.03; WaveMetrics).
hiPSC-CMs
Human iPSC-CMs (iCell® Cardiomyocytes, Cellular Dynamics International) were plated and stored in 12-well dishes as per the manufacturer’s instructions. iPSC-CMs were transfected with 1.5 µg/ml TRIOBP-1–CFP or CFP via 1.25 µl/ml Lipofectamine 2000. For AP recordings, iPSC-CMs were transformed with 1 µl/ml of adenoviral lysate.
Adenoviral DNA encoded Kir2.1 in frame with GFP, as described previously (Jones et al., 2014; Vaidyanathan et al., 2016).
iPSC-CM recordings were conducted at 5–30 days post plating. All iPSC- CM recordings were completed 48–96 h post transfection at 36±1°C using whole-cell patch-clamp as described previously (Jones et al., 2016). We only recorded from cells that displayed GFP fluorescence, which corresponds to successful Kir2.1 transduction. All recordings were made using an Axon 200A amplifier and Clampex (Molecular Devices). Data were sampled at 10 kHz and low-pass filtered at 1 kHz. Cells were perfused with extracellular solution containing (in mM): 150 NaCl, 5.4 KCl, 1.8 CaCl2, 1 MgCl2, 15 glucose, 10 HEPES, 1 Na-pyruvate, and titrated to pH 7.4 using NaOH. Recording pipettes had resistances of 2-4.5 MΩwhen backfilled with intracellular solution containing (in mM): 5 NaCl, 150 KCl, 2 CaCl2, 5 EGTA, 10 HEPES, 5 MgATP, and titrated to pH 7.2 using KOH.
Intracellular solution aliquots were kept frozen until the day of recording.
During recording, the intracellular solution was kept on ice and discarded 2–3 h after thawing.
IKr and ICa were measured using the same protocol and recorded simultaneously in the same cell. Voltage protocols were completed before and after bath perfusion of 2 µM E-4031, an IKr-specific blocker. The difference in current was taken to representIKr(Ma et al., 2011; Sanguinetti and Jurkiewicz, 1990).ICawas measured following bath perfusion of the 2 µM E-4031. iPSC-CMs were stepped from a−50 mV holding potential to inactivate voltage-gated Na+currents to a 3-s pre-pulse between−50 and +30 mV in 10 mV increments. ICa was measured as the peak current observed in the presence of 2 µM E-4031 during the first 200 ms of the pre-pulse. Steady-stateIKrwas measured as the 5 ms mean at the end of the pre-pulse. Maximal tailIKr was measured at the beginning of a step to
−40 mV following the pre-pulse. Leak subtraction was performed off-line based on current observed at−40 mV prior toIKrorICachannel activation.
To describe the voltage dependence ofIKrandICaactivation, maximal tail IKror peakICawas normalized to cellular capacitance, plotted as a function of pre-pulse potential, and fitted to the following Boltzmann equation:
y¼ A1A2
1þeððVV0ÞdxÞ
þA2; ð3Þ where A1 and A2 represent the maximum and minimums of the fit, respectively,Vis the membrane potential,V0is the midpoint anddxis the slope. We recorded iPSC-CM APs using a whole-cell current-clamp as described previously (Harley et al., 2016). iPSC-CMs were paced at 1 Hz using a 5 ms 300–1000 pA stimulus. AP triangulation was calculated as the ratio of phase three (APD80–APD70) divided by phase two (APD40–APD30).
Subscripts indicate the percentage repolarization.
Triangulation¼APD80APD70
APD40APD30: ð4Þ
Immunocytochemistry Native cardiomyocytes
Experiments were performed as previously described (Jones et al., 2004) and in accordance with guidelines set by the University of Wisconsin Institutional Animal Care and Use Committee. Briefly, isolated rat myocytes were fixed in 2% paraformaldehyde and permeabilized with 0.5% Triton X- 100 for 10 min at room temperature. Myocytes were pre-blocked in PBS, pH 7.4, with 0.1% Tween-20, 5% bovine serum albumin (BSA) for 2 h at 4°C, then incubated in diluted primary antibody overnight at 4°C with constant rotation. Antibodies were diluted in PBS, pH 7.4, 0.1% Tween-20, 5% BSA:
mouse anti-TRIOBP-1mat 1:500 (gift from Michel Streuli), goat anti-hERG 1a N-20 at 1:10 (sc-15966, Santa Cruz Biotechnology), rabbit anti- TRIOBP-1rat 1:500 (custom made), and rabbit anti-MyBP-C at 1:500 (Harris et al., 2002). Myocytes were washed three times for 1 h in PBS, pH 7.4, with 0.1% Tween-20. Cells were then incubated in secondary antibody (Alexa Fluor 488-conjugated goat anti-rabbit-IgG and Alexa Fluor 594- conjugated goat anti-mouse-IgG) diluted in PBS, pH 7.4, 0.1% Tween-20, 5% BSA, 10% serum for 2 h at room temperature with rotation; all Alexa Fluor-conjugated (Invitrogen-Molecular Probes) were diluted 1:1000 in antibody dilutant. Samples were washed briefly three times, then twice for 1 h at 4°C in PBS with 0.1% Tween-20, pH 7.4. Myocytes were viewed on a Bio-Rad MRC 1024 laser scanning confocal microscope, or Zeiss Axiovert 200 microscope with a 63× objective using optical sectioning as described (Jones et al., 2004; Roti Roti et al., 2002).
hiPSC-CMs
Immunocytochemistry was completed as previously described (Jones et al., 2004). Cells were incubated in blocking solution containing 1:200 dilutions of primary antibodies targeting hERG (Roti Roti et al., 2002) and 1:100 TRIOBP-1SC(sc-81128, Santa Cruz Biotechnology). Cells were washed and then incubated with blocking solution containing 1:1000 dilutions of secondary antibodies [Alexa Fluor 555-conjugated goat anti-mouse IgG (H +L) A-21422 for TRIOBP-1 and Alexa Fluor®647-conjugated goat anti- rabbit IgG A-21245 (Life Technologies) for hERG]. Cells were imaged at the University of Wisconsin-Madison Optical Imaging Core using a Leica SP8 confocal microscope. Stimulated emission depletion of Alexa Fluor® 555 and Alexa Fluor®647 was completed using a 660 nm and 775 nm laser line, respectively. All cell lines are routinely screened for contamination.