ORIGINAL ARTICLE
Maternal depression is associated with DNA methylation changes in cord blood T lymphocytes and adult hippocampi
Z Nemoda1,2,9, R Massart1,2, M Suderman1,2,3, M Hallett3, T Li4, M Coote4, N Cody1, ZS Sun5, CN Soares4,6,7, G Turecki8, M Steiner4,6,7and M Szyf1,2,3
Depression affects 10–15% of pregnant women and has been associated with preterm delivery and later developmental, behavioural and learning disabilities. We tested the hypothesis that maternal depression is associated with DNA methylation alterations in maternal T lymphocytes, neonatal cord blood T lymphocytes and adult offspring hippocampi. Genome-wide DNA methylation of CD3+ T lymphocytes isolated from 38 antepartum maternal and 44 neonatal cord blood samples were analyzed using Illumina Methylation 450 K microarrays. Previously obtained methylation data sets using methylated DNA
immunoprecipitation and array-hybridization of 62 postmortem hippocampal samples of adult males were re-analyzed to test associations with history of maternal depression. We found 145 (false discovery rate (FDR)qo0.05) and 2520 (FDRqo0.1) differentially methylated CG-sites in cord blood T lymphocytes of neonates from the maternal depression group as compared with the control group. However, no significant DNA methylation differences were detected in the antepartum maternal T lymphocytes of our preliminary data set. We also detected 294 differentially methylated probes (FDRqo0.1) in hippocampal samples associated with history of maternal depression. We observed a significant overlap (P= 0.002) of 33 genes with changes in DNA methylation in T lymphocytes of neonates and brains of adult offspring. Many of these genes are involved in immune system functions. Our results show that DNA methylation changes in offspring associated with maternal depression are detectable at birth in the immune system and persist to adulthood in the brain. This is consistent with the hypothesis that system-wide epigenetic changes are involved in life-long responses to maternal depression in the offspring.
Translational Psychiatry(2015)5,e545; doi:10.1038/tp.2015.32; published online 7 April 2015
INTRODUCTION
Major depression is one of the most common psychiatric disorders with a lifetime prevalence rate of 10–20%.1 Not surprisingly, it ranks among the leading causes of disability and imposes a significant socioeconomic burden to developed countries.2 Women are particularly affected by major depression3 and 10–
15% experience at least one major depressive episode during pregnancy,4which is associated with substantial morbidity to both mother and child.5 Maternal mood disorders or stress during pregnancy can have prolonged effects on the developing fetus, resulting in attention and learning deficits during childhood and mood disorders during adulthood.6Untreated depression during pregnancy is one of the strongest predictors of subsequent postpartum depression, which has negative effects on mother–
child interaction, attachment styles and child development.7,8 There is growing evidence, from both animal and human studies, suggesting that long-lasting influences of early-life environment may be mediated by modifications of DNA methylation levels.9
One of the best documented environmental risk factors for later physical and mental health problems is prenatal stress, possibly through epigenetic programming of the hypothalamic–pituitary–
adrenal axis in the fetus.10 Increasing number of human studies point to the involvement of epigenetic regulation of the glucocorticoid receptor gene (NR3C1) in psychological stress. For example, increased methylation of theNR3C1promoter was found in brain hippocampus samples, as well as in leukocytes of adults with a history of childhood abuse or maltreatment.11,12 In addition, increased NR3C1 promoter methylation level was measured in cord blood samples in relation to maternal depression13 and to pregnancy-related anxiety.14 Interestingly, the effect of intrauterine exposure to maternal stress on theNR3C1 promoter methylation level was detectable in leukocytes of adolescents.15Prenatal exposure to maternal depression was also related to modifications of DNA methylation levels of the serotonin transporter16 or of imprinted genes17 in infants’ cord blood. As it is impossible to study DNA methylation changes in the brain of living subjects, the possibility that DNA methylation states in isolated white blood cell types are associated with behavioral exposures and neuropsychiatric phenotypes is of extreme potential clinical significance and needs to be explored.
As immune and neuroinflammatory dysfunction is associated with depression,18,19 we targeted lymphocytes in our DNA
1Department of Pharmacology and Therapeutics, McGill University, Montreal, QC, Canada;2Sackler Program for Epigenetics and Psychobiology, McGill University, Montreal, QC, Canada;3McGill Centre for Bioinformatics, McGill University, Montreal, QC, Canada;4Women’s Health Concerns Clinic, St Joseph’s Healthcare, Hamilton, ON, Canada;5Behavioral Genetics Center, Institute of Psychology, Chinese Academy of Sciences, Beijing, China;6Department of Psychiatry and Behavioural Neurosciences, McMaster University, Hamilton, ON, Canada;7Department of Obstetrics and Gynecology, McMaster University, Hamilton, ON, Canada and8McGill Group for Suicide Studies, Douglas Mental Health University Institute, Montreal, QC, Canada. Correspondence: Professor M Steiner, Departments of Psychiatry and Behavioural Neurosciences and Obstetrics and Gynecology, McMaster University, 301 James Street South, Hamilton, ON, Canada L8P 3B6 or Professor M Szyf, Department of Pharmacology and Therapeutics, McGill University Medical School, 3655 Sir William Osler Promenade #1309, Montreal, QC, Canada H3G 1Y6.
E-mail: mst@mcmaster.ca or moshe.szyf@mcgill.ca
9Current address: Institute of Medical Chemistry, Molecular Biology and Pathobiochemistry, Semmelweis University, Budapest, Hungary.
Received 18 October 2014; revised 27 December 2014; accepted 9 February 2015
www.nature.com/tp
methylation analyses. To reduce the confounding effect of the different blood cell types, we focused on T lymphocytes, which are cardinal regulators of neuroimmune mechanisms. We tested the hypothesis that long-term effects of maternal depression on the offspring are mediated by epigenetic alterations that occur in the immune system as well as in the brain. First, we tested whether maternal depression is associated with DNA methylation changes in CD3+ T lymphocytes isolated from maternal blood taken during pregnancy or neonatal cord blood taken at birth. We then analyzed DNA methylation data of hippocampal brain tissues from adults with or without a history of maternal depression.
MATERIALS AND METHODS Study participants
This study was approved by the Research Ethics Boards of St Joseph’s Healthcare Hamilton and McGill University, and written informed consent was obtained from each participant. Altogether, 127 pregnant women were recruited from outpatients attending the Women’s Health Concern Clinic and the Obstetrics Department at St Joseph’s Healthcare Hamilton, Hamilton, ON, Canada. All the participants were 18 years of age or older, able to communicate in English and planning to deliver at St Joseph’s Healthcare Hamilton. All the participants were screened for psychiatric disorders using the Mini-International Neuropsychiatric Interview.20 Participants with current or past history of psychotic disorder, alcohol and/or drug abuse or dependence were excluded. Furthermore, partici- pants taking antidepressant medication during pregnancy were not included in the present analyses. Psychiatric assessments and collection of venous blood were completed between 24 and 36 weeks of gestation.
Neonatal cord blood samples were collected from the umbilical cord during delivery.
Psychiatric assessments
Current depressive symptoms were assessed using the Edinburgh Postnatal Depression Scale and the Montgomery–Asberg Depression Rating Scale21,22For the separation of patients in remission, participants were considered currently symptomatic if they had an Edinburgh Postnatal Depression Scale score⩾13 (ref. 23) or a Montgomery–Asberg Depression Rating Scale score⩾9.24On the basis of their past history and current symptoms of depression, the nonmedicated participants were classified into three groups: The current depression group included all participants who were symptomatic during pregnancy; the past depression group included participants who have had major depressive episode(s) in the past but were not considered currently symptomatic; the control group included participants who did not have major depression or other psychiatric disorder.
Preparation of T lymphocyte DNA samples
Whole blood was collected in heparin-coated tubes, stored on ice and processed within a day of collection. The peripheral blood mononuclear cell (PBMC) layer was separated by centrifugation with Ficoll-Paque (GE Healthcare, Little Chalfont, UK) following previously published protocol,25 see details in Supplementary Information S1. CD3+ T lymphocytes were isolated from the PBMCs with Dynabeads CD3 (111.51D, Invitrogen, Carlsbad, CA, USA) using a strong magnet (Stemcell Technology, Vancouver, BC, Canada). When timing did not allow the lymphocyte isolation to be completed immediately after the PBMC separation, PBMCs were frozen in 1 ml freezing media (RPMI with 20% fetal bovine serum and 10% dimethyl sulfoxide) to be processed at a later time. DNA extraction was done using the Wizard Genomic DNA Purification kit (Promega, Fitchburg, WI, USA).
Genome-wide DNA methylation analysis
DNA samples of T lymphocytes isolated from 38 blood samples of pregnant women and from 44 venous cord blood samples were selected for equal distribution across the three groups (Table 1). The detailed methods of the methylation analyses can be found in Supplementary Information S1. Shortly, bisulfite conversion of 500 ng genomic DNA was carried out by EZ-96 DNA Methylation-Gold Kit (D5007, Zymo Research, Irvine, CA, USA), and microarray experiment using Infinium Human Methylation 450 K BeadChip Array (WG-314-1001, Illumina, San Diego,
CA, USA) was performed at Genome Quebec, Montreal, QC, Canada. For the normalization of the array signals and the calculation of M-values ( = log2(methylated signal+1)/(unmethylated signal+1)) the minfiBiocon- ductor package was used.26To control for the heterogeneity of the sample handling before lymphocyte isolation, the cell purity of each sample was estimated using quadratic programming27and a publicly available Illumina Methylation 450 K data set (GSE49618) containing methylation profiles of CD3+ T lymphocytes, CD19+ B lymphocytes, CD34+CD38−hematopoietic stem/progenitor cells and monocytes isolated from human bone marrow.28Methylation differences were identified by applying indepen- dent surrogate variable analysis as implemented by the ISVA R-package.29 To reduce the number of association tests, only probes with sufficiently high variance across the samples were tested out of the 482 421 probes measuring CG-sites on the array. These probes had an interquartile range corresponding to a 10% change in methylation across the samples.
Furthermore, since the cord blood samples were obtained from neonates of both sexes, probes for chromosomes X and Y were excluded in the cord blood sample analyses. This was donea prioribefore any further analyses were performed, so their removal did not bias downstream analyses. Thus 39 000 and 30 000 probes were chosen for the antepartum maternal and neonatal cord blood samples, respectively, to test whether there are differences in DNA methylation between patient and control groups. To adjust for multiple testing, false discovery rates (FDRs) were calculated using the Benjamini–Hochberg algorithm.30Technical variables (such as
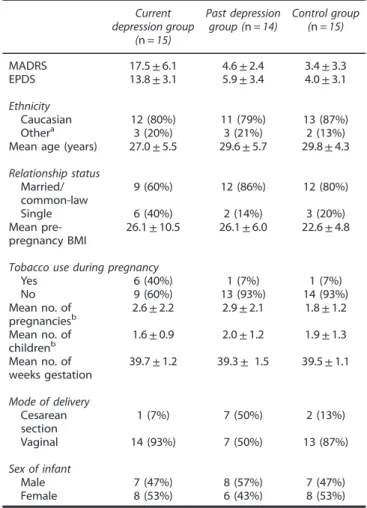
Table 1. Selected demographic information of the 44 participants chosen for the cord blood T lymphocytes’genome-wide DNA methylation analyses
Current depression group
(n= 15)
Past depression group (n= 14)
Control group (n= 15)
MADRS 17.5±6.1 4.6±2.4 3.4±3.3
EPDS 13.8±3.1 5.9±3.4 4.0±3.1
Ethnicity
Caucasian 12 (80%) 11 (79%) 13 (87%)
Othera 3 (20%) 3 (21%) 2 (13%)
Mean age (years) 27.0±5.5 29.6±5.7 29.8±4.3 Relationship status
Married/
common-law
9 (60%) 12 (86%) 12 (80%)
Single 6 (40%) 2 (14%) 3 (20%)
Mean pre- pregnancy BMI
26.1±10.5 26.1±6.0 22.6±4.8
Tobacco use during pregnancy
Yes 6 (40%) 1 (7%) 1 (7%)
No 9 (60%) 13 (93%) 14 (93%)
Mean no. of pregnanciesb
2.6±2.2 2.9±2.1 1.8±1.2 Mean no. of
childrenb
1.6±0.9 2.0±1.2 1.9±1.3 Mean no. of
weeks gestation
39.7±1.2 39.3± 1.5 39.5±1.1
Mode of delivery Cesarean section
1 (7%) 7 (50%) 2 (13%)
Vaginal 14 (93%) 7 (50%) 13 (87%)
Sex of infant
Male 7 (47%) 8 (57%) 7 (47%)
Female 8 (53%) 6 (43%) 8 (53%)
Abbreviations: BMI, body mass index; EPDS, Edinburgh Postnatal Depres- sion Scale; MADRS, Montgomery–Asberg Depression Rating Scale. Patients in the past depression group had major depressive episode in the past but were not considered currently symptomatic. aOther includes: Filipinos (total three subjects, one in each group), two Aboriginal Canadians and three women of mixed ethnicity (Caucasian-African).bNumber (no.) shown includes the current pregnancy and baby.
2
plate assignment, sample handling or cell purity) had bigger effect on methylation levels than biological or pregnancy-related variables (such as sex of newborns, gestational age, mode of delivery and maternal tobacco use during pregnancy). Therefore, only the two most prominent technical variables, plate assignment and cell purity, were included as covariates in the depression association analyses. The otherfive possibly confounding variables were tested afterwards by adding an additional variable—one at a time—to the linear model.
As the probes on the Infinium Human Methylation 450 K BeadChip Array might contain single-nucleotide polymorphisms (SNPs) and also 6% of the probes can possibly cross-hybridize to regions of the genome other than their specific target,31we screened our list of differentially methylated CG- sites. For the screening, we used 29 233 potentially cross-hybridizing probes and 53 892 probes with SNPs in the sequence of the probe or at the site of single-base extension, which had allele frequency between 5 and 95% in the European population (based on 1000 Genomes project release 20110521, as indicated by Chenet al.31).
The genes containing differentially methylated CG-sites were classified using the Ingenuity Pathway Analysis software (www.ingenuity.com).
Ingenuity Pathway Analysis identifies the most significant biological functions, pathways and upstream regulators on the basis of a large number of manually collected relationships between genes from the scientific literature. A right-tailed Fisher’s exact test was used to calculate the gene enrichment, and biological functions withPo0.05 significance level. Calculating the probability of overlaps was done by the R phyper (hypergeometric distribution)32 using ENCODE data of H3K4me1 and H3K4me3 regions in human PBMC (92 975 and 126 420 sites on the Illumina Methylation 450 K array, respectively).
Analyses of methylation data from hippocampal tissue samples Previously obtained33 DNA methylation profiles using methylated DNA immunoprecipitation followed by array-hybridization of postmortem hippocampal samples (dentate gyrus from the left hemisphere) of 62 adult males were analyzed according to presence (n= 12) or absence (n= 50) of maternal depression. Psychiatric history (DSM-IV diagnoses from SCID-I interviews), family history (assessed with Family Interview for Genetic Studies)34 and demographic information of the deceased were obtained via psychological autopsy performed by trained clinicians with informants best acquainted with the deceased among theirfirst-degree family members, as described earlier.35 This proxy-based assessment of psychological autopsy has been extensively investigated and found to produce valid information, demonstrating similar information obtained from the informant and from the subject.35–38
A custom-designed 400 K promoter tiling array (Agilent Technologies, Santa Clara, CA, USA) provided information about 23 551 gene promoters (1200 bp upstream and 400 bp downstream of the transcription start sites of genes) described in Ensembl version 55 (http://www.ensembl.org). The details of the analyses are in Supplementary Information S1. A probe and the containing promoter were called differentially methylated if theP- value of the probet-statistic was ⩽0.05, log2-fold change between the groups was⩾0.25 and the FDR waso0.1. The annotation of differentially methylated regions to genes was done using the annotatePeaks.pl program, part of the Hypergeometric Optimization of Motif EnRichment annotation program.39
Pyrosequencing
Site-specific methylation analyses ofBLK,FCER2,MGAT4AandTRIM34gene regions were performed by pyrosequencing using PyroMark Q24 or Q96 (Qiagen, Venlo, Limburg, The Netherlands). These gene regions were selected on the basis of the following criteria: two or more neighboring CG-sites were detected within 1000 bp of the gene transcription start site and their change in methylation was at least 10% in the same direction. To cover a broad range of methylation level, both lower and higher average methylation level regions were chosen. The details of PCR amplification and primer sequences are in Supplementary Information S1.
RESULTS
Genome-wide DNA methylation analyses of T lymphocytes We tested the effects of both lifetime (past history) and present symptoms of depression. Therefore, two sets of comparison were carried out in both the maternal and neonatal (cord blood)
samples: First we compared the two patient groups (the current depression group or the past depression group) separately to the control subjects. In the second set of analyses, we compared all patients independent of actual symptom severity, that is, the current depression and the past depression groups (so-called lifetime depression group) vs control group. The demographic variables did not differ significantly between the groups except for tobacco use during pregnancy (χ2(2)= 8.06;P= 0.018) and mode of delivery (χ2(2)= 8.89; P= 0.012, for frequency data see Table 1).
However, in the lifetime depression vs control group setting none of these variables differed significantly (P-values 40.1), only the depression severity scores differentiated the lifetime depression group from the control group (Montgomery–Asberg Depression Rating Scale P= 0.001, Edinburgh Postnatal Depression Scale P= 2.4e−4), even though only half of the patients had elevated depression scores at the time of the assessment.
Analysis of the antepartum maternal T lymphocyte samples showed no significant difference in DNA methylation between depression groups and controls: current depression group vs control group; past depression group vs control group; or lifetime depression group vs control group with FDR o0.1. None of the depressive symptom severity scores (obtained at the antepartum visit) showed correlation with T lymphocyte DNA methylation level.
Analysis of the neonatal cord blood T lymphocytes identified significant differences in DNA methylation between maternal depression and control groups, especially the combined maternal current and past depression groups (hereafter referred to as the maternal depression group) vs control group. Using a conservative FDR threshold of 0.05, 163 CG-sites (145 sites after removal of 14 probes with possible SNP with frequency⩾5% in Caucasians and four potentially cross-hybridizing probes) were found to be differentially methylated between the maternal depression group and the control group in neonatal T lymphocyte DNA. Among the 145 differentially methylated CG-sites, there were 64 with more than 5% difference between groups (see data in Supplementary Information S2). Using a moderate FDR threshold of 0.1, 2857 CG- sites (2520 sites after removal of potentially problematic probes) were found to be differentially methylated. Among the 2520 differentially methylated sites, 75.5% were hypomethylated in the maternal depression group compared with the control group (Supplementary Information S3).
Because of the small sample size in this preliminary study, it was not possible to adjust association model for all factors that may affect DNA methylation, including, for example, newborn sex,40 gestational age,41mode of delivery42or maternal smoking during pregnancy.43 Instead, we elected to include only two variables with the largest effects on the data, plate assignment and cell purity, in our models. To determine the robustness of the associations to the effects of possibly confounding factors (such as sex, gestational age, Cesarean section, maternal tobacco use during pregnancy and sample handling), we tested each CG-site association in a new model including each of these factors, one at a time. For each CG-site, we identified the model with the least significant difference between the maternal depression and control groups. All of the 145 differentially methylated sites at FDR o0.05 in the original model had the least significant difference (largest P-value) o0.01, unadjusted for multiple testing. Of the 2520 differentially methylated sites at FDR o0.1 in the original model, 1907 sites hadP-valueso0.05 and 518 sites had P-values o0.01. Clearly, addition of these factors reduced significance, but we found that the majority of the CG-sites remain associated with depression in the presence of potentially confounding factors (for theP-values, see data in Supplementary Information S3).
3
Validation of CG methylation levels by pyrosequencing
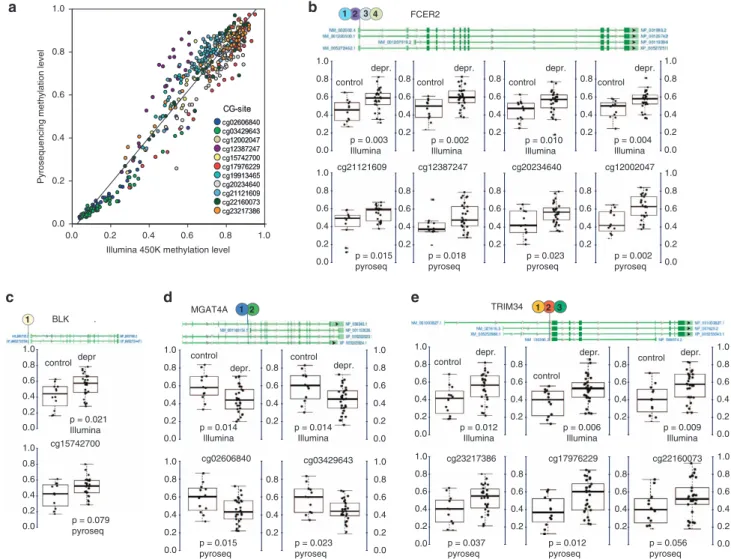
To confirm these results using Illumina Methylation 450 K microarray data, pyrosequencing of neonatal cord blood T lymphocyte DNA was performed in 54 individual samples at four gene regions (BLK,FCER2,MGAT4AandTRIM34; Figure 1a). Overall, the methylation level assessed by pyrosequencing was highly correlated with the Illumina data (R= 0.96 on average, with values for specific sites in the range of R= 0.91–0.98). Ten out of 11 selected CG-sites showed similar differences between the maternal depression and control groups (forP-values of selected sites in the four genes, see Figures 1b-e).
Enrichment analyses of differentially methylated sites in T lymphocytes that are associated with maternal depression A moderate FDR threshold of 0.1 was used to gain insight on a larger scale of the genomic distribution of the DNA methylation differences associated with maternal depression in neonatal cord blood T lymphocytes. For the results of the Ingenuity Pathway Analysis of the 2520 differentially methylated CG-sites associated with 1943 genes, see Supplementary Information S6.A.
A comparison with H3K4me1 regions of human PBMC (ENCODE data) showed a significant enrichment of these differentially methylated CG-sites in enhancers (1236 CG-sites, P= 7.6e−249, hypergeometric test) consistent with potential impact of the DNA methylation differences on regulation of gene expression.
In contrast, we observed a negative enrichment in H3K4me3 regions (279 CG-sites, P= 1.2e−79), associated with promoters of active genes. Genes associated with the differentially methyl- ated enhancers were enriched in biological functions related to immune function such as ‘quantity of leukocytes’(126 genes, P= 6.3e−22), ‘leukocyte migration’ (121 genes, P= 3.8e−21),
‘activation of leukocytes’(96 genes,P= 3.3e−17),‘differentiation of leukocyte’ (92 genes, P= 1.1e−16) and also in canonical pathways such as CD28 or iCOS-iCOSL signaling in T helper cells (19 genes, P= 5.4e−7; and 18 genes, P= 6.3e−7, respec- tively). Moreover, these genes are potential regulators of immune functions (for example, TNF—130 genes, P= 6.3e−17;
lipopolysaccharide—126 genes, P= 9.3e−14; IFNG—95 genes, P= 3.4e−10; CSF3—26 genes, P= 1.2e−9) or stress (NR3C1—63 genes, P= 2.7e−11, dexamethasone—119 genes, P= 3.5e−12).
1.0
0.8
0.6
0.4
0.2
0.0
1.0 0.8 0.6 0.4 0.2 0.0
0.8 0.6 0.4 0.2
0.8 0.6 0.4 0.2
cg12002047 p = 0.004 Illumina
p = 0.002 pyroseq 1.0
0.8 0.6 0.4 0.2 0.0
depr.
FCER2
control 2
1 3 4
1.0 0.8 0.6 0.4 0.2 0.0 1.0 0.8 0.6 0.4 0.2 0.0 0.8
0.6 0.4 0.2
0.8 0.6 0.4 0.2 1.0
0.8 0.6 0.4 0.2 0.0
control
p = 0.003 Illumina
p = 0.015 pyroseq cg21121609
p = 0.002 Illumina cg12387247
p = 0.010 Illumina cg20234640 control
0.8 0.6 0.4 0.2
0.8 0.6 0.4 0.2
control depr.
depr.
depr.
cg15742700 p = 0.021 Illumina
p = 0.079 pyroseq 1.0
0.8 0.6 0.4 0.2 0.0 1.0 0.8 0.6 0.4 0.2 0.0
control depr . BLK 1
2 1
0.8 0.6 0.4 0.2
0.8 0.6 0.4 0.2
cg03429643 1.0 0.8 0.6 0.4 0.2 0.0 1.0 0.8 0.6 0.4 0.2 0.0 control
control
cg02606840 1.0
0.8 0.6 0.4 0.2 0.0 1.0 0.8 0.6 0.4 0.2 0.0
MGAT4A
depr. depr. 0.8
0.6 0.4 0.2
0.8 0.6 0.4 0.2
cg17976229 0.8 0.6 0.4 0.2
0.8 0.6 0.4 0.2 control
cg22160073 1.0 0.8 0.6 0.4 0.2 0.0 1.0 0.8 0.6 0.4 0.2 0.0 control
control depr.
cg23217386 1.0
0.8 0.6 0.4 0.2 0.0 1.0 0.8 0.6 0.4 0.2 0.0
TRIM34
depr. depr.
2
1 3
Pyrosequencing methylation level
Illumina 450K methylation level
p = 0.018 pyroseq
p = 0.023 pyroseq
p = 0.015 pyroseq
p = 0.023 pyroseq
p = 0.037 pyroseq
p = 0.012 pyroseq
p = 0.056 pyroseq
p = 0.009 Illumina p = 0.006
Illumina p = 0.012
Illumina p = 0.014
Illumina p = 0.014
Illumina
Figure 1. Pyrosequencing validation of differentially methylated CG-sites in T lymphocyte DNA from neonatal cord blood samples. (a) Validation of Illumina Infinium 450k methylation data for the indicated CG-sites across four genes. (b–e) Selected CG-sites of four genes with significant methylation differences between maternal depression and control groups in neonatal cord blood T lymphocyte samples measured by Illumina microarray and pyrosequencing (BLK: B lymphoid tyrosine kinase;FCER2: Fc fragment of IgE, low affinity II, receptor for CD23;
MGAT4A:N-acetylglucosaminyltransferase;TRIM34: tripartite motif containing 34). Dark green boxes indicate exons, light green boxes show transcribed, non-coding regions. Alternative gene transcripts indicated by NCBI are shown in separate lines. The adjusted beta-values were computed after removing technical artifacts, like plate assignment and sample purity.
4
DNA methylation associations with maternal depression in adult hippocampus
As lifetime maternal depression was associated with methylation differences in the offspring T lymphocytes, previously obtained methylation data sets of postmortem hippocampal brain samples of adult men were analyzed according to a history of lifetime maternal depression (for description of the samples and subjects, see Table 2). Using the Hypergeometric Optimization of Motif EnRichment annotation program,39 we found 294 differentially methylated probes associated with 234 genes (Supplementary Information S4). The gene set analysis showed enrichments in immunological-related functions, such as ‘recruitment of blood cells’(16 genes,P= 1.7e−7),‘activation of microglia’(seven genes, P= 2e−5) or in potential regulators, such asTGFBR2 (12 genes, P= 1.3e−7) or BCL6 (10 genes, P= 3.6e−7; Supplementary Information S6.B).
Overlap between DNA methylation signatures in neonatal cord blood and adult brains
At last, we examined the overlap between the two sets of differentially methylated genes using the FDR qo0.1 list of T lymphocyte and hippocampus samples. As the two data sets were acquired by different methods, only a small fraction of the Illumina 450 K array’s CG-sites were near the probes of the custom made promoter array used for methylated DNA immunoprecipitation analysis (211 Illumina CG-sites were located in the sequences of the methylated DNA immunoprecipitation probes and 675 Illumina CG-sites were within 500 bases of the methylated DNA immunoprecipitation probes), limiting the exact sequence com- parisons. Nevertheless, we found 10 differentially methylated CG- sites in T lymphocytes within 500 bases of differentially methylated probes in the brain (bold numbers in Table 3). On the gene level, the 2520 CG-sites differentially methylated (FDR qo0.1) in the neonatal cord blood T lymphocytes were associated with 1943 genes according to the Hypergeometric Optimization of Motif EnRichment annotation program (Supplementary Table S3,
‘Gene.Name’column). Of these genes, a significant subset (n= 33;
P= 0.002, hypergeometric test) were also differentially methylated in postmortem hippocampal samples from adult brains (Table 3, also see Supplementary Information S5 for full list). These overlapping genes were enriched for immune functions such as
‘differentiation of leukocytes’ (seven genes, P= 1.3e−4) or had potential upstream regulators such asIL2(six genes, P= 6e−5), IFNG(eight genes,P= 1.2e−4) and dexamethasone (eight genes, P= 5.8e−4).
DISCUSSION
The impact of maternal depression on offspring well-being is well documented but the mechanisms are unclear. We examined here the hypothesis that exposure to maternal depression has an impact on DNA methylation in the offspring in T lymphocytes as well as in the brain. Our study design allowed us to compare the cross-generational impact of depression on DNA methylation level genome-wide. Although we did not observe any significant changes associated with depression in T lymphocytes from the antepartum maternal samples, our analysis revealed an associa- tion between maternal depression and DNA methylation changes in offspring CD3+ T lymphocytes at birth and in adult hippocampal samples. Likely due to the increased power in the analysis of any maternal depression compared with just past or current depression, any maternal depression was associated with many methylation changes in the cord blood samples, whereas past or current maternal depression alone were associated with few or no methylation changes.
The presence of a DNA methylation signature associated with lifetime maternal depression prompted an examination of brain samples of adult men with a history of maternal depression.
Similarly, there was no division according to the timing of maternal depression at the postmortem hippocampal samples, groups were compared on the basis of the presence or absence of lifetime depression of the mothers. Interestingly, the pathway analyses of the differentially methylated genes in the hippocam- pal samples highlighted immunological functions, and the genes overlapping between adult hippocampal and neonatal T lympho- cyte associations were enriched for (neuro)immune functions. In addition, at the upstream regulators of the overlapping genes, dexamethasone was among the top hits after interleukin 2 and interferon gamma, highlighting the potential effect of corticoster- oids. Therefore, our analyses of DNA methylation data support the idea that changes in DNA methylation can be observed in the brain of adult offspring of depressed women, and that remarkably, there is an overlap between DNA methylation alterations at birth in T lymphocytes and in the adult hippocampus. These results suggest that maternal depression may have long-lasting effects on immune functions in the periphery as well as in the central nervous system of the offspring, in line with the hypothesis that the response in DNA methylation to behavioral exposures is system-wide.9 This is consistent with previous studies that have demonstrated changes in DNA methylation in T lymphocytes and in the brain of nonhuman primates in response to early-life maternal deprivation.44As lifetime maternal depression was used in the analyses (meaning that depressive symptoms of the Table 2. Description of the brain samples, lifetime psychiatric disorder diagnoses and drug use of the subjects
Non-depressed mother (n= 50) Mother with depression (n= 12) P-value
Age (years) 39.3±12.7 39.5±9.9 0.960
Mean±s.d. (Range) (18–75) (26–51)
Reason of death
Accident 14 (28%) 2 (16.7%) 0.714a
Suicide 36 (72%) 10 (83.3%)
Brain pH
Mean±s.d. (Range) 6.51±0.33 (5.5–7.0) 6.68±0.15 (6.4–6.9) 0.009b
Postmortem interval (hours)
Mean±s.d. (Range) 33.1±14.4 (12–67) 25.8±12.9 (15–62) 0.115
Childhood abuse history 20 (40%) 5 (41.7%) 1.0a
Major depressive disorder 13 (26%) 7 (58.3%) 0.031
Bipolar disorder 4 (8%) 42 (16.7%) 0.328a
Alcohol misuse 23 (46%) 4 (33.3%) 0.427
Cannabis use 4 (8%) 1 (8.3%) 1.0a
Cocaine use 6 (12%) 0 0.586a
aFisher's exact test (one or two cells have expected counto5).bEqual variances are not assumed.
5
Table3.CommongenesofthedifferentiallymethylatedCG-sitesinneonatalcordbloodTlymphocyteandadulthippocampusDNAsamplesofoffspringofdepressedmothers GeneinformationAdulthippocampusNeonatalcordbloodTlymphocyte GenesymbolNearestRefseqChrMeDIPprobe(start–end)DistancetoTSSDifferential (log2)IlluminasitepositionDistancetoTSSDifferencein meth.level CD2NM_0017671117296508–117296567−548−0.8241173066699584−0.083 RABGAP1LNM_0010352301174670261–174670320−98744−0.9181748437542310.063 MIR1301NR_031570225552760–25552806−11930.8282552734724242−0.067 NLRC4NM_001199138232491027–32491082−243−0.97732490835−24−0.034 PLEKNM_002664268592227–68592281−68−0.88968592345,6859234924,280.054–0.059 IL1R2NM_0012614192102643837–102643888,102649031–102649090, 102649049–102649108,102670366–102670422, 102677105–102677155
61706–28439−0.892to −1.308102577876,102606829−30429,−1476−0.036,0.134 IL1R1NM_0008772102738100–102738153,102758003–102758053−32275, −12374−0.825, −1.184102731407,102758186, 102783282−38994,−12215, 12881−0.070to −0.045 NR1I2NM_0038893119466048–119466107−332531.054119499190,119500929−140,−627−0.045,−0.044 TP63NM_0011149783189347949–189348008,189347962–189348021, 189349153–189349212−1237to −33−0.895to −1.189189347820−13950.084 SMIM20NM_001145432425914791–25914848−9941.05426095438179625−0.077 SGMS2NM_0011362574108745068–108745127−623−0.947108814604185−0.061 DNAH5NM_001369513945015–13945074−456−0.97213810279134309−0.057 PCSK1NM_000439595769561–95769620−606−0.92495634103114585−0.063 CDYLNM_00114397064610477–4610529−95890−0.9064890624399−0.029 LINC00242NM_2075026170199818–170199877−927−0.838170338591−139671−0.076 BLKNM_001715811350650–11350703−844−1.09411350297,11350853, 11351846−1223,−667,3260.072–0.147 DAPK1NM_004938990114160–9011421314310.99590043268−69487−0.063 CENPPNM_001012267995087693–95087747−211.27695085154−2586−0.047 MARCH8NM_0010022651046091270–46091329−946−0.8845958759,4595877172059,72047−0.068,−0.075 C10orf11NM_0320241077887752–77887811,77887561–77887620345263, 345072−0.999, −0.97677542314,77548353−204,5835−0.052,−0.084 TRIM34NM_001003827115640442–5640501−702−1.0985653336,5653405−148,−790.141,0.165 ST5NM_005418118861480–8861535,8861450–8861507−28626, −28597−1.178, −1.089877996452259−0.051 ZBTB16NM_00101801111113900313–113900362−30093−0.922113920436,114043903−9994,112616−0.023,0.023 CXCR5NM_00171611118763651–118763705−4231.178118754530560.033 GSG1NM_0010805541213295920–13295971−393161.15913248548191−0.059 PLEKHG7NM_0010043301293130121–93130180−114−0.8369317287542611−0.058 OR4E2NM_0010019121422132962–22133021−3051.60922265369,22309073132073,175777−0.099,−0.045 AQP9NM_0209801558430312–58430371−66−1.01458430391−16−0.05 ITGAENM_002208173705235–3705287−724−1.2073674649,3704574,3704602, 3704621,3705765,3705875−1339,−1229,−85, −66,−38,29887−0.027to −0.088 SERTAD3NM_0133681940949511–409495657441.42340948296208−0.051 BFSP1NM_0011617052017539723–17539782−148−1.00417540975−1371−0.055 LOC100131496NR_0245942045947093–45947142−1280.96445947025−220−0.039 LINC00478NM_0010057322117442658–17442717−154−0.93917565450−1248−0.035 Abbreviations:MeDIP,methylatedDNAimmunoprecipitation;TSS,transcriptionstartsite.GenesinboldindicatethosewithdifferentiallymethylatedCG-sitesinTcellswithin500basesofdifferentially methylatedMeDIPprobesinhippocampi.Thenegativenumbersatthedifferentialvalues(log2-foldchange)indicatehighermethylationlevelinthecontrolscomparedwithpatients.
6
mothers could be present during the prenatal and/or postnatal periods), the underlying biological mechanisms of the DNA methylation changes in the offspring are likely due to system- wide alterations (such as altered stress reactivity, corticosteroid effect) making women more prone to develop depression.
Cord blood samples have been previously used for DNA methylation analyses in association with maternal mood disorders or depressive symptoms in candidate gene,13,14and genome-wide approaches.45,46 These studies used either whole blood or PBMCs. In our study, we used CD3+ T lymphocytes for assessing cell-mediated immunity and to reduce confounding cell-type specific differences present among leukocytes.47 Our findings are similar to the results of the previous whole epigenome analysis using Illumina Infinium 450 K technology in cord blood cells: The DNA methylation changes associated with maternal depression in neonatal cord blood samples were small: in the range of 1–9% reported by Nonet al.45and 2–10% in our study at FDR qo0.05. The majority of differentially methylated CG-sites were hypomethylated in the maternal depression group com- pared with controls in both studies. These results are also in accordance with previous candidate gene analyses where, for example, 2–6% differences were observed at imprinted gene regions17 or at the glucocorticoid receptor gene promoter region13 in association with maternal depressive symptoms.
However, the number of the differentially methylated CG-sites associated with maternal depression in T lymphocytes is much higher in our study (2520 vs 42 CG-sites at FDR qo0.1). There was no overlap in the indicated CG-sites of the two studies, but there were five genes common out of the 38 genes in the FDR-adjusted Po0.1 list reported by Non et al.45 More importantly, one gene (TNS3) had two CG-sites in the list of Non et al. and three genes (CBFA2T3,TNRC6C,TNS3) had two or three CG-sites in our FDRqo0.1 list, supporting the notion that bigger chromosomal regions are affected by DNA methylation changes.
The reason for the discrepancy in the number of affected CG-sites might reflect our use of T lymphocyte sample instead of a mixture of leukocytes.
DNA methylation is a binary signal; an allele could either be methylated or unmethylated at a particular site. Thus, the percentage change in DNA methylation indicates the fraction of cells that had experienced a complete change in methylation at a particular site. Our results indicate that the differences in methylation associated with maternal depression do not occur in all cells but in 5–10% of T lymphocytes, which might be extremely important if a particular subtype is involved. Although we tried to limit the heterogeneity of the cells, this cell population is still heterogeneous in terms of functionality (see for example, CD4+ T helper and CD8+ T killer cells).48An exciting challenge that should be addressed in future studies is identifying the particular subtype of cells that are sensitive to exposure and undergo changes in DNA methylation. As the majority of changes in response to maternal depression were decreased methylation level, it is plausible to hypothesize that certain inflammatory pathways of specific T lymphocytes get activated in the blood (see indicated pathways of cord blood T cells in Supplementary Information S6.A, such as quantity and migration of leukocytes).
The increased leukocyte migration and activation of microglia in the brain tissues (see pathways of hippocampi in Supplementary Information S6.B) could potentially affect neurogenesis in the critical window of perinatal development. However, this hypoth- esis requires further experiments in animal models as it is impossible to test in humans.
The main limitations of our study were the comparatively small sample sizes and that there were differences between groups for a couple of demographic variables that might affect DNA methyla- tion. For example, maternal tobacco use during pregnancy has been shown to affect cord blood DNA methylation level at 10 genes.43Interestingly, three of the genes associated with maternal
smoking (AHRR, GFI1, TTC7B) were present among the 1943 differentially methylated genes in the cord blood samples at FDR qo0.1 level in our study. However, the indicated CG-sites did not overlap, and none of these genes was detected among the 139 genes associated with maternal depression in the cord blood samples at FDR qo0.05 level. Cesarean section, gender and gestational age have also been reported to affect DNA methyla- tion at specific CG-sites across the genome.40–42 Therefore, we have checked the effects offive potentially confounding variables at the CG-sites identified as differentially methylated by adding each variable, one at a time, to our linear models and retesting significance. All of the 145 differentially methylated sites (FDR o0.05) and the majority of the 2520 CG-sites (FDR o0.1) remained significantly different between depressed and control groups across the models.
Another limitation of our study is that we preselected CG-sites with at least 10% methylation variance across the samples to reduce the number of association tests. In this way, we might have preselected CG-sites influenced by genetic variation. To solve this problem, we screened out probes containing common SNPs in our study population (genetic variants with at least 5% allele frequency among Caucasians as indicated by the 1000 Genome data, see Materials and methods). In this way, common genetic variants at the CG-sites (meSNPs) and within 50 bases from the CG-sites were screened out (9% of the differentially methylated sites were removed). This screen should remove two-thirds of the strongestcis-acting methylation-associated loci (cis-meQTLs).49
At the brain samples, there was only one significantly different variable between the two groups: adult offspring of depressed women were more frequently diagnosed with major depressive disorder themselves (58 vs 26%,P= 0.031; Table 2). However, there were no significant differences in childhood abuse, suicide or drug use history, which have been previously shown to affect DNA methylation patterns.33,50Another limitation in the analyses of the brain samples was that the methylation data were obtained by a technique that only measures gene promoters, thus limiting the number of overlapping CG-sites in the neonatal T lymphocyte DNA Illumina 450 K array data set that could be examined.
In conclusion, our preliminary data set of the cord blood samples allowed us to detect differentially methylated sites associated with maternal depression at birth. The supportive data of the adult brain samples show that maternal depression has an effect on epigenetic programming in the offspring, which may persist into adulthood, and detectable in the hippocampus.
Independent studies using larger number of blood samples are needed to confirm our results.
CONFLICT OF INTEREST
The authors declare no conflict of interest.
ACKNOWLEDGMENTS
This study was funded by the Canadian Institutes of Health Research (CIHR) Team Grant CCM-104889 to MSz, MSt, MH, ZS and GT. ZN was supported by Marie Curie International Outgoing Fellowship within the Seventh European Community Frame- work Programme (FP7-PEOPLE-2010-IOF N° 276107).
REFERENCES
1 Kessler RC, Bromet EJ. The epidemiology of depression across cultures.Annu Rev Public Health2013;34: 119–138.
2 Whiteford HA, Degenhardt L, Rehm J, Baxter AJ, Ferrari AJ, Erskine HEet al.Global burden of disease attributable to mental and substance use disorders:findings from the Global Burden of Disease Study 2010.Lancet2013;382: 1575–1586.
3 Van de Velde S, Bracke P, Levecque K. Gender differences in depression in 23 European countries. Cross-national variation in the gender gap in depression.Soc Sci Med2010;71: 305–313.
7