Phonocardiography and Photoplethysmography With Simple Arduino Setups to Support
Interdisciplinary STEM Education
ZOLTAN GINGL , (Member, IEEE), GERGELY MAKAN , JANOS MELLAR , GERGELY VADAI , AND ROBERT MINGESZ , (Member, IEEE)
Department of Technical Informatics, University of Szeged, 6720 Szeged, Hungary Corresponding author: Zoltan Gingl (gingl@inf.u-szeged.hu)
This work was supported by the Content Pedagogy Research Program of the Hungarian Academy of Sciences and the University of Szeged.
ABSTRACT Small computer board platforms, such as Arduino, Raspberry Pi, and micro: bit are very common, cheap, and useful tools to teach modern technology, coding, and experimenting in different disciplines at various levels. Due to the huge available information on websites, it is very easy to find a solution for almost any job and problem, therefore one may not be motivated to work out an own version, to study carefully, to understand the principles in-depth and to be creative. This is also one of the reasons why so high proportion of the examples employ technically inadequate methods, misleading concepts. These are rather serious problems concerning high-quality science, technology, engineering and mathematics (STEM) education. Although technology and available tools change rapidly, the basic principles remain the same, therefore education should focus on a better understanding of these. On the other hand, it is very important for the future’s engineers, developers, and professionals to follow the correct methods, to be reliable, creative, and open to the more and more common interdisciplinary methodology. In this paper, we demonstrate this approach by investigating exciting interdisciplinary phonocardiography and photoplethysmography experiments and related electronics, data acquisition, and signal processing. In our work, we focus on the understanding and applying the correct methods, provide a detailed analysis of common pitfalls and leave room also for additional work. Students and teachers, lecturers can learn what to consider, pick what they find useful for their projects. It is also important to note, that the principles are valid for much other instrumentation and information processing jobs as well.
INDEX TERMS STEM education, Arduino, photoplethysmography, phonocardiography, interdisciplinary education.
I. INTRODUCTION
One of the most important challenge of modern education is to adapt to the extremely rapid development of the elec- tronic, computer-driven modern devices around us. One may think that there are even more ‘‘black boxes’’ than before, it is hopeless to understand the working principles. However, modern technology can help education as well, many easy- to-use building blocks and components are available for the teachers and students.
Today real-world signals are processed by digital sys- tems. Home appliances, industrial, automotive and medical
The associate editor coordinating the review of this manuscript and approving it for publication was Derek Abbott.
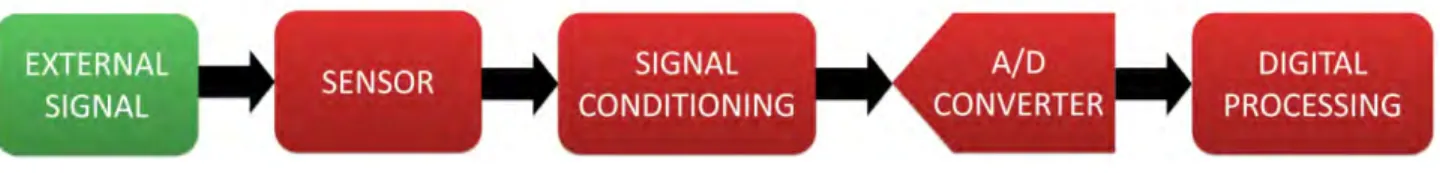
devices, smart phones, toys all use sensors, signal condi- tioning circuitry and processors running various software applications. First the external signals are converted to such signals (voltage, current, resistance, capacitance, inductance) that can be handled by electronics. The analogue-to-digital converters (ADC) require a voltage of a given range at their input, which is provided by the signal conditioning circuitry (e.g. amplifiers). Integer numbers at the output of the ADC are processed, displayed, stored by software. The block dia- gram of such systems can be seen in Fig. 1. For exam- ple, the smart phone integrates sensors like microphone to sense sound (pressure changes), CCD of the camera for light intensity detection, accelerometers and gyroscopes to sense motion, rotation and tilt, magnetometers to implement
FIGURE 1. Block diagram of a typical digital system processing real-world signals.
a compass. The signals of these sensors are converted to numbers that can be processed by various applications. Note, that even living things can be described by a similar scheme:
sound and light cause some kind of a transduction and the brain can process these to obtain related information.
Understanding and discovering this universal principle in various interdisciplinary fields can be a key to improve the efficiency of teaching and learning. One can think, that today’s high integration makes it difficult to see the details of operation and the principles are even more hidden than before. However, several components are publicly available, and one doesn’t have to be an electrical engineer to use many of these. The same is true for software applications. There are new, simple coding possibilities, development tools, support by the extremely large community. Examples include the Lego Mindstorms robots [1], Raspberry PI [2], Arduino [3], BBC micro: bit [4], Scratch by MIT [5] and many more.
These help even beginning students to build properly working real-world systems (toys, robots, etc.) rather easily. Note that many levels of education are supported from teacher demonstrations through just practicing with the ready-to-use solutions to building a complex system and even writing code to operate it.
On the other hand, there are significant drawbacks as well especially considering education. One can find a solution on the Internet for almost any problem, therefore practically no considerable efforts are needed, and consequently in-depth, real knowledge and creativity may not be developed. It is also important to note that due to the very large and hetero- geneous community there is a large proportion of virtually working but professionally inadequate solutions, misleading descriptions. Even engineering sites may present technically questionable solutions, mainly due to the lack of carefulness during employing commonly used techniques [6], [7].
Technology still changes very quickly, therefore education must focus on teaching the most universal principles of sci- ence and technology, that will be the basis of future solutions as well. This means teaching theory, but one must not forget that theory can be learnt efficiently by extensive practicing and seeing the operation if reality.
In summary we think the key points of modern educa- tion should be interdisciplinarity, transparency, profession- ally correct application, application-oriented and exciting education, and scalability for different levels of education [8].
Related STEM education is getting more important and its development should be an essential part of the strategy for the future [9].
In the following study, we demonstrate these principles on exciting interdisciplinary phonocardiography and photo- plethysmography experiments during which the students of high-schools and universities can learn how they can build a software-based system to observe their own heart function.
Note that one can find projects and descriptions about how to implement these using Arduino boards, however, method- ology for high-quality education and clear identification of the most important principles are missing. There are several problems with the related circuits, signal conditioning and processing. Even if proper components are used, the most important principles and rules of technology are often vio- lated due to the limited knowledge, lack of in-depth under- standing and carefulness. The students may not design the systems carefully enough, instead, they may hope to find the right operating conditions by thoughtless attempts. These can lead to unexpected operation and getting used to it can result undesirable attitude.
We show several different solutions and provide a novel in-depth analysis and reasoning to make the solutions as clear as possible and to draw the attention to significant problems that are overlooked in most cases.
II. MATERIALS AND METHODS
Arduino is a very popular single-board computer platform used extensively in STEM education [10]–[13]. Many differ- ent solutions can be implemented and the students have the possibility to see and work with almost all of the components of real and virtual signal processing shown in Fig. 1. The board incorporates a microcontroller that integrates a proces- sor, memory, A/D converter, digital input/output and other peripherals and makes it possible to build various systems described in Fig. 1 [3]. The easy-to-use software development environment, the various additional components and the sim- plicity and transparency make the system extremely useful to support education at various levels. In our experiments we used the most popular Arduino Uno board.
Photoplethysmography and phonocardiography can serve as starting points of exciting and inspiring experiments in education. The students can observe their own cardiac function and analyze it in various ways [14]–[20]. These experiments are particularly suitable for the universal imple- mentation and illustration of the signal processing chain using Arduino systems. Uniform handling of optical and mechanical sensors can be demonstrated and the signals are slow enough to allow real-time chart recorder-like displaying and signal processing using a microcontroller with rather
FIGURE 2. Principle of reflective photoplethysmography. The fingertip is simply placed over the LED and phototransistor pair (a). The output signal of the phototransitor circuit has a small AC component in addition to a large DC value (b).
limited resources. Learning about the sampling technique and related solutions are particularly useful in many fields of STEM education. There are some instructions on the Internet and in papers how to build such systems, example applica- tions can be found as well [21], [22]. However, many things remain hidden, there are even technical pitfalls both in hard- ware and software solutions that may be rather misleading
and do not support high quality STEM education. In the fol- lowing, first we review the basic signal chain and processing requirements of photoplethysmography and phonocardiogra- phy, then we show circuits and software required for Arduino systems. We discuss several solutions and problems related to a wide range of technology.
A. PHOTOPLETHYSMOGRAPHY
The principle of photoplethysmography is very simple: the blood volume variations e.g. in the finger caused by heart activity are monitored by light absorption or reflection [23].
A typical solution is to use and infrared LED to emit light into a finger or earlobe and to observe the transmit- ted or reflected light by a phototransistor [24]. The reflective method (see Fig. 2) is very easy to use, and it is the easiest to realize since no special holders are needed and one only needs to place the finger on the components gently.
The blood volume only varies slightly, therefore the signal has a small AC component on the top of a large DC com- ponent. The LED can be driven by a voltage source using a series current setting resistor, while the current of the pho- totransistor proportional to light intensity can flow through another resistor to produce voltage [15], [18], [20]. This
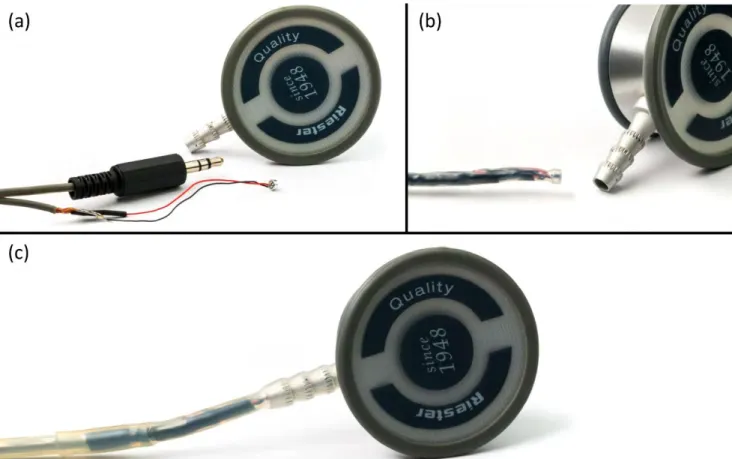
FIGURE 3. A small computer microphone can be mounted on the stethoscope using a heat shrink tube. One can see the three main parts of the setup (a).
The heat shrink tube covers the microphone and the cables as well (b). On photo (c) an outer heat shrink tube is mounted to fix the cable and the stethoscope together.
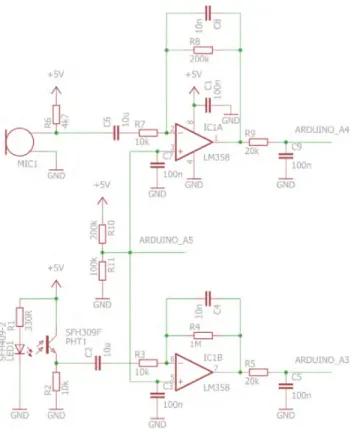
FIGURE 4. Schematic of the photoplethysmograph and microphone preamplifier circuits. The DC level can be measured at the A5 input of the Arduino board (wire labeled with ARDUINO_A5), while A3 and A4 inputs are used to monitor the photoplethysmograph (wire ARDUINO_A3) and stethoscope (wire ARDUINO_A4) signals, respectively.
FIGURE 5. A passive-only circuit can be sufficient for the stethoscope signal if the smallest available reference voltage (1.1 V) is used. The DC level is set by the forward biased diode at about 0.5 V.
voltage should be transformed to fit in the input voltage range of the ADC of the Arduino Uno board.
Note that the flashlight and camera of smartphones can also be used for finger plethysmography, many applications are available for Android and IOS to implement this. They use the reflective method as well; the user just needs to place the finger over the flashlight and camera. This technique can even be used as a medical diagnostic tool [25]. Smart watches and wristbands can also monitor heart rate using the same technique.
B. DIGITAL STETHOSCOPE
Another common solution to measure heart activity is to use the so-called digital stethoscope. It can be considered as a
mechanical amplifier to detect sound and using a microphone as a sensor the heart sounds can be digitized. Again, only small AC signals have to be measured, since sounds do not have any DC component of course. The StethIO and Stetho- cloud are two successful projects by young entrepreneurs that implement digital stethoscope for heart and lung monitoring using smart phones [26], [27]. It is quite easy to attach a small microphone prepared from a computer microphone directly to the stethoscope head with a piece of a heat shrink tube to replace the tube of the stethoscope, see Fig. 3. Digital phonocardiography can be an interesting topic for education in various disciplines and can help to understand the basics of the related analogue and digital signal processing [14], [16].
C. PHOTOPLETHYSMOGRAPH AND MICROPHONE AMPLIFIER CIRCUITS
The photoplethysmograph and microphone amplifier circuits are shown in Fig. 4. The aim is to build a signal conditioning circuit to transform the signals of the sensors to a voltage that fits in the range of the ADC of the Arduino Uno board.
The most commonly used range is from 0 V to the supply voltage, nominally 5 V. Since small AC voltages must be mapped into this range, removal of the DC component at the input of the circuit is needed, the signal must be amplified, and a level shift should be applied because negative voltages can’t be handled [15], [20], [28]. The simplest solution is to use a so-called single supply operational amplifier (such as the popular LM358 dual amplifier) in inverting configuration powered from the Arduino’s single 5 V supply [28]. The microphone and phototransistor signal conditioning circuits are practically the same [29], only some component values are different. The microphone and phototransistor need a supply voltage for operation and a series resistor on which the voltages to be amplified can be developed. The DC removal is done by the C2 and C6 capacitors. The AC voltage gain of the amplifiers is determined by R4/(R2+R3) and R8/(R6+R7). In this example the microphone amplifier’s gain is 6.8 while the photoplethysmograph signal needs much higher amplification, 50 was set in order to fit the amplified signal to the input range of the ADC. Note that it is desir- able to power the Arduino board from an external supply in any analog application, otherwise the sensitive amplifiers can pick up noise from the less clean USB power line. The feedback and output resistors and capacitors act as low pass filters; they remove unwanted higher frequency components to provide smooth enough signals (done by R8, R9, C8, C9, R4, R5, C4 and C5) and to prevent aliasing during the sampling process. The upper corner frequency of the micro- phone signal path is about 70 Hz to allow low enough sample rates to display the time dependent signals by the Arduino integrated environment. Since most of the signal spectrum falls below this frequency [30], this is enough to visualize heart beats and to perform heart beat detection. However, it is easy to increase the bandwidth for more demanding applications when higher amplitude fidelity is needed. The bandwidth for the photoplethysmograph signal is 16 Hz
that ensures correct amplitude shape and provides clean signal [31].
The DC gain of the noninverting input signals is unity, therefore the voltage divider output connected to the nonin- verting input of the amplifiers sets the DC level of the voltage signals seen by the Arduino’s ADC. In order to allow the highest dynamic range, the value of this is chosen as 5/3 V (set by R10 and R11, and filtered by C3, C7), close to the middle of the output voltage range – 0 V to approximately 3.5 V – of the LM358. Note that the full 0 V to 5 V range can only be covered by using operational amplifiers having true rail-to-rail outputs (e.g. MC33202, MCP6022, LMC6482).
Due to the high sensitivity of the stethoscope head, microphone preamplifier gains below 10 are sufficient in most cases. One can easily see that reducing the mea- surement range (i.e. the reference voltage) of the ADC increases the resolution. The internal reference voltage value is 1.1 V, so replacing the default 5 V by this one is just like implementing a gain of close to 5. Therefore, even an impressively simple passive-only circuit can be adequate for the stethoscope microphone as shown in Fig. 5. Following this, students can learn and play with different solutions and compare the advantages and disadvantages that develops important skills.
D. BUILDING THE CIRCUITS
The most popular circuit building technique in the Arduino community and education is the use of the so-called bread- boards. No soldering is required, resistors, capacitors, LEDs and other components with leads can be easily mounted and the connections can be realized by wires [32]. Although it is a very handy and quick solution, there are several draw- backs that are very rarely considered. The most important principles of hardware design techniques are often ignored that can cause unexpected and, what is even worse, uncertain behavior without knowing the reasons. Although the photo- plethysmograph and phonocardiograph signal conditioning circuits work with small signals, they can be assembled on a breadboard and can provide signals of rather good quality.
However, it is particularly important to be careful, which can be a useful challenge for the students. The design should be as compact as possible, the lowest possible number of wires and connections should be used, otherwise contact problems, noise pick-up, excess sensitivity and unreliability will be likely. These can be especially limiting in quality education where such unreliability can’t be tolerated. On the other hand, it is important to learn the correct ways of using this technique, to teach carefulness and smarter use of electronics, to try to develop some level of engineering-like approach and attitude. A possible realization of the circuit is shown in Fig. 6, the schematic if which is given in Fig. 4. Leads of the components can be tailored to be short, they are used as a part of wiring to reduce the need of additional wires and contacts. The solution provides a compact, transparent circuit and requires supplementary wires only for the supply and output signals. Each component is labeled to ease the
identification of them in the schematic of the circuit shown in Fig.4. We draw the attention to the presence of the decoupling capacitor C1 [33], which is a component must be placed between the operational amplifier’s power supply pins with shortest possible leads. This important capacitor is missing in almost all amateur circuits and can cause poor performance, unexpected behavior, randomly occurring oscillations.
The limitations of the breadboarding technique can be reduced by using pre-drilled copper-clad boards and sol- dering, if someone needs more robust, frequently used and rarely changed circuits. The next level is of course to use a printed circuit board to fulfill further needs, but this is far from being recommended for general educational projects.
Carefully planned and prepared breadboard circuits can be sufficient in several, but not in all cases.
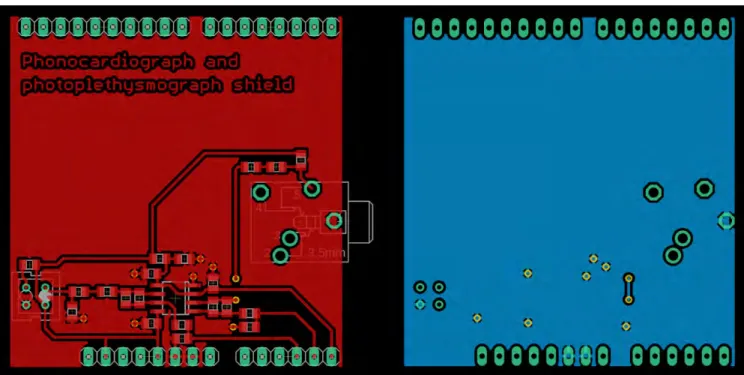
Note that we have designed an Arduino ‘shield’ version of the stethoscope and photoplethysmograph signal condi- tioning circuits and we have made the schematic and printed circuit board files available [34]. See Fig. 7 and Fig. 8 for the schematics and printed circuit board design.
E. SOFTWARE
After assembling the hardware, the job is to measure, process and display the time dependent signals. In a digital system this is based on periodic sampling. The ADC needs a trigger signal to sample and hold the voltage during conversion.
When the conversion is completed the data can be read by the software. The Arduino integrated development environ- ment (IDE) provides library functions to support this and also allows to plot the data in real time using the so-called serial plotter to which the data to be plotted can be sent over the serial communication port. In conclusion, only the free Arduino IDE is required to measure and display time depen- dent signals as on a chart recorder or on an oscilloscope. This is a nice feature and very useful for educational purposes, no additional tools and software are needed.
1) THE SIMPLEST SOLUTION
A very common method in the arduino community to measure a time dependent signal is the following: take a sample, wait for a given amount of time (the period) and repeat these as many times as needed [35]. Code 1 shows how simple it is.
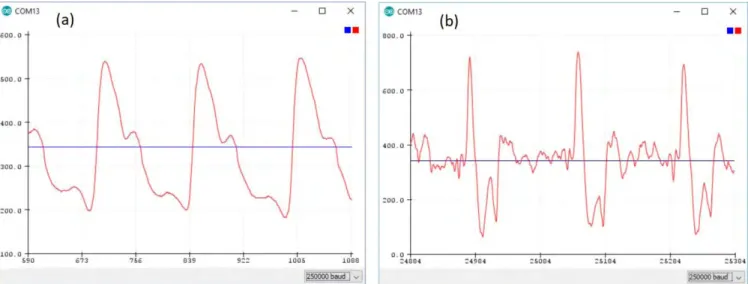
This code produces the output on the serial plotter shown in Fig. 9.
The sample rate provided by this code is close to 200 Hz and as it was mentioned, the circuit bandwidth was designed to fit this. Since the serial plotter can display 500 samples only, this frequency ensures readable real time plotting of the signals.
The time profile of the algorithm is shown in Fig. 10.
The analogRead function starts an A/D conversion, waits for the end of the conversion and then returns the data. After this the DC level value and this data are sent over the serial port and the LED is turned on or off to indicate the heart rhythm. Finally, the delay function is called to wait for a time
FIGURE 6. Breadboard realization of the stethoscope and photoplethysmograph circuits (a). It is enough to put the fingertip gently on the LED and phototransistor (b). These components are positioned in a certain angle to provide large and reliable signal.
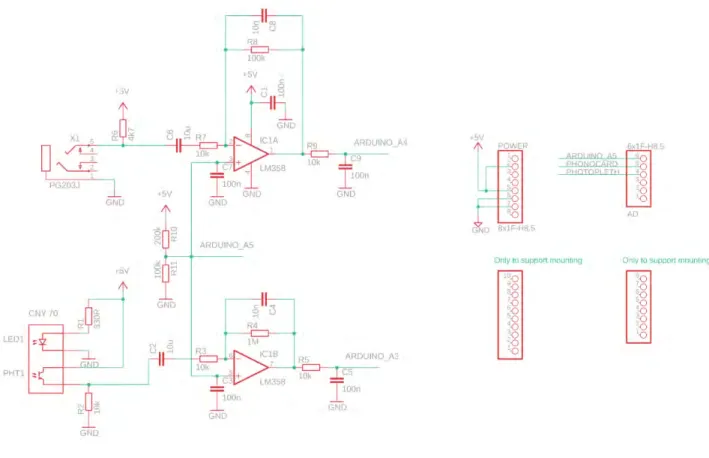
FIGURE 7. Schematic diagram of the printed circuit board version of the stethoscope and photoplethysmograph circuit.
of 5 ms. This is the usual way how a desired repetition rate is implemented in most Arduino applications. Although the signals look quite fine, similar to those what can be seen in the literature [15], [16], [23], [30], this is another point where the common solutions using Arduino is rather questionable.
One can easily see that the time tAP is neglected without knowing how long it is. Even if the rate is quite close to 200 Hz is this case, it gets worse at higher frequencies.
Detailed analysis of the effect is presented in the Results and discussion section.
FIGURE 8. Printed circuit board layout of the stethoscope and photoplethysmograph circuit. All of the components (except the pin headers) and wires are placed on the top (red) side. The bottom side (blue) realizes a solid, continuous ground plane.
CODE 1. Source code of the simplest method.
2) PRECISELY TIMED SAMPLING
In order to reduce the error of the period, it could be possible to calculate or measuretAPand take it into account. Although this can increase the precision, it depends on the current set- tings of the ADC, serial port data rate, current implementation of the analogRead function. Any additional code inside the loop changes the timing as well. Uncertainty is also expected due to the uncertain size (number of digits) of the strings sent
over the serial port and when conditional execution (e.g. if statements) are present.
Note that the Arduino hardware is practically a micro- controller with its pins wired to easy-to-use connectors plus some simple supporting circuits to provide power and com- munication with the host computer. The microcontroller is a professional electronic building block of embedded systems;
engineers know how it can be properly and efficiently used.
Figure 9.Photoplethysmograph waveform (a) and stethoscope signal (b) measured on the neck displayed on the serial plotter of the Arduino IDE. The blue line represents the DC level of the signals. Note, that the baud rate is configured to be the same as set in the code by Serial.begin(250000). The horizontal axis shows the number of samples; it can’t be configured in the Arduino integrated environment.
Figure 10. Time diagram of the code execution. Processing includes the number-to-string conversion, sending data over the serial port and setting the state of the on-board LED.
Figure 11. Block diagram of the timer-triggered A/D conversion. A counter, TCNT1 (Timer/counter1) is incremented at every input clock cycle. When its value is equal to the value stored in register OCR1A, TCNT1 is reset to zero and continues counting, i.e. it counts from 0 to OCR1A repeatedly.
Another comparator generates a start of conversion signal if TCNT1 matches the content of the OCR1B register.
In order to control various hardware timings, microcon- trollers have several built-in timers/counters. Timers use binary counters and a clock signal driving it. Using Arduino
Uno precisely timed periodic sampling is supported also by timer hardware as shown in Fig. 11. The processor’s system clock (16 MHz) is divided by an integer number
CODE 2. Additional source code in the setup() function for the timer triggered sampling.
CODE 3. Source code of the loop() function for the timer triggered sampling.
(selected from a set of 4 values: 1, 8, 64, 1024) and every rising edge of this clock signal increments a counter (TCNT1, Timer/counter1) [36]. When the counter reaches a programmable value (OCR1A, output compare register for Timer/counter1, A), it is reset to zero, and continues the counting. The A/D converter can be configured to start a con- version when the counter matches a certain value (OCR1B, output compare register for Timer/counter1, B). Therefore, periodic events with tunable frequency can be implemented to trigger an A/D conversion automatically without any software overhead. When the conversion is finished, an interrupt can be generated and in this case an interrupt service routine (ISR) will be called by the hardware to read the converted value. For details see the ‘‘Starting a conversion’’ and ‘‘Clear Timer on Compare Match (CTC) Mode’’ chapters in the datasheet [36] and the complete source code with informative comments [34]. A general tutorial on sampled data systems can also help to make the related basic principles of technol- ogy more clear [37].
During the execution of the ISR the main program loop is stalled. The main program must wait for data which has been read by another part of the code, the ISR.
Most important parts of the code are shown in Code 2 and Code 3 (the whole code is also available [34]). In the setup part the interrupts and timer are configured (Code 2), and the
main loop and ISR with synchronized data exchange can be seen in Code 3.
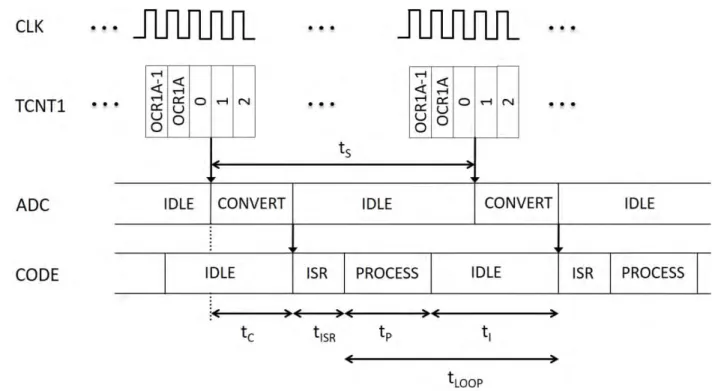
The time diagram of the processes including the code exe- cution is shown in Fig. 12. When the counter (CNT) reaches its top value and resets to zero, an A/D conversion is triggered.
Upon the end of conversion, the code is interrupted and an ISR is called that reads the ADC data into a variable. The counter, the ADC and the processor operate in parallel, during conversion the code can process other tasks. The time tS between samples is always precisely determined, it is equal to (OCRA1+1)·CLK period. The only restriction is that the data processing time should fit intLOOP, i.e.tP<tS−tISR. Note that violation of this condition is detected by the software.
The Arduino library uses some of the microcon- troller’s resources to implement certain functionality. Timer/
counter1 is applied to generate a pulse width modulated (PWM) signal on two dedicated pins (pin 9 and 10) by calling the function analogWrite and has role in the Servo library also. Therefore, these are not available, if Timer/counter1 triggers the A/D conversions.
3) BUFFERED SAMPLING
In some applications the processing time can be different for each sample and can be significantly longer thantS, although the average processing time falls belowtS. Examples include
Figure 12.Time diagram of the timer-triggered A/D conversions and processing. The CLK clock signal is derived from the system clock by prescaling (frequency division by 8 in our case), and each rising edge of this signal increments the counter (TCNT1). When it reaches the value stored in the OCRA1 register, the counter restarts the counting from zero and an A/D conversion is triggered.
Figure 13. A circular buffer allows asynchronous write and read operations and can store N samples of the data stream, 16 in this example. This way no data is lost even if the reading is temporarily slower than writing. The variable names are the same as in the example shown in Code 4.
conditional execution, waiting for the host to receive data, etc.
It is very common in such cases to implement a so called first- in-first-out (FIFO) memory buffer as a temporary storage for acquired data. This means that the ISR puts each ADC sample into a queue while the processing code reads out the available samples from this queue — just like using a conveyor belt.
What is written in first that will be read out first. Note that Arduino’s serial communication library uses this method also to send and receive a stream of bytes [38].
Code 4 employs a typical circular memory buffer [39] to implement this (see Fig. 13). The array adcDataBuffer stores
the samples, writePointer is used to address the array element to store the next ADC sample, while readPointer points to the array element to be read subsequently. The variable available- Samples counts the number of samples in the buffer.
4) MEASURING MULTIPLE SIGNALS
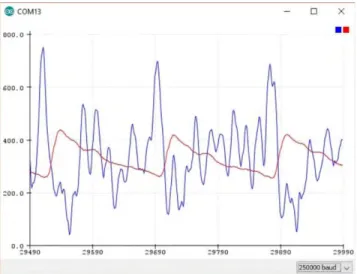
Since only one A/D converter is available, perfectly simul- taneous sampling of multiple signals is impossible. The best solution is to use the multiplexer to alternately connect the signals to the ADC after each conversion to perform a quasi- simultaneous sampling. Although in this case there is a time delay between the samples of different signals, it is well known (it is equal to the time between A/D conversions) and can even be taken into account. Code 5 implements the measurement of the stethoscope and photoplethysmograph signals [34]. The output can be seen in Fig. 14.
III. RESULTS AND DISCUSSION
We have used two interesting interdisciplinary measurements to demonstrate how very simple and cheap solutions can be given to implement a general system described in Fig. 1.
The analog circuitry consists of a few passive components, a dual operational amplifier, optoelectronic components and is built on a breadboard. All of these cost less than $10. The Arduino board can be programmed with its freely available integrated development environment. This application has a so-called serial plotter tool also that can be used to visualize the sampled data in real time. Although there are several limitations (e.g. maximum of 500 samples can be displayed per signal, the horizontal axis can’t be scaled), its simplicity is
CODE 4. Source code of the loop() function for the buffered sampling.
Figure 14. Quasi-simultaneous measurement of the stethoscope (blue) and photoplethysmograph (red) signals.
impressive, and it works as a chart recorder without installing any additional software components. If a measurement needs more advanced features, an additional software should be used, but for educational purposes the built-in tools are suffi- cient in most cases.
We have shown different approaches and analyzed their operation to make them as clear as possible. The key point is to understand the principles and to apply technically correct solutions. Surprisingly enough, very large proportion of the
available solutions for building the electronic circuitry and for sampling a time dependent signal employ rather questionable methods, do not follow the standard ways how the compo- nents should be used. Concerning STEM education this is a serious drawback and in the following we briefly draw the attention to the main problems.
A. THE MOST IMPORTANT PROBLEMS
First, it is hard to change an already learned and frequently used inadequate method and attitude later. The students should learn what kind of tools are available, how they can be used and what are the fundamental principles of operation. Learning, understanding and following the proven standards ensures faster progress, simpler and more efficient solutions. Note that one of the most important property of an engineer’s product is reliability. Today’s embedded systems (computer controlled devices) contain hardware and operated by software, they are rather complicated, therefore it is more challenging to make them reliable in all possible operat- ing conditions. Just mention the quite regular high volume car recalls [40] that are required mainly because of design and construction problems. Careless coding can cause fatal errors, a frequently mentioned example is the catastrophe of the Ariane 5 rocket that costed hundreds of millions of dollars because of an integer overflow [41]. Arduino users deal with both software and hardware, make a simple ver- sion of an embedded system, where learning about reliability
CODE 5. Source code of the loop() function for the dual channel sampling.
is essential. Careless, ignorant habit can be a source of serious problems later.
In the following we draw the attention to some impor- tant problems that are typically overlooked. Electronic and mechanical components have absolute maximum ratings that must not be exceeded in any case, otherwise they can be dam- aged or what is even worse, they can become unreliable [6].
One often hears that users of Arduino, Raspberry Pi or other common devices complain about damaged input/output ports.
This is caused by careless use, poor knowledge and absence of the required engineering-like attitude – mainly due to improper education. Uncertain behavior of a solution is one of the worst things that can happen, since it is harder to find the source of misbehavior. For example, the commonly missing decoupling capacitor (C1 in Fig. 6) and the use of lengthy wires on the breadboard can make the circuit sen- sitive, it can oscillate at high frequency irregularly and can degrade even low frequency or DC behavior [42]. Students are rarely able to find the reasons of such problems due to the lack of in-depth knowledge and understanding, therefore they often try to find a case with reckless trials when it seems to work. This is one example of the worst attitudes that can be developed [6], [43].
The next examples for errors are the stretching of sam- pling period and the uncertainty of this appear in the most
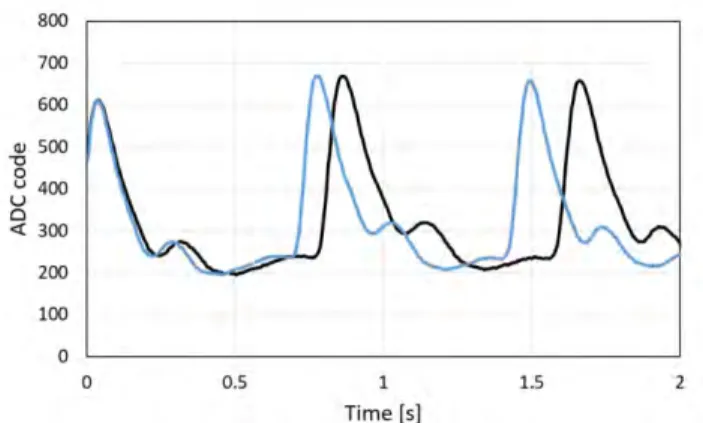
frequently used simple method of sampling a time-dependent signal we have shown above. The sampling period is longer than expected due to the finite time of the A/D conversion and processing time (see Fig. 10). This means that the signal appears to be faster, since the time between samples is longer than assumed. This effect is illustrated in Fig. 15. A signal is measured by the simple and accurately timed methods simultaneously using two boards and the two sampled signals are plotted.
The reasons of uncertainty include the following:
• variable number of characters sent over the serial port, analogRead can return a value from 0 to 1023 (surprisingly enough, the meaning of this value is often misinterpreted [7]);
• interrupts can pause the execution for a short a slightly varying time:
◦ serial communication interrupts occur to place the subsequent character into the output buffer;
◦ periodic interrupts update the system time variable [44].
This uncertainty of the sampling time (called aperture jitter) and its consequences are probably unknown and could be surprising for the majority of students and lecturers.
An unpredictable shift of the sampling point can cause a random amplitude deviation, as it is depicted in Fig. 16.
Figure 15. Photoplethysmograph waveforms of the same signal recorded simultaneously by the simplest (blue curve, see CODE 1) and timer triggered sampling methods (black curve, see CODE2 and CODE 3).
Figure 16. The aperture jitter (uncertainty in the sampling time instant)
±1tcauses amplitude error±1V.
The magnitude of this error caused by aperture jitter is typically demonstrated on a sinusoidal signal [37], [45]. The highest slope of the signal can be expressed as follows:
d(V·sin(2·π·f ·t)) dt
t=0
=V·2·π·f (1) Compared to the peak-to-peak amplitude 2·V the maximum relative error is
1V
2·V ≈1t·π·f (2)
In order to demonstrate this in the case of the simplest method a digital output is set at the beginning of the loop and cleared at the end of the data processing part, as shown in Code 6. Note that for toggling this output signal PINB=1 is used [36], since it takes a time of only a single system clock, while the library function digitalWrite would run much longer. This allows very accurate measurement of the execu- tion time of the code using an oscilloscope. We have used a Picoscope 2206A PC oscilloscope in persistence mode, when many captures are displayed simultaneously, see Fig. 17.
It is easy to see that the code produces an average delay of about 430µs and jitter of approximately±73µs. In the example programs we have shown that the nominal sample rate is 200 Hz, so according to the sampling theorem the high- est signal frequency must be less than half of this. Substituting the values into Eq (2) gives
1V
2·V =π·100·73·10−6≈0.023 (3)
CODE 6. Source code of the loop() function to measure aperture jitter.
Figure 17.Multiple captures of the signal show the spreading of the pulse width. The pulse width represents the duration of the processing part in the loop. The cursors are positioned to the shortest and longest extent.
This is worse than the resolution of a 6-bit ADC, 1/26, so 4 bits of the 10-bit ADC of the Arduino Uno can become useless. This means that the maximum error caused by the aperture jitter is about 23 times higher than the resolution of the ADC. Note that the resolution limitbLcan be expressed in number of useful bits by taking the 2-based logarithm of the relative error:
bL=log2
1V 2·V
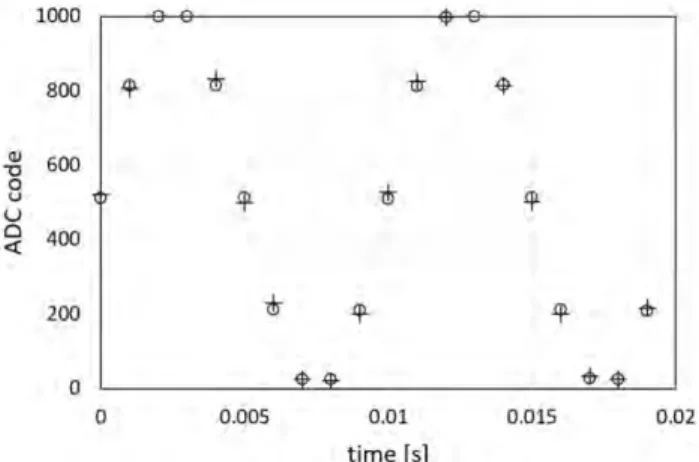
(4) A simulation example to illustrate the effect (spreadsheet in [34] was used to generate the samples) can be seen in Fig. 18 and Fig. 19.
These facts clearly show how seriously the measure- ment can be degraded by a very commonly used technique.
In addition, it probably remains unknown for the user, while measurement data without knowing the limitations and errors are useless.
In order to assess the timing uncertainty of the timer controlled sampling one can use the square wave generation mode of the timer [36]. In this case a digital signal is routed to a pin and is toggled on each compare match, in other words, when the counter reaches a certain value. We have written a simple code to generate a 1 MHz square wave [34]
and we have found that the signal is very stable, the period uncertainty is well below the resolution of the oscilloscope (2 ns), see Fig. 20. This means that the timer triggers the A/D
Figure 18. Simulation of a digitized 100 Hz sinusoidal signal sampled with aperture jitter of±73µs (crosses) and without aperture jitter (circles).
Figure 19. Error of the ADC code for the simulated signal shown in Fig. 18.
Figure 20. Multiple captures of the falling edge of a the-generated 1MHz square wave.
conversions with an uncertainty of less than 2 ns. Therefore, according to Eq. (2), the highest accuracy of the A/D con- versions can be maintained over the full frequency range of the ADC.
In conclusion, only hardware-triggered A/D conversion technique can guarantee the most accurate timing and the highest reliability since it is fully independent of any other processes. In spite of this, practically none of the Arduino users follows the correct solution, timer-controlled conver- sion is not used even in oscilloscope implementations [46], where the timing accuracy is essential. After an extensive web search and looking into books [47]–[51], we have found only one useful forum, where the timer-triggered technique is mentioned [52]. Note, that it is rather common to try to improve the accuracy of timing using time stamps. However, its limitations are not considered in most cases even though looking at the code it is clear that it needs a separate function call and a certain execution time.
Every measurement has its individual accuracy require- ments what can be more relaxed. For example, any of the code shown above can be used to measure the heart rate accurately enough in an educational experiment. However, the key point is to learn the generally valid correct and safe ways and to know about the limits of use. Even if an improper method produces accurate enough output in certain cases, it does not mean that it is acceptable. High-quality education should always follow the well-established rules of technology [43].
B. POSSIBLE ADDITIONS
The examples, demonstration and analysis we have shown in the above can help teachers, lecturers and students to under- stand and acquire engineering-like approach and to develop preferable attitude. It is also important to leave room for additional work and practicing needed for gaining reliable and applicable knowledge.
There are many possibilities to continue the experiment- ing and processing. Here we have used only the Arduino development environment and its built-in serial plotter to visualize data. As it was mentioned, this limits the sample rate during plotting because only 500 samples can be displayed.
The code can be easily modified for higher sample rates and the bandwidth of the circuits can be elevated accordingly.
These allow more accurate measurements and provide higher fidelity especially for the heart sound signals. Many further signal processing possibilities are also available. Proper heart beat detection can itself be a challenge, especially due to the significantly different nature of the photoplethysmograph and stethoscope signals. In our previous paper about stetho- scope signal acquisition and processing for education we have shown that several indicators of the cardiac function can be computed using the intervals between successive beats [16].
The methods, circuits and code can be applied in dif- ferent educational experiments as well even with the same hardware. The optical sensor part can be used to monitor movement of an object as it can serve also as a reflective photogate [53]. This can be useful to support mechanical investigations (pendulums, mass on a spring, collisions, etc.).
The stethoscope head and acquisition of its signal can also be used to monitor breathing and lung sounds and to learn about the interesting principles of photoacoustics [42].
Different sensors can also be used including magnetic pick-up coils, strain gauges and other sensors with small AC outputs that require the same high amplification as the photoplethysmograph signal.
There is a large selection of the so-called Arduino
‘‘shields’’ [55] providing additional capabilities including Bluetooth communication with a smart phone or desktop computer, Wifi modules, LCD displays and many more.
IV. CONCLUSION
The tools of modern technology formerly only used by experts are widely available today, but essential rules of correct application can remain hidden. A huge number of virtually working but professionally inadequate applications can be found on the Internet, that can mislead students, can make them less careful and it can be a drawback regard- ing high-quality STEM education. In order to follow the rapid development of technology, education should focus on teaching the basic principles and should try to show these to the students via various examples. According to these, in this paper we have demonstrated and discussed an engineering-like approach to apply modern tools and solu- tions in STEM education using two exciting interdisciplinary experiments. We have reviewed and analyzed how the heart function can be monitored with very simple Arduino-based setups in high-school or university education in various ways that follow the important rules of related technology. It has been demonstrated that simple external electronics and the Arduino development environment are enough to measure, display and study both photoplethysmograph and phonocar- diograph signals. All parts, methods and basic principles are made as transparent and clear as possible. We have focused on the universality of the methods for measuring photoplethysmograph and phonocardiograph signals and we have shown several solutions at various levels of complexity.
We have performed a careful novel analysis and demonstra- tion of the problems of widely used solutions and we have shown the technically correct ways which are surprisingly rare and particularly important in high quality STEM edu- cation. This can help to reduce the gap between modern technology and related education and helps also to learn proper engineering-like approach and attitude which are essential in the future of students of science, technology and engineering.
Circuit schematics, building methods and source code are made available, the cost of building the systems is very low and all components are easily accessible [34]. A dedicated web page supporting future additions are also provided [56].
The presented methods can serve as a basis of many different educational jobs at various levels and in several disciplines.
We have shown illustrative examples for sensor interfacing, analogue signal conditioning, sampling and processing of the sampled data. Teacher demonstrations, student experiments, teaching the most important principles and the proper ways of application of electronics and coding are also supported.
Note also, that the source code of the timer-triggered mode
can also be used as a precisely paced general chart recorder, low frequency oscilloscope.
REFERENCES
[1] Lego. Mindstorms EV3. Accessed: Feb. 2019. [Online]. Available:
https://education.lego.com/en-us/shop/mindstorms-ev3
[2] Raspberry Foundation. Teach, Learn, and Make with Raspberry Pi.
Accessed: Feb. 2019. [Online]. Available: https://www.raspberrypi.org/
[3] Arduino. Arduino—Home. Accessed: Feb. 2019. [Online]. Available:
https://www.arduino.cc/
[4] Micro: Bit Educational Foundation. Accessed: Feb. 2019. [Online]. Avail- able: https://microbit.org/
[5] Scratch—Imagine, Program, Share. Accessed: Feb. 2019. [Online]. Avail- able: https://scratch.mit.edu/
[6] Z. Gingl, R. Mingesz, G. Makan, and J. Mellar, ‘‘Driving with an Arduino?
Keep the lane!’’Phys. Educ., vol. 54, no. 2, 2019, Art. no. 025010.
[7] Z. Gingl, G. Makan, and J. Z. Mellar, ‘‘Arduino data conversion—1023 or 1024?’’ Figshare, Univ. Szeged, Szeged, Hungary, Tech. Rep., 2018. doi:
10.6084/m9.figshare.7434074.
[8] Z. Gingl, J. Mellár, T. Szépe, G. Makan, R. Mingesz, G. Vadai, and K. Kopasz, ‘‘Universal Arduino-based experimenting system to support teaching of natural sciences,’’J. Phys., Conf. Ser., 2019. [Online]. Avail- able: https://arxiv.org/abs/1901.03810
[9] Committee On STEM Education of the National Science & Technology Council, Charting A Course For Success: America’s Strategy For Stem Education. Accessed: Feb. 2019. [Online]. Available:
https://www.whitehouse.gov/wp-content/uploads/2018/12/STEM- Education-Strategic-Plan-2018.pdf
[10] G. Makan, R. Mingesz, and Z. Gingl, ‘‘How accurate is an Arduino Ohmmeter?’’Phys. Educ., vol. 54, no. 3, 2019, Art. no. 033001.
[11] K. Zachariadou, K. Yiasemides, and N. Trougkakos, ‘‘A low-cost computer-controlled Arduino-based educational laboratory system for teaching the fundamentals of photovoltaic cells,’’Eur. J. Phys., vol. 33, no. 6, pp. 1599–1610, 2012.
[12] C. Galeriu, S. Edwards, and G. Esper, ‘‘An Arduino investigation of simple harmonic motion,’’Phys. Teacher, vol. 52, no. 3, pp. 157–159, 2014.
[13] J.-F. Hsu, S. Dhingra, and B. D’Urso, ‘‘Design and construction of a cost- efficient Arduino-based mirror galvanometer system for scanning optical microscopy,’’Amer. J. Phys., vol. 85, no. 1, pp. 68–75, 2017.
[14] L.-J. Thoms, G. Colicchia, and R. Girwidz, ‘‘Phonocardiography with a smartphone,’’Phys. Educ., vol. 52, no. 2, 2017, Art. no. 023004.
[15] Z. Gingl, ‘‘A photoplethysmograph experiment for microcontroller labs,’’
Int. J. Elect. Eng. Educ., vol. 49, no. 1, pp. 42–60, 2012.
[16] T. Nagy, G. Vadai, and Z. Gingl, ‘‘Digital phonocardiographic experiments and signal processing in multidisciplinary fields of University education,’’
Eur. J. Phys., vol. 38, no. 5, 2017, Art. no. 055802.
[17] F. Thompson, ‘‘Measuring heart beats,’’ Phys. Educ., vol. 49, no. 2, pp. 131–134, 2014.
[18] V. T. Wynn, ‘‘A simple plethysmograph,’’Phys. Educ., vol. 25, no. 5, pp. 286–288, 1990.
[19] M. Volná, F. Látal, R. Kubínek, and L. Richterek, ‘‘The human heart and the circulatory system as an interesting interdisciplinary topic in lessons of physics and biology,’’Eur. J. Phys., vol. 35, no. 1, 2013, Art. no. 015026.
[20] T. Nagy and Z. Gingl, ‘‘Low-cost photoplethysmograph solutions using the Raspberry Pi,’’ inProc. IEEE 14th Int. Symp. Comput. Intell. Inform.
(CINTI), Nov. 2013, pp. 163–167.
[21] Heart+Rate+Arduino. Accessed: Feb. 2019. [Online]. Available:
https://www.google.com/search?q=heart+rate+arduino
[22] Stethoscope+Arduino. Accessed: Feb. 2019. [Online]. Available:
https://www.google.com/search?q=stethoscope+arduino
[23] K. H. Shelley, ‘‘Photoplethysmography: Beyond the calculation of arterial oxygen saturation and heart rate,’’Anesthesia Analgesia, vol. 105, no. 6, pp. S31–S36, 2007.
[24] A. L. Lee, A. J. Tahmoush, and J. R. Jennings, ‘‘An LED-transistor photoplethysmograph,’’IEEE Trans. Biomed. Eng., vol. BME-22, no. 3, pp. 248–250, May 1975.
[25] A. Bánhalmi, J. Borbás, M. Fidrich, V. Bilicki, Z. Gingl, and L. Rudas,
‘‘Analysis of a pulse rate variability measurement using a smartphone camera,’’J. Healthcare Eng., vol. 2018, Feb. 2018, Art. no. 4038034.
[26] The Smartphone Stethoscope Steth IO. Accessed: Feb. 2019. [Online].
Available: https://stethio.com/
[27] P. Salber. (Jul. 20, 2017).StethoCloud: A New Tool for Dr. Mommy?
The Doctor Weighs. [Online]. Available: https://thedoctorweighsin.com/
stethocloud-new-tool-dr-mommy/
[28] STMicroelectronics. AN2944: Plethysmograph Based on the TS507.
Accessed: Feb. 2019. [Online]. Available: https://www.st.com/resource/
en/application_note/cd00227460.pdf
[29] Texas Instruments. Single-Supply, Electret Microphone Preamplifier Reference Design. Accessed: Feb. 2019. [Online]. Available:
http://www.ti.com/tool/TIPD181
[30] A. Choi and H. Shin, ‘‘Photoplethysmography sampling frequency: Pilot assessment of how low can we go to analyze pulse rate variability with reliability?’’Physiol. Meas., vol. 38, no. 3, pp. 586–600, Mar. 2017.
[31] M. Abo-Zahhad, S. M. Ahmed, and S. N. Abbas, ‘‘Biometric authentica- tion based on PCG and ECG signals: Present status and future directions,’’
Signal, Image Video Process., vol. 8, no. 4, pp. 739–751, May 2014.
[32] W. Kester. Breadboarding and Prototyping Circuits. Analog Devices.
Accessed: Feb. 2019. [Online]. Available: https://www.analog.com/
en/analog-dialogue/articles/studentzone-november-2016.html
[33] W. Kester. Grounding and Decoupling: Learn Basics Now and Save Yourself Much Grief Later! Part 2: Decoupling. Analog Devices.
Accessed: Feb. 2019. [Online]. Available: https://www.analog.com/
en/analog-dialogue/articles/studentzone-april-2017.html
[34] Z. Gingl, G. Makan, J. Z. Mellár, G. Vadai, and R. Mingesz, ‘‘Supplemen- tary files for the manuscript ‘phonocardiography and photoplethysmogra- phy with simple Arduino setups to support interdisciplinary STEM edu- cation,’’ Figshare, Univ. Szeged, Szeged, Hungary, Tech. Rep., Nov. 2018.
doi:10.6084/m9.figshare.7308356.
[35] Delay—Arduino. Accessed: Feb. 2019. [Online]. Available:
https://www.arduino.cc/reference/en/language/functions/time/delay/
[36] Microchip Technology. ATmega328P Device Overview. Accessed:
Feb. 2019. [Online]. Available: https://www.microchip.com/www products/en/ATmega328P
[37] W. Kester, ‘‘Fundamentals of sampled data systems,’’The Data Conversion Handbook. Amsterdam, The Netherlands: Elsevier, 2005, ch. 2. [Online].
Available: https://www.analog.com/en/education/education-library/data- conversion-handbook.html
[38] Stream—Arduino. Accessed: Feb. 2019. [Online]. Available: https://www.
arduino.cc/reference/en/language/functions/communication/ stream/
[39] Circular Buffer. Accessed: Feb. 2019. [Online]. Available:
https://en.wikipedia.org/wiki/Circular_buffer
[40] (Nov. 9, 2018).Safety Issues & Recalls. NHTSA. [Online]. Available:
https://www.nhtsa.gov/recalls
[41] How Not To Code. (Sep. 5, 2016). A Space Error: 370 Million for an Integer Overflow. [Online]. Available: https://hownot2code.com/
2016/09/02/a-space-error-370-million-for-an-integer-overflow/
[42] Intersil. AN1325: Choosing and Using Bypass Capacitors. Accessed:
Feb. 2019. [Online]. Available: https://www.intersil.com/content/dam/
Intersil/documents/an13/an1325.pdf
[43] Z. Gingl and R. Mingesz, ‘‘Voltmeter in series?’’Phys. Eduv., vol. 54, no. 4, 2019, Art. no. 045017.
[44] Millis—Arduino. Accessed: Feb. 2019. [Online]. Available:
https://www.arduino.cc/reference/en/language/functions/time/millis/
[45] W. Kester.Aperture Time, Aperture Jitter, Aperture Delay Time—Removing the Confusion. Analog Devices. Accessed: Feb. 2019. [Online]. Available:
http://www.analog.com/media/ru/training-seminars/tutorials/MT-007.pdf [46] 9 Oscilloscope Projects—Arduino Project Hub. Accessed: Feb.
2019. [Online]. Available: https://create.arduino.cc/projecthub/projects/
tags/oscilloscope
[47] M. Margolis,Arduino Cookbook. Sebastopol, CA, USA: OReilly Media, 2018.
[48] C. Amariei,Arduino Development Cookbook: Over 50 Hands-on Recipes to Quickly Build and Understand Arduino Projects, from the Simplest to the Most Extraordinary. Birmingham, U.K.: Packt, 2015.
[49] J. Blum,Exploring Arduino: Tools and Techniques for Engineering Wiz- ardry. Hoboken, NJ, USA: Wiley, 2013.
[50] J. Boxall,Arduino Workshop: A Hands-On Introduction with 65 Projects.
San Francisco, CA, USA: No Starch Press, 2013.
[51] GitHub. Hexagon5un/AVR-Programming. Accessed: Feb. 2019.
[Online]. Available: https://github.com/hexagon5un/AVR-Programming/
tree/master/Chapter07_Analog-to-Digital-Conversion-I/slowScope [52] Gammon Software Solutions Home Page. Gammon Forum:
Electronics: Microprocessors: ADC Conversion on the Arduino (AnalogRead). Accessed: Feb. 2019. [Online]. Available: https://www.
gammon.com.au/adc
[53] Z. Gingl, R. Mingesz, P. Makra, and J. Mellár, ‘‘Review of sound card photogates,’’Eur. J. Phys., vol. 32, no. 4, pp. 905–924, 2011.
[54] D. I. Nikitichev, W. Xia, E. Hill, C. A. Mosse, T. Perkins, K. Konyn, S. Ourselin, A. E. Desjardins, and T. Vercauteren, ‘‘Music-of-light stetho- scope: A demonstration of the photoacoustic effect,’’Phys. Educ., vol. 51, no. 4, 2016, Art. no. 045015.
[55] Arduino-Shields. Accessed: Feb. 2019. [Online]. Available:
https://www.arduino.cc/en/Main/arduinoShields
[56] HAS Research Group of Technical Informatics Methodology.
Phonocardiography and Photoplethysmography with Arduino.
Accessed: Feb. 2019. [Online]. Available: http://www.inf.u- szeged.hu/miszak/en/phonocardiography-and-photoplethysmography- with-arduino/
ZOLTAN GINGL received the M.Sc. and Ph.D.
degrees in physics from the University of Szeged, Hungary, and the D.Sc. degree in electrical engi- neering from the Hungarian Academy of Sciences.
Since 1989, he has been with the University of Szeged, where he is a Full Professor and the Head of the Department of Technical Informatics.
He has published numerous papers related to vari- ous fields including noise and fluctuations, secure communications, and multidisciplinary software- defined instrumentation and education.
GERGELY MAKANreceived the M.Sc. degree in physics from the University of Szeged, Hungary, where he is currently a Research Assistant with the Department of Technical Informatics. His research interests include signal analysis and simulation in multidisciplinary fields, software-based instru- mentation and computer-aided experimentation to support education.
JANOS MELLAR received the M.Sc. degree in informatics/physics from the University of Szeged, Hungary, where he is currently a Department Engi- neer with the Department of Technical Informat- ics. His research interests include software-based instrumentation and computer-aided experimenta- tion to support education.
GERGELY VADAI received the M.Sc. degree in physics and the Ph.D. degree in computer sci- ence from the University of Szeged, Hungary, where he has been an Assistant Lecturer with the Department of Technical Informatics, since 2015. His research interests include exploitation of noise and fluctuations in multidisciplinary fields, and computer-aided experimentation to support education.
ROBERT MINGESZ received the M.Sc. and Ph.D. degrees in physics from the University of Szeged, Hungary. He is currently an Assistant Pro- fessor with the Department of Technical Informat- ics, University of Szeged. He has over 12 years of experience in the fields related to instrumentation, data acquisition, data processing, and software engineering. His main research areas include the study of properties of colored noises (stochastic resonance, 1/f noise), examining the constructive role of noises and fluctuations (fluctuation enhanced sensing, noise-based secure key exchange), designing and building software-defined data acqui- sition and data processing systems for multidisciplinary applications and education.