HEMATOPOIESIS AND STEM CELLS
Phosphoproteomic pro fi ling of mouse primary HSPCs reveals new regulators of HSPC mobilization
Leo D. Wang,1-3Scott B. Ficarro,4,5John N. Hutchinson,6Roland Csepanyi-Komi,7Phi T. Nguyen,1,2Eva Wisniewski,7 Jessica Sullivan,1,2Oliver Hofmann,6Erzsebet Ligeti,7Jarrod A. Marto,4,5and Amy J. Wagers1,2,8
1Joslin Diabetes Center, Boston, MA;2Harvard Stem Cell Institute, Harvard University, Cambridge, MA;3Dana-Farber Boston Children’s Cancer and Blood Disorders Center, Boston, MA;4Department of Biological Chemistry and Molecular Pharmacology, Harvard Medical School, Boston, MA;5Department of Cancer Biology and Blais Proteomics Center, Dana-Farber Cancer Institute, Boston, MA;6Department of Biostatistics, Harvard T. H. Chan School of Public Health, Harvard University, Boston, MA;7Department of Physiology, Semmelweis University, Budapest, Hungary; and8Department of Stem Cell and Regenerative Biology, Harvard University, Cambridge, MA
Key Points
• Combining flow cytometry and high-performance mass spectrometry enables
phosphoproteomic analysis of rare blood cell populations.
• ARHGAP25
dephosphorylation augments activity and promotes blood stem and progenitor cell mobilization by enhancing CXCL12 and Rac signaling.
Protein phosphorylation is a central mechanism of signal transduction that both positively and negatively regulates protein function. Large-scale studies of the dynamic phosphory- lation states of cell signaling systems have been applied extensively in cell lines and whole tissues to reveal critical regulatory networks, and candidate-based evaluations of phosphorylation in rare cell populations have also been informative. However, application of comprehensive profiling technologies to adult stem cell and progenitor populations has been challenging, due in large part to the scarcity of such cells in adult tissues. Here, we combine multicolor flow cytometry with highly efficient 3-dimensional high performance liquid chromatography/mass spectrometry to enable quantitative phosphoproteomic anal- ysis from 200 000 highly purified primary mouse hematopoietic stem and progenitor cells (HSPCs). Using this platform, we identify ARHGAP25 as a novel regulator of HSPC mobilization and demonstrate that ARHGAP25 phosphorylation at serine 363 is an important modulator of its function. Our approach provides a robust platform for large-scale phosphoproteomic analyses performed with limited numbers of rare progenitor cells. Data from our study comprises a new resource for understanding the molecular signaling networks that underlie hematopoietic stem cell mobilization. (Blood. 2016;128(11):1465-1474)
Introduction
Hematopoietic stem cells (HSCs) are capable of self-regeneration and differentiation to provide the full complement of hematopoietic cells required during an organism’s lifetime. These cells are also the functional units in bone marrow (BM) transplantation, commonly used as treatment of hematopoietic malignancies. HSCs are exceedingly rare, which has placed technical limitations on comprehensive analyses of their molecular and biochemical properties. Such analyses have historically been limited to nucleic acid analyses, including genomic, epigenetic, and transcriptional profiling,1-6 and although such ap- proaches are clearly informative and have revealed key determinants of HSC fate and function, messenger RNA levels often correlate poorly with protein levels and provide no information on posttranslational modification,7,8which is often critical for regulating protein function.
Although targeted, candidate-based proteomic evaluation of hemato- poietic stem and progenitor cells (HSPCs) has been accomplished,9-11 such approaches cannot support the identification of as yet unknown pathways and targets important in HSPC biology and disease.
Interestingly, a recent study using mass spectrometry (MS) to compare
the proteomes of HSCs and more mature multipotent progenitor cells identified only 47 differentially represented proteins,12suggesting that differences in self-renewal potential between stem cells and progenitors may be effected by only a handful of proteins, or that protein activation state, rather than expression level, is critical in establishing the differ- ential properties of these primitive hematopoietic precursors. Such differences in protein activation state may be particularly important in cellular state changes in response to physiological stimuli, such as those induced in HSPCs by pharmacologic mobilization.
Because phosphorylation is the dominant activity modifying posttranslational modification in HSPCs,13,14we sought to test this hypothesis by developing a unique MS-based phosphoproteomic screening platform to profile activated signaling networks in primary HSPCs. Our platform usesflow cytometry to isolate highly purified primary mouse HSPCs, followed by online 3-dimensional (3-D) reversed-phase, strong anion exchange, reversed-phase (RP-SAX-RP) liquid chromatography separation of derived tryptic peptides, which is directly coupled to tandem MS. This system is capable of quantifying
Submitted May 4, 2016; accepted June 28, 2016. Prepublished online as Blood First Edition paper, June 30, 2016; DOI 10.1182/blood-2016-05- 711424.
The online version of this article contains a data supplement.
There is an InsideBloodCommentary on this article in this issue.
The publication costs of this article were defrayed in part by page charge payment. Therefore, and solely to indicate this fact, this article is hereby marked “advertisement” in accordance with 18 USC section 1734.
©2016 by The American Society of Hematology
BLOOD, 15 SEPTEMBER 2016xVOLUME 128, NUMBER 11 1465
over 12 000 unique phosphopeptide sequences from 200 000 sorted mouse BM HSPCs, representing a significant technical advance over previously published reports in the stem cellfield.12,15By comparing resting BM HSPCs to pharmacologically mobilized HSPCs, we identified 178 differentially phosphorylated proteins of potential importance for HSPC mobilization. Among these targets, we vali- dated ARHGAP25, a recently described GTPase activating protein (GAP) of the small GTPase Ras-related C3 botulinum toxin substrate 1 (Rac1),16,17as an important regulator of HSPC mobilization whose function is modulated by phosphorylation. Moreover, we showed that phosphorylation of ARHGAP25 on serine 363 (S363) inhibits its ability to catalyze Rac-GTP hydrolysis, and that deletion of ARHGAP25 inArhgap25knockout mice augments chemotaxis of HSPCs to CXCL12, which is a Rac-dependent process. Taken to- gether, these results establish our approach as a robust and powerful bioanalytical platform to discover new and important regulators of HSPC biology.
Methods
Pharmacologic mobilization
Mice were housed in barrier facilities at the Joslin Diabetes Center and Harvard School of Public Health, and were cared for according to Institutional Animal Care and Use Committee protocols of those institutions. For HSPC mobilization, mice were treated with cyclophosphamide (Cy) (Bristol-Myers Squibb, New York, NY) on d–1 and received 4 subsequent daily doses of granulocyte colony- stimulating factor (G-CSF) (Amgen, Thousand Oaks, CA), as described.18 Resting Lin2Sca-11c-Kit1 (LSK) HSPCs were isolated from the bones of unmanipulated mice. Mobilized HSPCs were isolated from spleens of mice 16 hours after the 4th dose of G-CSF.
Flow cytometric analysis
Hematopoietic cells were stained with directly conjugated or biotinylated an- tibodies followed by fluorophore-conjugated streptavidin, then analyzed or sorted on a BD LSR II or BD Aria II (Becton Dickinson, East Rutherford, NJ).
Data were analyzed using FloJo software (Tree Star, Ashland, OR). For a listing of the antibodies, see supplemental Methods, available on theBloodWeb site.
Sample processing for proteomics
Fluorescence-activated cell sorted samples were centrifuged and resuspended in lysis buffer (7.2 M guanidine HCl [GuHCl] with 100 mM ammonium bicarbonate), and thenflash frozen at280°C. After thawing, cells were incubated for 10 minutes at room temperature to allow additional lysis/denaturation, and mixtures were spiked with 5 mcg carrier bovine serum albumin. Proteins were reduced with 10 mM Dithiothreitol (30 minutes at 56°C) and then alkylated with 22.5 mM iodoacetamide (30 minutes at room temperature, protected from light).
After dilution to 1 M GuHCl with 100 mM ammonium bicarbonate, proteins were digested overnight with 10 mcg trypsin (Promega, Madison, WI). After digestion, peptide samples were acidified with 10% trifluoroacetic acid, desalted using C18-embedded 96-well plates (mElution plate; Waters, Milford, MA), and dried by vacuum centrifugation. Samples were resolubilized in 100mL of 70%
ethyl alcohol/30% 0.5 M triethylammonium bicarbonate buffer, added to 1 unit of Tandem Mass Tag reagent (Thermo Fisher Scientific) dissolved in 40mL of anhydrous acetonitrile (Sigma-Aldrich), and incubated for 1 hour at room temperature. Reactions were acidified, combined, and dried by vacuum centrifugation. Labeled peptides were desalted as described previously and phosphopeptides enriched by Fe31-nitrilotriacetate (NTA) immobilized metal affinity chromatography (IMAC),19except that the elution buffer consisted of 1:20 ammonia/water with 50 mM GuHCl, 0.5 mM EDTA, and 50 fmol/mL [glu-1]
fibrinopeptide B and angiotensin I.
3-D RP-SAX-RP–MS platform
Enriched phosphopeptides were analyzed by 3-D RP-SAX-RP as described,19 with modifications. Thefirst and second dimension columns consisted of 6 cm 5mm XBridge C18 and 6 cm POROS HQ, respectively, packed into 3603150mm fused silica. Peptides were separated into 9 fractions by eluting peptides from thefirst and second dimension columns using acetonitrile and ammonium formate (pH510). The elution sequence used 15%, 20%, 25%, and 35% acetonitrile with 230 mM ammonium formate, with each organic step followed by an injection of 675 mM ammonium formate to elute acidic peptides from the second dimension SAX column (8 total fractions). Finally, a 90% acetonitrile and 900 mM ammonium formate, 10% acetic acid elution step was used to create afinal elution fraction. After each fraction step, peptides were eluted with a high performance liquid chromatography gradient (Orbitrap Velos: 5% to 35% B in 60 minutes; Orbitrap Fusion: 5% to 35% B in 240 minutes, A50.2 M acetic acid in water, B50.2 M acetic acid in acetonitrile) resolved on the analytical column with integrated 1mm emitter tip (Orbitrap Velos: 360330mm fused silica packed with 12 cm 5mm Monitor C18 [Ontario, CA]; Orbitrap Fusion: 360330mm fused silica packed with 50 cm 5mm Monitor C18), and electrosprayed (ESI voltage5 3.8 kV) into the mass spectrometer (Orbitrap Velos or Orbitrap Fusion;
Thermo-Fisher Scientific, San Jose, CA). A digital picoview platform (New Objective, Woburn, MA) was used to automatically position the emitter tip in spray or wash (ie, elute fraction) positions over the course of the experiment.
The Orbitrap Velos was programmed to operate in data-dependent mode such that the 10 most abundant precursors in each MS scan (target55E5, maximumfill time5500 ms, and resolution5120 K) were subjected to collision-activated dissociation (CAD) (isolation52.4 Da, normalized collision energy535%, target55E3, maximum injection525 ms) and higher-energy collisional dissociation (HCD) (isolation52 Da, normalized collision energy545%, resolution57500 K, target55E4, and maximum injection5100 ms). The Orbitrap Fusion was operated in data-dependent mode whereby the 15 most abundant precursors in each MS scan (target55E5, maximum injection5500 ms, and resolution5120 K) were subjected to CAD (isolation5quadrupole, 1.6 Da isolation width, multiplier detection, target55E3, maximum injection550 ms, and normalized collision energy535%) and HCD (isolation5quadrupole, 1.6 Da isolation width, image current detection, resolution515 K, normalized collision energy540%, target55E4, and maximum injection5100 ms). On each instrument, dynamic exclusion was enabled with a repeat count of 1 and exclu- sion duration of 30 seconds.
Data processing and phosphosite identification
Datafiles were directly assessed and converted to .mgf usingmultiplierz scripts20,21and searched against a forward/reverse human National Center for Biotechnology Information refseq database using Mascot 2.2.1. Search param- eters specified a precursor ion tolerance of 10 ppm and product ion tolerances of 0.6 Da and 25 mmu for CAD and HCD spectra, respectively. Parameters also included trypsin specificity, up to two missed cleavages,fixed carbamidome- thylation, and TMT labeling (N-term, K), as well as variable oxidation (Met) and phosphorylation (Ser, Thr, Tyr).Multiplierzscripts were further used to down- load search results into .xls format,filter the data to,1% false discovery rate, and extract TMT reporter ion intensities. Reporter ion intensities were corrected for isotopic impurities according to the manufacturer’s specifications, and further corrected for differences in injection times and source protein variation as described.22,23These data were used as input for further bioinformatic analysis.
Raw datafiles were deposited in the PRoteomics IDEntifications database.
Bioinformatic analysis of identified phosphopeptides
Corrected reporter ion intensities of identified phosphopeptides were summed at the phosphoprotein residue level and normalized between samples by dividing by each sample’s total reporter ion intensities, or using the trimmed mean of M-values method from the edgeR Bioconductor package. Batch variation between experiments was removed using the RUVSeq Bioconductor package24 and the normalized, batch-corrected phosphoresidue counts analyzed with the non-negative matrix factorization (NMF) Bioconductor package.25The number of signatures (factorization rank) that best described the samples was estimated by running trial runs of 50 iterations each for factorization ranks of 2 to 5, all with the
same seed. Consensus matrix heatmaps from these trials indicated that a factorization rank of 2 allowed clustering of consensus blocks by sample type.
Multiple NMF algorithms were assessed and the nonsmooth NMF algorithm26 selected, because it converged with the lowest approximation error. Using these parameters, the NMF algorithm was run with a random seed for 1250 iterations to allow full convergence. Signature phosphopeptide residues were extracted and thenfiltered by“featurescore”(described as gene_score27) to select residues most specific to each signature. Finally, a mixture expression profile heatmap, which summarizes the relative contribution of each signature to each sample, was used to assign signatures to the sample classes.
Arhgap252/2mice
Arhgap252/2mice (CSD28473) were obtained as cryopreserved embryos from thetrans-National Institutes of Health (NIH) Knockout Mouse Project (KOMP) Repository (www.komp.org),28recovered using standard techniques and housed as above.
BM transplantation
BM mononuclear cells from age- and gender-matched male or female mice were retro-orbitally injected (13106cells per recipient) into anesthetized, lethally irradiated (950 rads) congenic (CD45.11) recipients. Recipients received trimethoprim-sulfamethoxazole in their drinking water for 4 weeks posttrans- plant to prevent infection.
GlutathioneS-transferase (GST)-fusion protein production and GTPase assays
Fragments encoding the pleckstrin homology (PH) domain, GAP domain, coiled-coil domain (CC), and full-length ARHGAP25 were generated from leukocyte complementary DNA as described previously.7,8,17The interdo- main (ID) region was cloned from the full length GST-ARHGAP25 using the following primers: forward: 59-ATAGGATCCCCCCCTGCCCAGA AAAATGACC-39, reverse: 59-CCGCTCGAGTGGACTGGCAAGAGTA TCTCCCTT-39, and inserted into the pGEX4T-1 vector. Thereafter, GST fusion proteins were produced inEscherichia coli. Mutation of S363 to alanine was performed with site-directed mutagenesis using the following primers: forward: 59-CCCTGGCACCCCCTGCCCAGAAAAATGACC-39 and reverse: 59-CAGGGGGTGCCAGGGGTATATCCTTGGACTTGG-39.
GTPase activity was measured by nitrocellulosefilter-binding assay as pre- viously described.9-11,17
In vitro phosphorylation assays
A total of 100mg of the indicated GST fusion proteins were phosphorylated with 200 mL of cytosolic extract from primary human neutrophils12,29 pretreated with 20 ng/mL TNF-ain the presence of 30mL kinase buffer (20 mM Tris-HCl, pH57.4, 10 mM MgCl2, 1 mM Dithiothreitol, 1 mM Phosphatase Inhibitor Cocktail [Sigma-Aldrich, Natick, MA], 0.1 mM Na- EGTA, 20mM nonradiolabeled adenosine triphosphate [ATP]), and 10mCi [g-32P]-ATP. After 30 minutes incubation at 37°C, samples were boiled for 5 minutes and subjected to sodium dodecyl sulfate–polyacrylamide gel electro- phoresis. The gels were stained with Coomassie blue, dried, and mounted on a Bio-Rad GS-525 Molecular Imager. Images were captured with Multi-Analyst software (version 1.1; Bio-Rad, Hercules, CA) over a 48-hour exposure.
Phosphorylation of ARHGAP25 constructs for GTPase assays was performed identically, but in the presence of 1 mM ATP and without radiolabeled ATP.
Transwell chemotaxis assay
BM cells were harvested fromArhgap252/2or wild-type (WT) mice, enriched for progenitors using CD117 MicroBeads (Miltenyi Biotec, San Diego, CA), counted, and plated at 23106per well into the top chambers of 24-well, 5mm pore polycarbonate membrane Transwell supports (Corning, Kennebunk, ME).
All conditions were plated in triplicate; 20 ng/mL rmCXCL12 (R&D Systems, Minneapolis, MN) was then added to the appropriate wells before incubation for 1 hour at 37°C. Subsequently, counting beads were added to the bottom wells.
Beads and transmigrated or control cells were recovered from the bottom wells, and unmigrated cells were recovered from the top wells. Recovered cells were
stained with antibodies to lineage markers and Sca-1, c-Kit, CD150, and CD48 (supplemental Methods), and analyzed byflow cytometry.
Results
Phosphoproteomic interrogation identifies differential phosphorylation of ARHGAP25 in pharmacologic mobilization of mouse HSPCs
In adult mammals, HSPCs reside predominantly in the BM, where they continuously receive signals from a complex and heterogeneous microenvironment.13,14,30,31
Under hematopoietic stress or after growth factor stimulation, HSPCs expand dramatically and migrate into and out of the central BM compartment.12,15,32,33
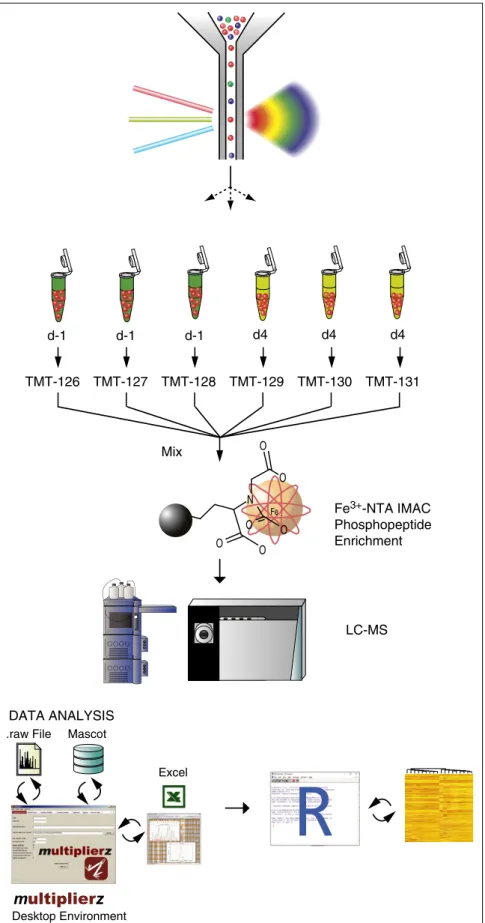
Circulating HSCs rapidly re-engraft into distant BM sites and contribute to ongoing marrow hematopoiesis,16,17,34as well as to peripheral immune responses.18,35 The mechanisms underlying HSPC mobilization are not well un- derstood, despite its importance in hematopoietic homeostasis and in clinical harvesting of HSPC donors. Additionally, for many targets, messenger RNA and protein levels are discordant during pharmaco- logic mobilization,7,19 highlighting the importance of protein-level analysis in understanding this process. One major obstacle to extensive proteomic characterization, however, is the relative rarity of these cells in the BM microenvironment. We reasoned that combining multipa- rameterflow cytometry and multidimensional fractionation MS would enable phosphoproteomic interrogation of signaling pathways that mediate HSPC mobilization in vivo. To do this, we paired high-speed multicolor flow cytometric cell sorting with a recently described MS-based 3-D, RP-SAX-RP phosphoproteomic analysis platform.19,36 Fe-NTA IMAC was used to improve detection of phosphopeptides and minimize background, and isobaric stable isotope labels were used to enable sample multiplexing (Figure 1).
To validate this novel platform in a biological context, we per- formed a pilot study with 23105cells per condition, phosphoenriched and analyzed using our recently described 3-D liquid chromatography- MS/MS platform.19-21,36This was used to compare phosphoproteomic profiles generated from resting or pharmacologically mobilized LSK HSPCs harvested from the BM or spleen of C57BL/6 mice. Mobili- zation was induced using sequential administration of Cy and G-CSF (daily for 4 days), which elicits HSPC expansion in and then egress from the marrow, increasing the numbers of HSPCs in the blood, spleen, and liver.18,22In order to identify phosphorylation substrates associated with progenitor cell mobilization, we compared 23105BM HSPCs from untreated mice with an equal number of mobilized HSPCs isolated from the spleens of Cy/G-treated animals. When performed in biological triplicate, this analysis identified 3664 unique phosphopep- tide sequences present in all samples, representing 1954 distinct phosphoproteins (supplemental Table 1;“pilot”). Encouraged by these results, we performed 2 additional analyses in 6-plex format, each in biological triplicate. For additional coverage of the phosphoproteome, these phosphopeptides were analyzed on a higher-performance Orbitrap Fusion mass spectrometer23,37coupled to an improved version of our multidimensional fractionation platform.24,38,39In these analy- ses, we identified 12 323 and 12 168 unique phosphopeptide sequences present in all samples, representing 4001 and 3997 distinct phospho- proteins (supplemental Table 1;“first analysis”and“second analysis”).
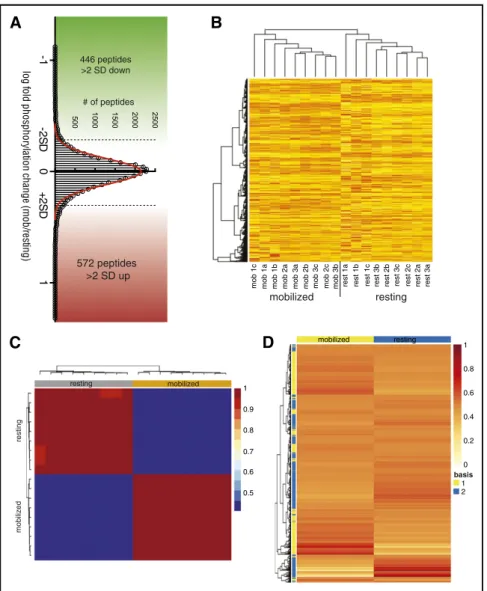
Across all 3 sets, 15 230 unique phosphopeptides and 4993 phospho- proteins were identified. The phosphopeptide ratios followed a normal distribution (Figure 2A). Overall, 1018 phosphopeptides differed in relative amount by.2 standard deviations (SD) between mobilized
and resting cells. Of these, 572 phosphopeptide species were.2 SD more abundant in mobilized HSPCs and 446 were.2 SD less abundant (Figure 2A; supplemental Table 1).
Hierarchical clustering analysis of data sets independently (not shown) or together (Figure 2B) demonstrated the existence of a durable phosphoproteomic signature of mobilization in primary HSPCs. To TMT-126 TMT-127 TMT-128 TMT-129
Mix
d-1 d-1 d-1 d4 d4 d4
TMT-130 TMT-131
O
O O
N O
O
O
Fe
LC-MS
DATA ANALYSIS
Desktop Environment Mascot .raw File
Excel
Fe3+-NTA IMAC Phosphopeptide Enrichment
Figure 1. Bioanalytical platform for quantitative interrogation of signaling pathways in HSPCs.
Two3105highly purified primary murine HSPCs were sorted by flow cytometry, lysed, and trypsin-digested, followed by Fe31NTA-IMAC phosphopeptide enrich- ment and isotope labeling with TMT reagents. Phos- phopeptides were quantified by fully automated 3-D RP-SAX-RP chromatography, coupled to a ThermoFisher Orbitrap mass spectrometer. Data analysis and visualiza- tion was performed using a combination ofmultiplierzand R scripts. LC-MS, liquid chromatography–MS.
identify the individual components of this signature, wefirst identified from each data set those proteins containing phosphopeptides signif- icantly different in abundance (with a Benjamini-Hochberg false discovery rate of q,0.1) between mobilized and resting HSPCs. At the protein level, 885 phosphoproteins exhibited statistically significant differences in phosphopeptide abundance in at least 1 data set, and 225 phosphoproteins exhibited statistically significant differences in at least 2 data sets (supplemental Table 2). To further identify in an unsuper- vised manner, which phosphosites contributed most significantly to the differences between resting and mobilized HSPCs, we used NMF25,40 to extract phosphoprotein residue signatures that could distinguish between the biologic subclasses in each independent experiment. This analysis defined two phosphopeptide clusters that efficiently distin- guished resting HSPCs from mobilized HSPCs (Figure 2C). Each group was then deconvoluted to generate contribution-weighted protein lists, or signatures, corresponding either to the mobilized or the resting state (Figure 2D; supplemental Table 3). These signatures were compared with the Benjamini-Hochberg–generated lists of differentially phosphorylated proteins to identify 178 phosphopro- teins likely to play an important role in mobilization (Figure 2D;
supplemental Tables 2 and 3). These data provide the most compre- hensive phosphoproteomic profile to date of HSPC mobilization, an aspect of HSPC biology that has not previously been extensively interrogated at the protein level.
Given the prominence of cytoskeletal features in the consensus phosphoproteomic profile of mobilized HSPCs and the importance of cytoskeletal rearrangement to motility,26,41,42we focused on proteins with cytoskeletal interactions. One protein that was highly differentially phosphorylated in mobilized and resting HSPCs was ARHGAP25, which has recently been described as a hematopoietically-expressed Rac-GAP that inactivates Rac, and inhibits monocyte and neutrophil phagocytosis.17,27,43Because the Rac GTPase has a well-described and central role in HSC mobilization and engraftment,42we reasoned that ARHGAP25 may play an important role in these processes.
ARHGAP25 regulates HSPC mobilization by strengthening CXCL12 signaling
A deficiency in ARHGAP25 function could be predicted to increase Rac activity, and previous studies have demonstrated that defective Rac activity in HSPCs results in poor homing and engraftment to the BM.42Thus, we hypothesized that an absence of ARHGAP25 func- tion might impede HSPC egress from the BM by enhancing Rac activity. To test the role of ARHGAP25 deficiency in mobilization, we obtained ARHGAP25-deficient mice from the KOMP. Indeed, althoughArhgap252/2mice have comparable BM and peripheral blood cell numbers to control mice at baseline, they have higher numbers of BM HSPCs and lower numbers of peripheral blood HSPCs at rest than
mobilized
mobilized
resting
resting
A B
C D
572 peptides
>2 SD up 446 peptides
>2 SD down
# of peptides
resting
resting
mobilized
mobilized 500 1000 1500 2000 2500
log fold phosphorylation change (mob/resting) mob 1c mob 3c mob 2cmob 1a mob 2a mob 3amob 1b mob 2b mob 3b rest 1a rest 1b rest 1c rest 3b rest 2b rest 3c rest 2c rest 2a rest 3a
1 0.8 0.6 0.4 0.2 1
0.9 0.8 0.7 0.6 0.5
0 1 basis
2
-101-2SD+2SD
Figure 2. Phosphoproteomic interrogation iden- tifies novel activated protein pathways in primary murine HSPCs.Resting BM (rest) or mobilized (mob) LSK HSPCs were harvested and sorted as described in
“Methods.” (A) Comprehensive phosphoproteomic anal- ysis of 23105primary murine resting or mobilized HSPCs was done in triplicate, and this experiment was repeated 3 times. In total, this analysis identified 15 230 unique phosphopeptides and 4993 phosphoproteins.
The phosphopeptide ratios followed a normal distri- bution and there was not a marked change in total phosphopeptide quantity with mobilization. Overall, 1018 phosphopeptides differed in relative amount by .2 SD between mobilized and resting cells. Of these, 572 phosphopeptide species were .2 SD more abundant in mobilized HSPCs (red), and 446 were.2 SD less abundant (green). Red trace shows Gaussian overlay. (B) Unsupervised hierarchical clustering anal- ysis of all 18 samples demonstrates that mobilization results in durable phosphoproteomic changes in pri- mary murine HSPCs. Mob1/rest1, mob2/rest2, and mob3/rest3 represent individual experiments; a, b, and c denote biological replicates within experiments. Sam- ple phosphoprofiles consistently clustered with other samples in their biologic subgroup (mobilized or resting) and away from samples in the other subgroup, con- firming the existence of a durable phosphoproteomic signature of mobilization. (C) NMF of data from all 3 ex- periments identifies two phosphoproteomic signatures that can be used to segregate mobilized from resting HSPCs. Using the nonsmooth NMF method of Pascual- Montano et al, 1250 iterations were run with a factor- ization rank of 2 to identify consensus clusters capable of segregating mobilized from resting phosphopro- files.26 Heatmap shows the degree of concordance between sample groups (top bars) and consensus profiles (left bars). (D) Signature phosphoprotein resi- dues were extracted and then filtered by featurescore to identify phosphoprotein residues most specific to each signature. A mixture expression profile heatmap, which summarizes the relative contribution of each signature to each sample was used to assign signatures, or metagroups (left), to the sample classes (top). A com- plete list of phosphoprotein residues in each metagroup is provided in supplemental Table 3.
controls, and this difference is maintained after pharmacologic mobi- lization (Figure 3A). Thus, ARHGAP25 deficiency results in defective mobilization of HSPCs. To test whether this effect relates to ARHGAP25 deficiency in the hematopoietic compartment specifically, we performed transplants ofArhgap252/2BM into lethally irradiated congenic mice. After allowing hematopoietic reconstitution for 16 weeks, recipients were analyzed. As was seen in whole-body knockouts, mice lacking ARHGAP25 in the hematopoietic compartment only showed increased numbers of HSPCs in the BM and decreased numbers in the peripheral blood (Figure 3B). Transplant recipients reconstitute with lower and more variable numbers of BM and circulating HSPCs than untransplanted counterparts44-46 (compare Figure 3B and 3A), making analysis of peripheral blood LSK populations in reconstituted mice technically challenging. However, a trend was observed toward defective mobilization after stimulation with Cy and G-CSF in mice transplanted with Arhgap252/2 BM as compared with mice trans- planted with WT BM (Figure 3B). Taken together, these data indicate that ARHGAP25 activity is important for regulating both physiologic and pharmacologically induced HSPC mobilization.
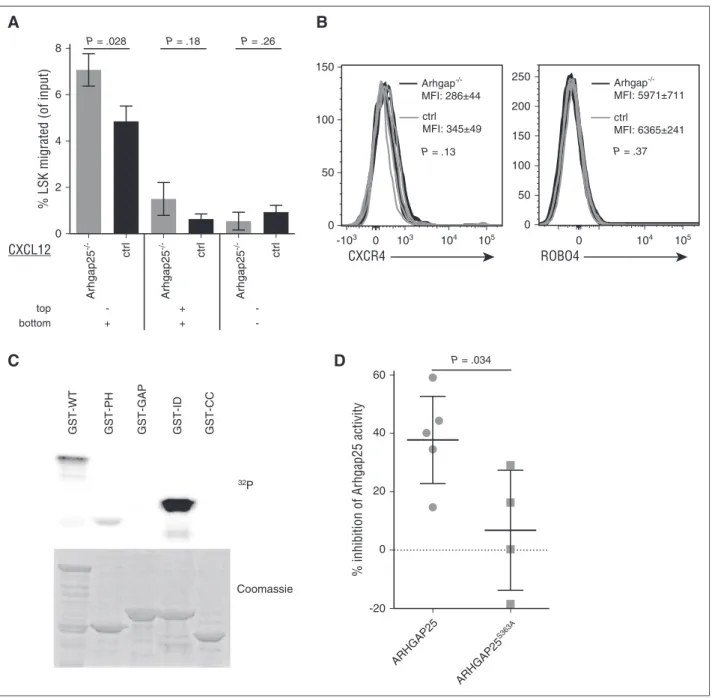
The CXCL12-CXCR4 interaction is central to BM retention of HSPCs,33,47,48and CXCL12 signaling is known both to activate Rac and recruit it to the cell membrane, thereby facilitating chemotaxis.49-51 We therefore reasoned thatArhgap252/2HSPCs might exhibit increased responsiveness to CXCL12 signaling as compared with WT HSPCs. We confirmed that Arhgap252/2 LSK cells exhibited more effective chemotaxis to a CXCL12 gradient than their WT counterparts in a
transwell migration assay (Figure 4A). To verify that this effect was not a result of increased CXCL12 receptor density on HSPCs, we evaluated the expression of CXCR4, which is the primary ligand for CXCL12.48,52 Cell-surface expression of CXCR4 onArhgap252/2and control HSPCs was not significantly different, either at baseline (MFI of CXCR4 onArhgap252/2HSPCs, 286644; MFI on control HSPCs, 345649;
P5.13) or after CXCL12 stimulation (MFIArhgap252/2, 226612;
MFI control, 4126142;P5.08) (n58 mice for each condition;
Figure 4B). There also was no significant difference in surface expression of the alternate CXCL12 receptor ROBO4 by flow cytometric analysis (MFI, 63656241 forArhgap252/2HSPCs vs MFI, 59716711 for control HSPCs;P5.37) (n54 mice for each condition). These findings indicate that ARHGAP25 deficiency affects HSPC mobilization not by altering expression of CXCL12- binding receptors, but by strengthening BM CXCL12-mediated retention signals, presumably through increased Rac activation.
Phosphorylation of ARHGAP25 at S363 regulates its function We next sought to identify the mechanism through which ARHGAP25 influences Rac activity and, thereby, HSPC mobilization. ARHGAP25 has 3 known functional domains: a PH domain, a GAP domain, and a CC domain; it also possesses a 200-amino acid ID of unknown func- tion located between its GAP domain and its CC domain.16The vast majority of phosphorylation events, both in our screen (Figure 4C) and in the literature,53.54occur in the ID region of Arghap25 and are of RESTING
RESTING
A
B
0.2 0.3 0.4 0.5 0.6 0.7
P = .0003
MARROW
LSK cells (% of live)
Arhgap25-/- ctrl
P = .03
LSK cells (% of live)
MARROW Arhgap25-/- ctrl 0.0
0.1 0.2 0.3 0.4 0.5
0 0.02 0.04 0.06 0.08
BLOOD
P = .0481
P = .028 Arhgap25-/- ctrl
BLOOD Arhgap25-/- ctrl 0.000
0.005 0.010 0.015 0.020 0.025
MOBILIZED
P = .0486
BLOOD Arhgap25-/- ctrl
BLOOD Arhgap25-/- ctrl
MOBILIZED
P = .23 0.0
0.2 0.4 0.6
0.0 0.1 0.2 0.3
Figure 3. ARHGAP25 deficiency in HSPCs leads to defects in mobilization.Arhgap252/2mice, obtained from KOMP, were confirmed at the DNA and protein level to be deficient in ARHGAP25 protein (not shown).
(A) Mice lacking ARHGAP25 had significantly higher percentages of LSK HSPCs in their BM than controls (left), and lower proportions of HSPCs in their peripheral blood (center), suggesting increased central compart- mentalization. This continued to be true after mobilization with Cy/G (right), indicating that ARHGAP25 is required for optimal mobilization. Each dot represents an individ- ual mouse. (B) To confirm that this finding is due to intrinsic activity of ARHGAP25 in hematopoietic cells, Arhgap252/2BM was transplanted into lethally irradiated recipient mice. After 16 weeks of hematopoietic recon- stitution, recipients ofArhgap252/2marrow were found to have increased percentages of LSK cells in the BM (left) and decreased percentages in the peripheral blood (center), demonstrating that ARHGAP25 function is in- trinsic to the hematopoietic system in this context. After Cy/G treatment, diminished mobilization was again seen in recipients ofArhgap252/2marrow as compared with controls (right). These differences did not reach statistical significance, however, in part because recipients of control marrow reproducibly mobilized far less well than unmanipulated WT mice. Each dot represents an individual mouse. ctrl, control.
unknown functional significance. Our phosphoproteomic analyses consistently showed statistically significant increased phosphorylation of ARHGAP25 on S363 in resting HSPCs. In contrast, other phospho- residues in ARHGAP25 were not increased (supplemental Table 1), suggesting that S363 phosphorylation is specific and may be functionally significant. Because ARHGAP25 function augments HSPC mobiliza- tion, and ARHGAP25 deficiency promotes BM retention, we surmised that phosphorylation of S363 would negatively regulate ARHGAP25
function. To test this notion, we created a nonphosphorylatable single amino acid mutant (S→A) of S363 and expressed this construct as a GST-fusion protein. Exposure of ARHGAP25-GST fusion proteins to neutrophil cytosolic extract resulted in significant phosphoryla- tion in the ID region (Figure 4C). However, in contrast to WT ARHGAP25, which manifested a 38% decrease in Rac inactivation upon phosphorylation with neutrophil cytosol, ARHGAP25S363A inhibition of Rac activity was not significantly altered by treatment with 0
2 4 6 8
% LSK migrated (of input)
A
CXCL12
bottom top
+ -
+ +
- -
Arhgap25-/- ctrl Arhgap25-/- ctrl Arhgap25-/- ctrl
P = .028 P = .18 P = .26
D
P = .034ARHGAP25
ARHGAP25
S363A
-20 0 20 40 60
% inhibition of Arhgap25 activity
C
Coomassie
32P
GST-WT GST-PH GST-GAP GST-ID GST-CC
0
-103 103 104 105 0
50 100 150
B
CXCR4
Arhgap-/- MFI: 286±44 ctrl MFI: 345±49 P = .13
ROBO4
0 104 105
0 50 100 150 200
250 Arhgap-/-
MFI: 5971±711 ctrl
MFI: 6365±241 P = .37
Figure 4. ARHGAP25 moderates CXCL12 signaling and is functionally affected by phosphorylation.(A) ARHGAP25 deficiency strengthens HSPC response to a CXCL12 gradient. HSPCs fromArhgap252/2or control mice were placed in the top wells of a transwell apparatus with CXCL12 in the bottom well (left), both wells (center), or neither well (right). After 1 hour, transmembrane migration was assessed by flow cytometry as described in “Methods.”Arhgap252/2HSPCs showed markedly increased migration across a membrane in response to a CXCL12 gradient (left), but not in the absence of a gradient (center, right). Results shown are representative of 3 independent experiments. (B)Arhgap252/2HSPCs were stained with antibodies to CXCL12 receptors to confirm that the augmented response to CXCL12 inArhgap252/2HSPCs was not due to increased cell surface expression of CXCR4 or ROBO4. Shown are representative overlay histograms of CXCR4 (left) or ROBO4 (right) expression onArhgap252/2 LSKs (black traces) as compared with control LSKs (gray traces). MFIs and SDs are shown, as well asPvalue. N54 for each condition in this experiment, which was performed in triplicate. (C) Phosphorylation of GST-fused full-length (GST-WT) ARHGAP25 and its truncated fragments. Phosphorylation was performed using radiolabeled ATP and neutrophil cytosol as a kinase source, as described in “Methods.” Marked phosphorylation was observed in the full-length protein as well as in the PH and ID regions, whereas phosphorylation of GAP and CC domains was undetectable. (D) Mutation of S363 affects the ability of phosphorylated ARHGAP25 to inactivate Rac. GST-WT ARHGAP25 and GST-mutant (S363A) ARHGAP25 protein were phosphorylated with neutrophil cytosol and nonradiolabeled ATP. GTPase activation effect was measured 5 minutes after co-incubation with GST-Rac by nitrocellulose filter binding assay, as described in “Methods.” ctrl, control; MFI, mean fluorescence intensity.
neutrophil cytosol (Figure 4D). Thus, phosphorylation of ARHGAP25 at S363 suppresses its ability to act as a GAP for Rac (Figure 4D).
Discussion
Protein phosphorylation occurs on more than one-third of all proteins,55 and is the dominant activity modifying posttranslational modification in blood cells.13,14Protein-level determinants of function are poorly reflected in genomic and transcriptional analyses,7,8so protein-focused interrogations are critical to our understanding of cellular biology.
HSPCs are rare, and understanding their phosphoprotein landscape has been hindered by the inability to perform comprehensive analyses from small numbers of cells. We describe a novel strategy for combining flow cytometric enrichment of rare HSPCs with highly efficient, multidimensional MS to discover new protein signaling pathways important in HSPC function.
The platform described here provides a new discovery tool for proteomic pathways. This platform expands the accessible proteomic space beyond that available through candidate-based strategies such as cytometry by time-of-flight (CyTOF)56and reverse phase protein array analysis.57Although both CyTOF and reverse phase protein array anal- ysis are powerful tools, with CyTOF providing single-cell resolution to pathway regulation,11,58these technologies can only interrogate known targets. In contrast, our platform evaluates both known and unknown pathways at a level of phosphoproteome coverage superior to prior MS-based technologies.12
Application of our platform to primary murine HSPCs identified the Rac-GAP ARHGAP25 as a regulator of HSPC mobilization and spe- cifically nominated phosphorylation of S363 as a biologically relevant modulator of ARHGAP25 activity. Subsequent validation studies confirmed that the phosphorylation status of ARHGAP25 on S363 is critical, because maintenance of S363 in an unphosphorylated state is required for ARHGAP25’s GAP activity. Furthermore, phosphorylation of S363 inhibits the ability of ARHGAP25 to suppress Rac-dependent downstream functions. Moreover, we demonstrate that inhibition of ARHGAP25 activity leads to an augmentation of CXCL12 signaling.
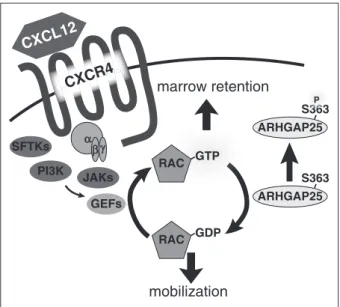
Taken together, our results identify phosphorylation of ARH- GAP25 on S363 as an important modulator of HSPC mobilization, and suggest a new candidate to target for improving stem cell mobilization (Figure 5).
Our platform was designed to identify phosphorylation events that reflect differences in cell state, in contrast to the faster and more transient phosphorylation events observed in conventional cellular receptor signaling.55,59-61Indeed, the HSPCs we profiled were harvested from mice 16 hours after their last G-CSF treatment. This may explain why our screens did not robustly identify phosphorylation events immediately downstream of G-CSF signaling, or events imme- diately downregulated by decreased signaling through known HSPC tethering interactions such as CXCR4, VLA-4, or c-Kit.62,63 However, our platform could easily be modified to capture such events, and stimulation-response time-courses are being explored in other contexts.
It is also important to note that all of our experiments to date employed the C57BL/6 mouse line, using a particular mobilization regimen. Because different strains of mice have significantly varied responses to different mobilizing stimuli,64,65it will be of interest in the future to interrogate other mouse strains and mobilization regimens using this platform, which could help to explain interstrain and interagent differences in mobilization responses. Moreover, we expect that this platform will be useful in mapping important activated phosphoprotein pathways in benign and malignant HSPCs in humans, and that it will help to identify attractive targets for therapeutic intervention in patients.
Acknowledgments
The authors thank Girijesh Buruzula, Joyce LaVecchio, Angela Wood, Joseph Card, Jacobo Ramirez, and Elsa Lindhe for their technical support, and Tata Nageswara Rao, Chad Harris, Mathilde Gavillet, Serena de Vita, and Magdolna L´evay for valuable discussions and the generation of preliminary data relevant to this publication.
This study was supported by a Damon Runyon-Sohn Foundation Cancer Research Fellowship (DSRG 02-12), an Alex’s Lemonade Stand Foundation Young Investigator Award (31582), a St. Baldrick’s Foundation Scholar Award (243625) (L.D.W.), and grants from the Hungarian Research Fund (OTKA K108382) (E.L.), the NIH (National Heart, Lung, and Blood Institute R01HL088582 and National Institute of Diabetes and Digestive and Kidney Diseases P30DK036836 [A.J.W.], and National Cancer Institute R21CA188881 and R21CA178860 [J.A.M.]), and the Dana-Farber Strategic Research Initiative (J.A.M.). Grants from the NIH National Human Genome Research Institute to Velocigene at Regeneron Inc. (U01HG004085) and the CSD Consortium (U01HG004080) funded the generation of targeted embryonic stem cells for 8500 genes in the KOMP program archived/distributed by the KOMP Repository (UC Davis and Children’s Hospital Oakland Research Institute, U42RR024244, National Center for Research Resources). J.N.H. was partially supported by funding from the Harvard Stem Cell Institute through the Center for Stem Cell Bioinformatics.
Authorship
Contribution: L.D.W. and A.J.W. conceived of the project; L.D.W., S.B.F., and J.N.H. designed and performed experiments, interpreted CXCL12
CXCR4
αβ γ PI3K SFTKs
JAKs
ARHGAP25
RAC RAC GTP
GDP GEFs
mobilization marrow retention
S363 ARHGAP25
S363 S3636363636363636 SP3333
Figure 5. Model of ARHGAP25 function.ARHGAP25 opposes CXCL12-CXCR4 signaling, promoting mobilization by converting GTP(active)-Rac to GDP(inactive)- Rac. Phosphorylation of ARHGAP25 on S363 inhibits its ability to inactivate Rac.
GDP, guanosine diphosphate; GEF, guanine nucleotide exchange factor; PI3K, phosphatidylinositol 3-kinase; SFTK, Src family tyrosine kinase.
data, and wrote and edited the manuscript; P.T.N., R.C.-K., E.W., and J.S. designed and performed experiments and interpreted data;
O.H. oversaw bioinformatics analysis; and E.L., J.A.M., and A.J.W.
designed experiments, interpreted data, and edited the manuscript.
Conflict-of-interest disclosure: L.D.W. has been a consultant for Magenta Therapeutics within the last year. The remaining authors declare no competingfinancial interests.
ORCID profiles: L.D.W., 0000-0002-2945-9005; R.C.-K., 0000- 0001-6825-7142; O.H., 0000-0002-7738-1513; E.L., 0000-0001- 6374-729X.
Correspondence: Leo D. Wang, Dana-Farber Cancer Institute, 450 Brookline Ave, JFC, Dana 3, Boston, MA 02215; e-mail: leo.wang@
childrens.harvard.edu; and Amy J. Wagers, Joslin Diabetes Center, 1 Joslin Pl, Boston, MA 02215; e-mail: amy_wagers@harvard.edu.
References
1. Pronk CJH, Rossi DJ, M ˚ansson R, et al.
Elucidation of the phenotypic, functional, and molecular topography of a myeloerythroid progenitor cell hierarchy.Cell Stem Cell.2007;
1(4):428-442.
2. Rossi DJ, Bryder D, Zahn JM, et al. Cell intrinsic alterations underlie hematopoietic stem cell aging.
Proc Natl Acad Sci USA.2005;102(26):
9194-9199.
3. Forsberg EC, Passegu ´e E, Prohaska SS, et al.
Molecular signatures of quiescent, mobilized and leukemia-initiating hematopoietic stem cells.
PLoS One.2010;5(1):e8785.
4. Sun D, Luo M, Jeong M, et al. Epigenomic profiling of young and aged HSCs reveals concerted changes during aging that reinforce self-renewal.Cell Stem Cell.2014;14(5):673-688.
5. Beerman I, Bock C, Garrison BS, et al.
Proliferation-dependent alterations of the DNA methylation landscape underlie hematopoietic stem cell aging.Cell Stem Cell.2013;12(4):
413-425.
6. Vedi A, Santoro A, Dunant CF, Dick JE, Laurenti E. Molecular landscapes of human hematopoietic stem cells in health and leukemia.Ann NY Acad Sci.2016;1370(1):5-14.
7. Petit I, Szyper-Kravitz M, Nagler A, et al. G-CSF induces stem cell mobilization by decreasing bone marrow SDF-1 and up-regulating CXCR4.Nat Immunol.2002;3(7):687-694.
8. Lu R, Markowetz F, Unwin RD, et al. Systems- level dynamic analyses of fate change in murine embryonic stem cells.Nature.2009;462(7271):
358-362.
9. Kornblau SM, Qutub A, Yao H, et al. Proteomic profiling identifies distinct protein patterns in acute myelogenous leukemia CD341CD38- stem-like cells.PLoS One.2013;8(10):e78453.
10. Gibbs KD Jr, Gilbert PM, Sachs K, et al. Single- cell phospho-specific flow cytometric analysis demonstrates biochemical and functional heterogeneity in human hematopoietic stem and progenitor compartments.Blood.2011;117(16):
4226-4233.
11. Bendall SC, Simonds EF, Qiu P, et al. Single-cell mass cytometry of differential immune and drug responses across a human hematopoietic continuum.Science.2011;332(6030):687-696.
12. Cabezas-Wallscheid N, Klimmeck D, Hansson J, et al. Identification of regulatory networks in HSCs and their immediate progeny via integrated proteome, transcriptome, and DNA methylome analysis.Cell Stem Cell.2014;15(4):507-522.
13. Warr MR, Pietras EM, Passegu ´e E. Mechanisms controlling hematopoietic stem cell functions during normal hematopoiesis and hematological malignancies.Wiley Interdiscip Rev Syst Biol Med.2011;3(6):681-701.
14. Kim AD, Stachura DL, Traver D. Cell signaling pathways involved in hematopoietic stem cell specification.Exp Cell Res.2014;329(2):227-233.
15. Unwin RD, Smith DL, Blinco D, et al. Quantitative proteomics reveals posttranslational control as a regulatory factor in primary hematopoietic stem cells.Blood.2006;107(12):4687-4694.
16. Katoh M, Katoh M. Identification and characterization of ARHGAP24 and ARHGAP25 genes in silico.Int J Mol Med.2004;14(2):
333-338.
17. Cs ´ep ´anyi-K ¨omi R, Sirokm ´any G, Geiszt M, Ligeti E. ARHGAP25, a novel Rac GTPase-activating protein, regulates phagocytosis in human neutrophilic granulocytes.Blood.2012;119(2):
573-582.
18. Morrison SJ, Wright DE, Weissman IL.
Cyclophosphamide/granulocyte colony- stimulating factor induces hematopoietic stem cells to proliferate prior to mobilization.Proc Natl Acad Sci USA.1997;94(5):1908-1913.
19. Ficarro SB, Zhang Y, Carrasco-Alfonso MJ, et al.
Online nanoflow multidimensional fractionation for high efficiency phosphopeptide analysis.Mol Cell Proteomics.2011;10(11):O111.011064.
20. Askenazi M, Parikh JR, Marto JA. mzAPI: a new strategy for efficiently sharing mass spectrometry data.Nat Methods.2009;6(4):240-241.
21. Parikh JR, Askenazi M, Ficarro SB, et al.
multiplierz: an extensible API based desktop environment for proteomics data analysis.BMC Bioinformatics.2009;10(1):364.
22. Zhang Y, Askenazi M, Jiang J, Luckey CJ, Griffin JD, Marto JA. A robust error model for iTRAQ quantification reveals divergent signaling between oncogenic FLT3 mutants in acute myeloid leukemia.Mol Cell Proteomics.2010;9(5):
780-790.
23. Robinson MD, McCarthy DJ, Smyth GK. edgeR: a Bioconductor package for differential expression analysis of digital gene expression data.
Bioinformatics.2010;26(1):139-140.
24. Risso D, Ngai J, Speed TP, Dudoit S.
Normalization of RNA-seq data using factor analysis of control genes or samples.Nat Biotechnol.2014;32(9):896-902.
25. Gaujoux R, Seoighe C. A flexible R package for nonnegative matrix factorization.BMC Bioinformatics.2010;11(1):367.
26. Pascual-Montano A, Carazo JM, Kochi K, Lehmann D, Pascual-Marqui RD. Nonsmooth nonnegative matrix factorization (nsNMF).IEEE Trans Pattern Anal Mach Intell.2006;28(3):
403-415.
27. Kim H, Park H. Sparse non-negative matrix factorizations via alternating non-negativity- constrained least squares for microarray data analysis.Bioinformatics.2007;23(12):1495-1502.
28. National Institutes of Health. UC Davis KOMP repository: Knockout Mouse Project. Available at:
https://www.komp.org/. Accessed May 1, 2016.
29. Bl ¨uml S, Rosc B, Lorincz A, et al. The oxidation state of phospholipids controls the oxidative burst in neutrophil granulocytes.J Immunol.2008;
181(6):4347-4353.
30. Wang LD, Wagers AJ. Dynamic niches in the origination and differentiation of haematopoietic stem cells.Nat Rev Mol Cell Biol.2011;12(10):
643-655.
31. Mendelson A, Frenette PS. Hematopoietic stem cell niche maintenance during homeostasis and regeneration.Nat Med.2014;20(8):833-846.
32. Ratajczak MZ. A novel view of the adult bone marrow stem cell hierarchy and stem cell trafficking.Leukemia.2015;29(4):776-782.
33. Mazo IB, Massberg S, von Andrian UH.
Hematopoietic stem and progenitor cell trafficking.
Trends Immunol.2011;32(10):493-503.
34. Wright DE, Wagers AJ, Gulati AP, Johnson FL, Weissman IL. Physiological migration of hematopoietic stem and progenitor cells.Science.
2001;294(5548):1933-1936.
35. Massberg S, Schaerli P, Knezevic-Maramica I, et al. Immunosurveillance by hematopoietic progenitor cells trafficking through blood, lymph, and peripheral tissues.Cell.2007;131(5):
994-1008.
36. Zhou F, Sikorski TW, Ficarro SB, Webber JT, Marto JA. Online nanoflow reversed phase-strong anion exchange-reversed phase liquid chromatography-tandem mass spectrometry platform for efficient and in-depth proteome sequence analysis of complex organisms.
Anal Chem.2011;83(18):6996-7005.
37. Senko MW, Remes PM, Canterbury JD, et al.
Novel parallelized quadrupole/linear ion trap/
Orbitrap tribrid mass spectrometer improving proteome coverage and peptide identification rates.Anal Chem.2013;85(24):11710-11714.
38. Zhou F, Lu Y, Ficarro SB, et al. Genome-scale proteome quantification by DEEP SEQ mass spectrometry.Nat Commun.2013;4:2171.
39. Zhou F, Lu Y, Ficarro SB, Webber JT, Marto JA.
Nanoflow low pressure high peak capacity single dimension LC-MS/MS platform for high- throughput, in-depth analysis of mammalian proteomes.Anal Chem.2012;84(11):5133-5139.
40. Brunet J-P, Tamayo P, Golub TR, Mesirov JP.
Metagenes and molecular pattern discovery using matrix factorization.Proc Natl Acad Sci USA.
2004;101(12):4164-4169.
41. Shin J-W, Swift J, Ivanovska I, Spinler KR, Buxboim A, Discher DE. Mechanobiology of bone marrow stem cells: from myosin-II forces to compliance of matrix and nucleus in cell forms and fates.Differentiation.2013;86(3):77-86.
42. Cancelas JA, Jansen M, Williams DA. The role of chemokine activation of Rac GTPases in hematopoietic stem cell marrow homing, retention, and peripheral mobilization.Exp Hematol.2006;34(8):976-985.
43. Schlam D, Bagshaw RD, Freeman SA, et al.
Phosphoinositide 3-kinase enables phagocytosis of large particles by terminating actin assembly through Rac/Cdc42 GTPase-activating proteins.
Nat Commun.2015;6:8623.
44. Holmfeldt P, Ganuza M, Marathe H, et al.
Functional screen identifies regulators of murine hematopoietic stem cell repopulation.J Exp Med.
2016;213(3):433-449.
45. Eaves CJ. Hematopoietic stem cells: concepts, definitions, and the new reality.Blood.2015;
125(17):2605-2613.
46. Iscove NN, Nawa K. Hematopoietic stem cells expand during serial transplantation in vivo without apparent exhaustion.Curr Biol.1997;
7(10):805-808.