DOI: 10.1556/606.2018.13.2.17 Vol. 13, No. 2, pp. 173–183 (2018) www.akademiai.com
AUTOMATIC SELECTION OF POTENTIAL WWII BOMBED AREAS BY USING SPATIAL DATA
1 Attila JUHÁSZ, 2 Hajnalka NEUBERGER
1,2 Department of Photogrammetry and Geoinformatics, Faculty of Civil Engineering Budapest University of Technology and Economics, Műegyetem rkp. 3, H-1111 Budapest
Hungary, e-mail: 1juhasz.attila@epito.bme.hu, 2neuberger.hajnalka@epito.bme.hu Received 12 November 2017; accepted 19 March 2018
Abstract: The reconstruction of military defense systems, (e.g. World War II defense lines) is generally based on military object identification and mapping. Since unexploded bombs can be still dangerous today, detecting bomb craters can be useful in creating hazard maps. The most significant problem is managing the large amount of relevant data. Therefore, there is a strong demand for automatically select the potential danger zones and also automate the entire processing workflow. Automatic methods have been developed to reduce the areas of interest. In addition, this method can be applied in other tasks as well, for example in settlement detection.
Keywords: Light detection and ranging, Geoinformatics, Military history, Digital image analysis
1. Introduction
The detection and the identification of military objects is the most important issue in military defense systems (lines) reconstruction. The major task is to search for bomb craters, which has basically two aims. First, if large number of craters is identified in a particular area, there might be some kind of military object, so the reconstruction can be improved accordingly. Second, a risk map and database can be created, based on the location of detected craters [1]. A significant part of the bombs was not exploded during the war (approximately 10-15%), so they are still a serious threat e.g. during constructions [2]. Since 1974, sappers deactivated more than 5 million explosives, just in Hungary (including ammunition with expired warranties). The number of bombs is only 1-2% of the total, but their significance is obviously highest.
Although the investigation has been carried out mostly in rural areas - where construction is less common - the resulted risk map can be very useful. Besides, mapping of the craters can also be the base of a Geographical Information System (GIS) database, as it has been created in the case of London [3]. In this interactive database, all of the German bombs, dropped between 7th October 1940 and 6th June 1941 over London, have been mapped and parallel, large number of historical images and people’s stories relating to the bombed areas have been collected. The significant part of the bombs was dropped on settlements, and industry zones and these were rebuilt after the war. There is no chance to identify craters and unexploded bombs in these areas on recent remotely sensed data, only archive aerial photographs can be used in this case (Fig. 1). After the war the settlements and the agricultural areas were grown dynamically, therefore currently detecting craters and other military objects could be found only in forested areas or parklands. Lots of these areas were existed also during the war; moreover, troops frequently applied these locations for hiding.
Fig. 1. Bombed area on archive aerial photograph [4]
Despite the decades-long history of archive image interpretation, there are still several difficulties, which cause inefficiency. Hundreds of archive aerial photographs were investigated during some of the Hungarian World War II (WW II.) defense lines reconstruction [5]. The objects’ shadows, the clouds and the poor quality of the archive images are the major factors of uncertainty, but the use of Digital Terrain Model (DTM) could eliminate these weaknesses.
Nowadays the situation has changed radically. There are more and more solutions to produce or process even 3 dimensional data [6], [7]. The Light Detection and Ranging (LiDAR) data basis is one of the most significant sources, which can be effectively applied in several engineer applications [8], for example creating 3D city models or even estimate solar energy production based on roof models [9]. The Airborne Laser Scanning (ALS) created the possibility of gathering high resolution elevation data and deriving precise DTMs. It can be used to detect, identify and reconstruct World War II military objects that are still recognizable until now even in forested areas [10], [11].
For mapping them semi-, and full automatic methods were developed based on digital image analysis [11]. The algorithms work very efficiently if there is any military object in the investigated area.
Since the investigation of a nationwide used LiDAR database (if it would exist at all) needs so much time and computational resources, therefore the next important step forward is to reduce the area of interest, i.e. the potential areas where these objects can be found. Recently, after decades of World War II, it is still relatively easy to select the potential areas that are worth to examine. In this paper an automated potential area selection method is presented, using freely accessible German LiDAR data.
2. Data sources and materials
In this chapter the freely accessible data sources will be reviewed that have been applied in this research. Recently, the use of various collaborative applications, community and social media, open source software and databases has become general.
This change can also be observed in case of the spatial data (e.g. Open Street Map (OSM), Natural Earth Data, Esri Open Data). Before the detailed presentation of these databases, it is important to compare the open source and freely accessible applications and databases to the commercial ones (Table I).
Table I
The advantages of the open source and the commercial software and databases Software
Open source Commercial
• Free or affordable
• Free to use with minimal legal and technical constrains
• Adaptation and development is on demand
• Community control
• Quick repair and tracking
• Broader functionality
• Professional documentation and support
• Warranty
• User friendly and compact interface
Spatial database
Open source Commercial
• Free to use
• Up-to-date
• Metadata is available
• Homogeneous quality
Open street map
The OSM is a collaborative project to create a free editable and usable map of the world. The project is based on the users’ measurements and local knowledge, government and business data. The registered users can apply satellite images, Global Navigation Satellite System (GNSS) tools and maps to ensure the accuracy and to keep the OSM up-to-date [12]. In addition, OSM can be combined with LiDAR data for updating Digital Elevation Models (DEM) [13]. As usual, this vector map stores the different map elements (point, line and polygon features) on layers [14].
Digital geodata North Rhine-Westphalia
Recently, in several Western European countries, for example in UK different maps and GIS data are freely accessible (or have a minimal fee) [15]. This kind of solution seems entirely logical, examining the cost of data production, the budgets of the organizations concerned, and the proportion of the sums received from these data (~0.03%). Considering the research topic and the department’s international relationships, German sample areas have been chosen for investigation. The North Rhine-Westphalia (OpenNRW) webpage. It offers online download links for hundreds of gigabytes of open LiDAR and other geospatial data for the entire state [16].
The major task is to detect the approximately 10 meters wide bomb craters or crater groups. Since the total area of the state is about 34.000 km2 and the size of the selected sample area, Emmerich am Rhein is still about 146 km2 (Fig. 2), the manual search would be really slow and complicated. To avoid it, there is necessary a process that is feasible to select the potential areas of interest, then to detect the relevant military object or its traces (fire-trenches, bomb craters, anti-tank ditches).
Fig. 2. The sample area (Google Earth)
There are some positive initiatives to use LiDAR data nationwide in the future as topographic core data [17]. From 2015 Geiger mode LiDAR data is also available for commercial use, which can produce more accurate and denser point clouds much faster (even 1000 km2/hour) than the conventional linear LiDAR [18]. Hopefully LiDAR data will be soon freely accessible also in Hungary, so a particular map of the Hungarian WW II defense system could be created. That is one of the main motivations of this research.
3. Methodology
During the war, a huge number of bombs were dropped by the fighting countries. On one hand, the enemy’s heartland, infrastructure and the concentration of troops were attacked. On the other hand, the bombers were also fighting directly on the battlefields.
There were different sized bombs and, in addition, the artillery shells could result similar craters. Thus, at the beginning of the procedure development the typical crater size had to be defined.
The selection of the potential areas was executed in ArcGIS environment, in which the Model Builder (MB) can be used for automatically and feasibly creating own toolboxes. In this application the models are workflows that string together sequences of geo-processing tools [19]. This is an effective solution to execute a procedure several times without any interaction, which has been developed and tested earlier.
The original data could not be processed, because of their size and format, therefore pre-processing steps were carried out. The LiDAR files, which covered 1x1 km areas and the OSM data of a single state were downloaded. The LiDAR data were in ASCII
*.xyz format, they were transformed into the binary *.laz files by using LAStools to decreased the files’ sizes radically [20]. The basic tiles (in vector format) for the further process were derived from the LiDAR header files and the ‘forest’ layer was selected from the OSM layers. Universal Transverse Mercator (UTM) reference system originated from the LiDAR data was accepted.
The prepared data enabled automated process, which steps in the model builder are as follows:
‒ an iterator was used to process all of the files one after the other;
‒ intersection of the original ‘forest’ vector layer and the basic tiles;
‒ elimination of the possibly produced empty tiles (containing no trees);
‒ reduce the tiles sizes according to the forest areas (minimum bounding boxes);
‒ calculating the forested areas’ morphometric parameters (size and shape);
‒ elimination of the areas, where craters cannot be found with high probability, based on morphological parameters;
‒ creating mask (representing areas of interest) with vector-raster conversion.
To increase the procedure’s efficiency, the sample area was investigated as 146 pieces of 1 km2 tiles and 584 pieces of 0.25 km2 tiles in parallel. In the first case, there are 5 million points in a LiDAR file and it causes serious processing problems. In the second case the files contain about 1.5 million points, which makes the point cloud managing easier. Moreover, ArcGIS can manage maximum 200 - 500 MB LiDAR data [21] and based on experiences, the LAStools’ free process, is limited to 1.5 million points [22].
As the areas of interest were elaborated, the second major part of the investigation - the bomb crater detection and identification - can be executed. The developed procedure based on local elevation differences and selects the potential bomb craters by calculating their depths and morphometric parameters [23].
As an overall issue, the general optimization of the procedure was examined and several aspects were considered:
‒ reducing the amount of data processed simultaneously and in total;
‒ processing several smaller or less larger files;
‒ eliminate the unnecessary data and files;
‒ consequences of the raster-vector conversion;
‒ minimizing the number of the applied software, and using the most capable one;
‒ minimizing human interaction;
‒ reducing total runtime.
4. Results
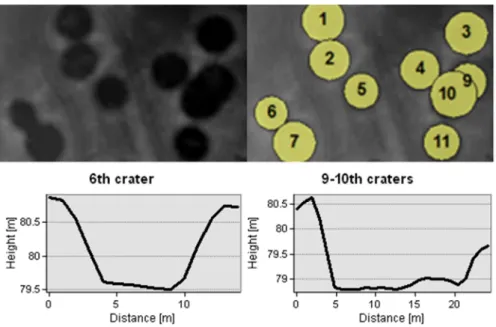
The typical size of the craters had to be defined in the selected area, which was determined as 8-15 meters (Fig. 3). If the procedure works, further craters can be identified with the changes of the parameters.
Fig. 3. Typical craters and cross-sections in the examined area
The major steps of the development are shown in Table II. Initial tile sizes are represented in the second column. The next two columns consists the number of the files to be processed and the percentage of the processed mask areas, compared to the original value. The ratio of the original and the remained forest areas are shown in the 4th column, where the goal was to achieve maximum 1% area loss. Finally, the useful parts of the mask are presented (percentage of the forested areas in the masks), the aim was to reach the greatest value in this case.
Table II
The result of the examinations
Steps
Base tile’s size (m)
Number of
files Area (%) Forested area (%)
Useful mask area
(%)
Original 1000 146 100.0000 100.0000 6.2840
RemoveEmpty 1000 103 70.5481 100.0000 8.9074
RemoveEmptyv 1000 103 30.2746 99.9956 20.7550
Area300width10 1000 100 29.5117 99.6930 21.2280
Small25 1000 99 29.1780 99.6917 21.4705
Small100 1000 99 29.0175 99.6843 21.5874
Small200 1000 96 29.0016 99.6679 21.596
Original 500 584 100.0000 100.0000 6.25388
RemoveEmpty 500 262 44.5663 100.0000 14.0327
RemoveEmptyv 500 262 18.5611 99.9872 33.6892
Area300width10 500 254 18.2401 99.6857 34.1786
Small25 500 251 18.1197 99.6835 34.4050
Small100 500 247 17.9635 99.6701 34.6996
Small200 500 243 17.8990 99.6482 34.8169
Both of the initial tile sizes were investigated during the development. Using smaller tiles, by only eliminating the empty ones (RemoveEmpty), significantly decrease the area of interest (from 70% to 45% of the original areas). Consequently, the increase of the grid density results only 2.5 times more files to be processed. The efficiency can be improved with using the minimum bounding boxes (RemoveEmptyv) of the remained forested areas as a mask, instead of applying the square grid (RemoveEmpty).
Considering the forthcoming image analyzing steps, these minimum bounding boxes must be normally oriented. The size of the relevant areas was halved independently from the tile sizes during this process. The ‘Area300Width10’ step shows the result of the procedure, where all areas smaller than 300 m2 or thinner than 10 meters were deleted. After this step only minor changes can be observed in the results.
The forested areas can be split into separated parts because of the tiled files. In many times only a few pixels remain in the corner or at the edge of several tiles. These little pixel clusters are irrelevant from this investigation’s aspect. They will be deleted, because they decrease the efficiency of creating the masks. As it is shown in Fig. 4, removing the little pixel cluster from the right lower corner, reduces by half the mask area. The selection and elimination of these 25, 100 and 200 pixel sized clusters are shown in ‘Small25’, ‘Small100’ and the ‘Small200’ steps. Although it seemed that there can be significant differences between the results based on using different cluster’s sizes, the tests proved that the varied sizes have not influenced the amount of the useful areas.
Fig. 4. Decrease the size of a tile by elimination of an irrelevant pixel cluster (marked by a red rectangle in the right side)
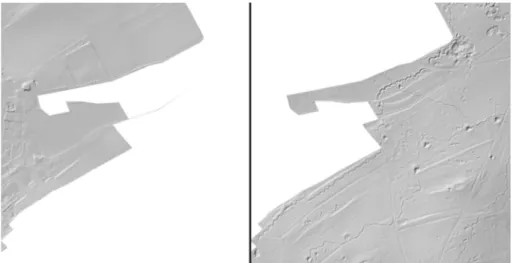
After successfully reducing the potential areas and creating vector and raster masks, the digital terrain models can be generated faster and more efficiently. Based on the previous paragraphs, it is worth to choose the 500-meter tile size. Firstly, the size of the area was reduced to less than one fifth with these tiles. Secondly, the single LiDAR files only contain less than 1.5 million points. Since the files’ names match, the potential areas can be cut easily from the LiDAR files, based on the masks. As a result of this procedure, only the required DTMs, generally smaller than 500 x 500 pixel size, can be generated from the reduced point cloud (Fig. 5). During the further processing steps the craters and other military objects can be detected, identified and counted on these potential areas.
Fig. 5. DTMs about the useful areas with craters, fire-trenches and artillery placements (right) and the irrelevant areas (left)
5. Discussion
Since generally large amount of data has to be investigated, it is not practical to simultaneously work with all of them. The procedure will be more effective, if the files were divided into smaller parts and execute the task just on these areas. The downloaded LiDAR files have already been divided into 1 km2 squares and their names consist of the number of their Universal Transverse Mercator section and the coordinates of the lower left corner point. It is worth to work with smaller tiles, because process can be faster, but obviously it results in increased number of files.
The DTM was created from the LiDAR point clouds can be handled as a digital image, where the pixels represent elevation data. The raster files can be managed as huge matrices, in which case the single data resolution defines the size of the matrix and also the process time. Therefore, it was critical to find the optimal resolution, which still enables the detection of the investigated object. The size of the objects and the resolution of the original dataset have to be considered. The solution is the 1-meter resolution, which is verified from several points of views [23].
The great advantage of the raster files is that they can be processed faster and easier compared to the equivalent (geometrically more accurate) vector files [24]. In case of a 1 km2 tile, three coordinates of 2.7 - 6.3 millions of points are stored or according to the resolution: 250 x 250, 500 x 500, 1000 x 1000 pixel information. The points can be stored either in binary *.las files (or in its compressed version, in *.laz files), or in *.xyz or *.txt ASCII files. The structure, the saving of storage space and the fast process are the advantages of the binary data storage, but usually special software is needed.
Fortunately, there are several software available for working with *.las files (LAStools, CloudCompare) [25] and also the GIS software already have this function (ArcGIS, SagaGIS) [26].
After vector raster conversion there will be a deviation between the sizes of the original and the converted areas. The higher the resolution of the raster is, smaller the deviation will be and larger will be the size of the file. In case of vector files, the number of files has greater influence on the process time than the number of the objects in each file. Instead of handling the entire area of a state, a single GIS selection can be executed faster in a 1 km2 tile. On contrary, the loading and handling of the small vector files can take more time than the benefit on small file procession.
As usual, compromises have to be made during the investigation. As it is written above, the investigated craters have various sizes, so assumptions and simplifications have to be made. The main size of a crater was estimated in 10 meters and its area in 100 m2. There are few hundreds of square meters of forested areas, which potentially do not include craters. Hence, the areas thinner than one crater or smaller than 3 craters were removed. The selection was tested with different parameters. Based on the experiences, the process is more sensitive to the objects’ width than to the areas. During the development of the procedure, the area losses of the forests were considered (max.
1%). The areas decreased with a few hundredths of percentage in area based selection (from 50 m2 to 400 m2). Whereas, there were a few tenths of percentage decrease in width based solution (from 5 meters to 20 meters).
6. Conclusion and outlook
The aim was to develop a procedure, which enables selecting potential areas according to the goals from very large amount of data. Using this method, the amount of data to be processed was reduced by 70-80% on the test area. Based on the reduced and selected areas, the DTMs can be generated automatically; a special crater detection procedure works on these DTMs.
This method can be applied to select not only forested areas, but for example, any OSM layer. Therefore, using settlement and building layers, creating 3D city models or even estimate solar energy production based on roof models can be supported by the represented potential area reduction. Furthermore, the input data can be not only a single layer, but a generated buffer zone or a result of a GIS analysis or query.
The future plan is further reducing the base tile size, according to the actually investigated land use. The size of the tiles has far greater influence on the procedure’s efficiency than the further filtering processes. It will be developed an adaptive tile size definition process, instead of parallel testing the different tile sizes. This adaptive process would be able to dynamically change the tile size according to the investigated potential areas’ extent and continuously delete the unnecessary tiles. Another aim is to automate the whole process, from data download to detecting craters and creating risk maps.
Acknowledgements
The research is supported by the ÚNKP-17-3-I new international excellence program of the Ministry of Human Capacities
References
[1] Szikszai Cs. Hungary’s World War II bomb bay database, Proceedings of Theory Meets Practice in GIS, (in Hungarian) Vol. II, Debrecen, Hungary, 25-26 May 2017, pp. 337‒342.
[2] Plenty of unexploded World War II bombs in Germany, (in Hungarian) http://mult- kor.hu/20110721_rengeteg_a_fel_nem_robbant_vilaghaborus_bomba_nemetorszagban, (last visited 1 March 2018).
[3] Bomb sight, Mapping the WW2 bomb census, http://www.bombsight.org (last visited 1 March 2018).
[4] Flaming Danube islands - 1944 bombardment of Hungary on archive images (in Hungarian) https://dunaiszigetek.blogspot.hu/2012/06/langban-allo-dunai-szigettenger- archiv.html, (last visited 1 March 2018).
[5] Juhász A. Data collection methods for military historical reconstruction, Academic and Applied Research in Military Science, Vol. 4, No. 3, 2005, pp. 413‒420.
[6] Molnár B. Developing a web based photogrammetry software using DLT, Pollack Periodica, Vol. 5, No. 2, 2010 pp. 49‒56.
[7] Somogyi Á., Lovas T., Barsi Á. Comparison of spatial reconstruction software packages using DSLR images, Pollack Periodica, Vol. 12, No. 2, 2017. pp. 17‒27.
[8] Berényi A. Laser scanning in engineering survey - An application study, Pollack Periodica, Vol. 5, No. 2, 2010 pp. 39‒48.
[9] Szabó Sz., Enyedi P., HorváthM., Kovács Z., Burai P., Csoknyai T., Szabó G., Automated registration of potential locations for solar energy production with Light Detection And Ranging (LiDAR) and small format photogrammetry, Journal of Cleaner Production, Vol.
112, No. 5, 2015, pp. 3820‒3829.
[10] Juhász A., Neuberger H. Remotely sensed data fusion in modern age archaeology and military historical reconstruction, Proceedings of the International Archives of Photogrammetry, Remote Sensing and Spatial Information Sciences, (XXIII ISPRS), Prague, Czech Republic, 12-19 July, 2016, Vol. XLI-B5, pp. 281‒286.
[11] Tian B. Processing and analyzing data to extract useful and meaningful information, in GIS Technology Applications in Environmental and Earth Sciences, Tian B. (Ed.) Routledge, 2016. pp. 96‒103.
[12] OpenStreetMap, http://www.openstreetmap.org/about, (last visited 1 March 2018).
[13] Klonner C., Barron C., Neis P., Höfle B. Updating digital elevation models via change detection and fusion of human and remote sensor data in urban environments, International Journal of Digital Earth, Vol. 8, No. 2, 2015, pp. 153‒171.
[14] OpenStreetMap Data in Layered GIS Format, https://www.geofabrik.de/data/geofabrik- osm-gis-standard-0.6.pdf, (last visited 1 March 2018).
[15] LIDAR Composite DSM - 1m, https://data.gov.uk/dataset/lidar-composite-dsm-1m1, (last visited 1 March 2018).
[16] Opengeodata, https://www.opengeodata.nrw.de/produkte/, (last visited 1 March 2018).
[17] Virtanen J. P., Kukko A., Kaartinen H., Jaakkola A., Turppa T., Hyyppä H., Hyyppä J.
Nationwide point cloud - The future topographic Cora data, Int. J. Geo-Information, Vol. 6, No. 8, 2017, Paper 243.
[18] Stoker J., Abdullah Q., Nayegandhi A., Winehouse J. Evaluation of single photon and geiger mode lidar for the 3D elevation program, Remote Sensing, Vol. 8, No. 9, 2016, Paper 767.
[19] What is ModelBuilder? http://desktop.arcgis.com/en/arcmap/10.3/analyze/modelbuilder/
what-is-modelbuilder.htm (last visited 1 March 2018).
[20] LASzip: lossless compression of LiDAR data, http://www.cs.unc.edu/~isenburg/
lastools/download/laszip.pdf (last visited 1 March 2018).
[21] LAS dataset scalability, http://desktop.arcgis.com/en/arcmap/10.3/manage-data/las- dataset/las-dataset-scalability.htm (last visited 1 March 2018).
[22] License agreement, http://www.cs.unc.edu/~isenburg/lastools/LICENSE.txt (last visited 1 March 2018).
[23] Neuberger H., Juhász A., Kruse C. Automatic detection of World War II objects based on airborne LiDAR data, Proceedings of Theory Meets Practice in GIS, (in Hungarian) Vol. III. Debrecen, Hungary, 25-26 May 2017, pp. 259‒265.
[24] Wade T. G., Wickham J. D., Nash M. S., Neale A. C., Ritters K. H., Jones K. B. A, Comparison of vector and raster GIS methods for calculating landscape metrics used in environmental assessments, Photogrammetric Engineering and Remote Sensing, Vol. 69, No. 12, 2003, pp. 1399‒1405, https://pdfs.semanticscholar.org/de02/e3569b292e 487919e77f1ac85de57e922caa.pdf, (last visited 1 March 2018).
[25] CloudCompare, http://www.danielgm.net/cc/, (last visited 1 March 2018).
[26] SAGA GIS, http://www.saga-gis.org/saga_tool_doc/2.2.0/io_shapes_las_1.html, (last visited 14 February 2018).
![Fig. 1. Bombed area on archive aerial photograph [4]](https://thumb-eu.123doks.com/thumbv2/9dokorg/1401102.117381/2.892.221.735.448.694/fig-bombed-area-archive-aerial-photograph.webp)