ANALYSIS OF AVERAGE MARKET AND PURCHASE PRICES FOR CERTAIN FRUIT SPECIES
József Lipcsei PhD student
Szent István University, Faculty of Economics and Social Sciences, Doctoral School of Economics and Regional Sciences
E-mail: lipcseijozsef@citromail.hu Abstract
In addition to the optimal use of resources, the profitability of agriculture is affected by weather anomalies and risk-taking with the market. The latter are the most critical factors of effectiveness over which the average producer has no influence. As the majority of Hungarian producers are small and medium-sized holdings, it is essential to examine their market exposure. At the beginning of the agricultural season, the professional journals often publish record yields and top quality, lacking a professional view that reduces the benefits of producers and thus the market price. The aim of the study is to present the economic exposure of farmers by illustrating the pricing practices of the fruit growing sector, including apples, pears, cherries, sour cherries, peaches, apricots, nectarines, plums, currants, raspberries and strawberries. How the average purchase price develops in addition to fixed assets, expenses and ecological- economic risk-taking, and how the average market price develops as a result of the margin.
How the trade margin evolves and if there is a correlation between the quantity produced and the final price. The benefit of agriculture is often not the benefit of the farmer, because the profit is realized at the trader. The pricing practices of the reviewed period are multiple for some fruit species and exceptionally high for other fruit species. In the examined period of the fruit sector we cannot establish market flexibility and balance in several cases. In conclusion, the producer price comes as the result of the farmer’s work which is not affected by the yield and the market’s demand in several cases. The main reason is not generated in the agricultural production, however, the purpose of this publication is not to investigate this subject.
Keywords: Average purchase price, Average market price, Income, Yield, Margin JEL classification: Q11, Q21, D49
LCC code: S1-972 Introduction
The object of this publication is to examine the relationship between the average purchase price - the price paid to the producer for the fruit - and the average market price - the price set by the trader for the consumer - in the period between 2014 and 2018. The correlations of the studies are part of my PhD research. In my publication I would like to draw attention to the economic exposure of the agricultural production, and to what the difference is between the benefits of the productive labour and the trade margin. This part of the research does not cover cultivation technology and biotic-abiotic factors. My only goal is to contrast the benefits for farmers and the other participants of the supply chain.
Agricultural market risk (including price risk) refers to the uncertainties of the approximated returns the agricultural producer has to deal with, in relation to certain production factors, to be able to produce the final product during the process of commercialization. These uncertainties
occur because of market price fluctuation, making it hard to give a probability value of possible circumstances (Wang et al, 2010).
The efficiency of agricultural production is influenced by a combination of biological factors, agroecological conditions and agrotechnical elements. The monetary return of profitability is also determined by factors other than farmers. A balanced market would require the market- regulating role of supply and demand, the price regulation of yields both home and abroad. The system of agricultural pricing is characterized by irregularity. The most common price- depressing effects are the weather and the outstanding vintage, to which reference is made every year.
Extra income is mentioned in a negative way by several authors in the exploratory reports of the European Union, as a source that is not realized by the farmer (see eg Swinnen, 2009).
Domestically the Agricultural Economics Research Institute (Pesti-Keszthelyi, 2010) has stated in the previous years that most of the significantly increased margins have been lost to purchasers, processors and traders.
In addition, according to Dudás (2009), producers are also in a vulnerable position in the markets, and the depressed prices forced by customers, the mass of products marketed without origin and quality checks, do not serve their best interests or that of the industry. In Europe and in the United States at the end of the 19th and the beginning of the 20th century there was a social need to protect market competition from the economic superiority of big businesses, to provide legal protection to the freezer, the employee, the smaller companies, and the local society (Bod, 2014). Similarly it would be possible to control trade in Hungary so that production would be profitable and affordable, products would be available to consumers. And traders could realize a certain trade margin within a regulated framework.
Hungary has a significant - and quantifiable - comparative advantage over its competitors in two areas. These two areas are water resources and a high proportion of arable land. On average in the European Union, 41.4% of all land is suitable for agricultural production, while in Hungary this proportion is 62.5%, and thus we are ahead of most EU member states (Kapronczai, 2011). According to the data of the KSH, the fruit production area in Hungary was almost 94 thousand hectares in 2018, significantly lagging behind the 102.6 thousand hectares in the European Union in 2004. The most important fruit species based on their area of production are apples, cherries, plums, peaches and apricots, pears, cherries, currants, raspberries and strawberries. The total production in 2018 was 924,804 tons, which is significantly higher than the 359664 tons in 2007 damaged by the frost. In terms of fruit production, the role of Szabolcs-Szatmár-Bereg county is outstanding, in 2016, 61% of all apple crops and 25% of the harvested sour cherries were produced here. Apples make up two-thirds of the fruit production, while our second most important fruit, cherries, now accounts for only 8% of the total crop. The third most important fruit is the plum, the fourth is the peach with their own 7 and 5% share (KSH, 2018).
In the field of fruit growing, the effect of the amount of fruit waiting to be harvested on the quality (turnover, income) is influenced by the following factors:
• the proportion and market value of varieties maturing simultaneously and in succession
• ripening process and sensitivity of the varieties to the harvest time
• current sales opportunities and prices
• the versatility and processing possibilities of the fruit
• the possibilities of transportability and storability, fast preparation into goods
• manpower and technical equipment, infrastructure
• opportunities for association
• weather factors (Soltész, 1998).
Depending on the structure of the product, the farmer needs to build, maintain and nurture partnerships of varying degrees, but overall, in order to make her marketing work as effective as possible in the product realization process (Mizik, 2018, Čeryová et al. 2020).
Under the law of one price, prices in space do not differ from each other to a greater extent than transportation or transfer costs. The two axioms of the theory of spatial differences were defined by Tomek and Kaiser (2014) as follows:
• for any two trading markets, the price difference is equal to the transfer costs
• for any two non-trading markets, the price difference is less than the transfer costs.
According to price theory, there is an inverse relationship between quantity and price, but this inverse relationship says nothing about how quantity responds to changes in price for a given good. The quantitative reaction to prices varies from product to product (Mizik, 2016, Lajdová et al. 2016). The difference between the producer price and the consumer price is called the trade margin. Because of the risk, if the price of an output is uncertain for a company, it will affect its production, its pricing policy, and thus its margin. Referring to empirical research, Wohlgenant (2001) states that with lower risk aversion, the margin is expected to have a positive relationship to output price risk. Market bargaining power expresses the market share of a market participant (seller / producer and buyer) in a given market structure of all sales (purchases) in a given market and, depending on this, the extent to which it has an influence on the supply (demand) side, and thus prices (Mizik, 2018).
In the case of agricultural trade, prices are also formed through informal price negotiations (Tomek-Robinson, 2003). The “take it yourself” campaign is the most typical example, where pricing can be done individually, even in the orchard area. Price bargaining can have both positive and negative effects. A farmer in difficulty and his product are more vulnerable in the market than his capital-intensive and bulky competitor. In such situations the price bargain may distort the purchase price.
The ability to converge purchase and market prices may be affected by the proliferation of short supply chains. Based on the REL, trade margins between producer and consumer without other participants and the approximation of production-processing-transport-consumption can reduce the trade margin, generating more favorable prices. In addition, the farmer has the advantage of being able to use multiple sales channels - traditional and neo-traditional - at the same time, increasing efficiency and optimizing their income (Brown-Miller, 2008).
Material and method
When examining the yield of fruit production, I performed a comparison of the average purchase price obtained by the producers and the average market price, and I examined the correlation between the yields and the former prices. The research was based on the average prices and yields of the main fruit species of the current Common Agricultural Policy period 2014-2018 of the Central Statistical Office (apples, cherries, plums, peaches and apricots, nectarines, pears, cherries, currants, raspberries and strawberries). I processed the data in excel.
I plotted the relationships with diagrams and used a correlation test to find the answer to the question of whether there is a relationship between the variables and, if so, how close it is.
According to the square of the interpretation ranges of the correlation coefficients, the
coefficient of determination is weak up to 9%, weak-medium in the range of 15-36% and strong from 49%.
Based on the experience of my own farming activities, I set up the following hypotheses:
H1: There is a considerable margin on the average market price compared to the average purchase price.
H2: There is no close correlation between the quantity produced and the average price.
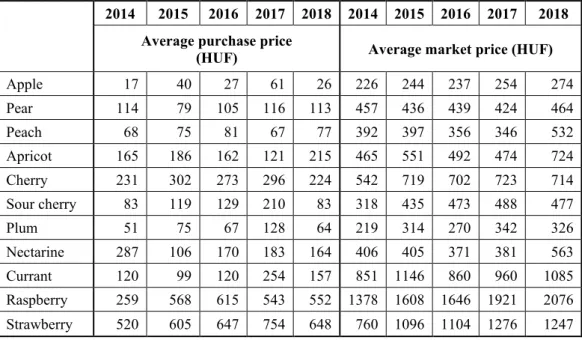
Examining the average prices (Table 1) for several fruit species, it can be stated that there is no trend and it changes every year in both cases. The biggest differences can be observed in the prices of apples and currants and in the markets of cherries, currants, raspberries and strawberries.
Table 1: Development of purchase and market average prices for selected fruits, 2014- 2018 (HUF / kg)
2014 2015 2016 2017 2018 2014 2015 2016 2017 2018 Average purchase price
(HUF) Average market price (HUF)
Apple 17 40 27 61 26 226 244 237 254 274
Pear 114 79 105 116 113 457 436 439 424 464
Peach 68 75 81 67 77 392 397 356 346 532
Apricot 165 186 162 121 215 465 551 492 474 724 Cherry 231 302 273 296 224 542 719 702 723 714 Sour cherry 83 119 129 210 83 318 435 473 488 477
Plum 51 75 67 128 64 219 314 270 342 326
Nectarine 287 106 170 183 164 406 405 371 381 563 Currant 120 99 120 254 157 851 1146 860 960 1085 Raspberry 259 568 615 543 552 1378 1608 1646 1921 2076 Strawberry 520 605 647 754 648 760 1096 1104 1276 1247
Source: Own editing based on the data of KSH, (2020)
With regard to yields and production area (Table 2), an annual change in yields - a decrease- increase - can be observed, which is clearly not a direct consequence of the size of the production area. The only increase was in the case of apricots alone, with an average annual increase of 118 hectares of the production area.
The main reasons for the change in the figures are the plantation support for the 2014-2020 period of the Rural Development Program, the liquidation of obsolete plantations, and the amount of area-based support with an outstanding amount. In 2018, the amount of support paid within the framework of the VP-M04.1.3.2- Horticulture-Plantation tender was HUF 3.28 billion, the support for extensive fruit production was HUF 55.1 billion, the support for intensive fruit production was HUF 29.3 billion (data source: MÁK, 2019).
Table 2: Development of yield (t) and production area (ha) of selected fruit varieties, 2014-2018
2014 2015 2016 2017 2018 2014 2015 2016 2017 2018
Yield (t) Production area (ha)
Apple 779853 511460 497108 473662 678775 33260 32803 32485 32166 31838 Pear 20797 36793 23083 23333 25948 2886 2879 2872 2895 2842 Peach 38729 37372 39554 37080 22910 5442 5409 5417 5344 4931 Apricot 23087 19855 23528 24101 14329 4567 4708 4907 4971 5038 Cherry 9426 11312 10660 10551 12018 2484 2577 2429 2455 2593 Sour cherry 91845 76792 73591 69757 83566 13576 13062 13062 13193 13288 Plum 45116 46023 47560 43295 46690 7356 7223 7980 7944 7919 Nectarine 1285 1541 1339 1164 1121 271 296 294 274 269 Currant 2626 3558 4582 4319 4749 1316 1158 1195 1186 1214 Raspberry 1584 1534 1232 1324 1257 536 536 590 585 571 Strawberry 5072 5313 6002 4778 5382 664 742 788 786 731
Source: Own editing based on the data of KSH, (2020) Research results
For apples (Figure 1), there is no correlation between the average purchase price and the average market price. I examined whether there is a correlation between the quantity produced and the purchase price, according to which there is a strong negative relationship between the two factors, which follows from the fact that the correlation between the two variables is -0.7513.
According to the coefficient of determination, the quantity produced determines the purchase price in 56.5%.
Figure 1: Changes in the average purchase and market prices of apples in 2014-2018 Source: Own editing based on the data of KSH, (2020)
There is no correlation between the quantity produced and the average market price, at least according to the correlation coefficient of -0.1266. According to the coefficient of determination, the quantity produced determines the market price by only 1.6%. The two factors
2015 2014 2016
2017 2018
2014 2015
2016
2017 2018
0 50 100 150 200 250 300
400000 450000 500000 550000 600000 650000 700000 750000 800000
HUF
Yield
average purchase price average market price linear average purchase price linear average market price
are independent of each other, the market price is determined by 9.4% of the purchase price.
There is an average price difference of HUF 213 between the average market price and the average purchase price, the difference is 8.6 times on average, varying from year to year and in terms of proportion.
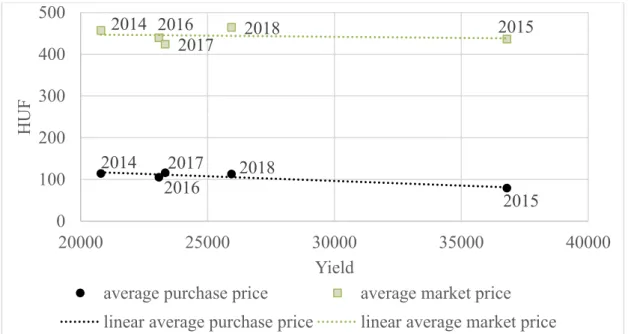
In the case of average pear prices (Figure 2), the coefficient of determination determines the purchase price at 85.2% of the average purchase price. There is no correlation between the average purchase price and the average market price. There is an extremely strong negative relationship between yield and purchase price, with a correlation of -0.9228 between the two variables. According to the coefficient of determination, the purchase price determines 85.2%
of the purchase price.
There is no correlation between yield and market average price, at least according to the correlation coefficient of -0.2122. According to the coefficient of determination, the quantity produced determines the market price only 4.5%. The two factors are independent of each other, the market price is determined by 7.1% of the purchase price. There is an average price difference of HUF 339 between the average market price and the average purchase price, the difference is 4.3 times on average, varying from year to year and in terms of proportion.
Figure 2: Changes in the average purchase and market prices of pears in 2014-2018 Source: Own editing based on the data of KSH, (2020)
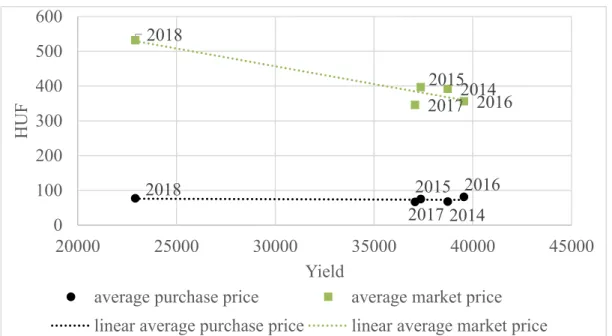
In the examined 5-year average of the peach market (Figure 3), the relationship between the average purchase price and the yield is weak. There is no correlation between the average purchase price and the average market price. There is an extremely strong negative relationship between yield and market average, the correlation between the two variables is -0.9461.
According to the coefficient of determination, the volume produced determines the average market price in 89.5%. There is no correlation between yield and average purchase price, at least according to the correlation coefficient of -0.2342. There is an average price difference of HUF 331 between the average market price and the average purchase price, the difference is 5.5 times on average, varying from year to year and in terms of proportion.
2014
2016 2015
2017 2018
2014 2016 2015
2017 2018
0 100 200 300 400 500
20000 25000 30000 35000 40000
HUF
Yield
average purchase price average market price linear average purchase price linear average market price
Figure 3: Change in average purchase and market prices of peaches in 2014-2018 Source: Own editing based on the data of KSH, (2020)
Regarding the currant market, it can be concluded that the average market price is completely independent of the yield and has only a small effect on the purchase price (Figure 4). As a complete counterexample to normal market operation, the average fruit yield produced in 2015 resulted in a low purchase price of HUF 99 per kilo with an 11.6 times trade margin, which was already realized at the market price. According to the ratio of average prices, the average margin is 7.3 times, which means an average of HUF 830.
Figure 4: Change in average purchase and market prices of currants in 2014-2018 Source: Own editing based on the data of KSH, (2020)
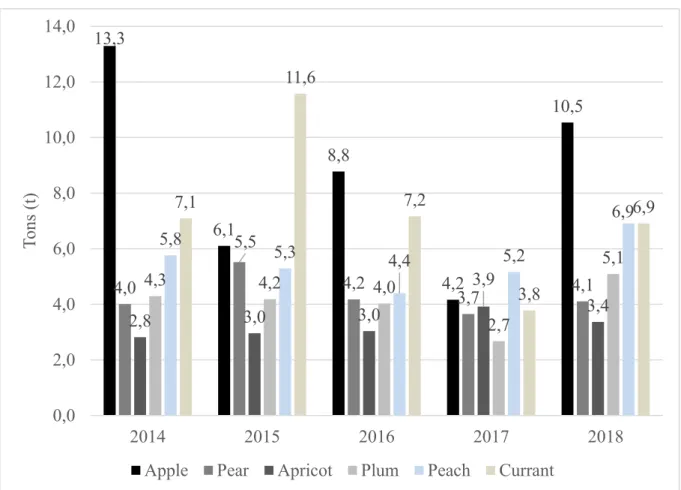
Examining the relationship between average purchase prices and average market prices, the trade margins of different fruit species can be determined (Figure 5). In the case of apples, in 2014 the average market price was 13.3 times higher than the purchase price. A similar
2014 2015 2016 2017
2018
20152014 2017 2016 2018
0 100 200 300 400 500 600
20000 25000 30000 35000 40000 45000
HUF
Yield
average purchase price average market price linear average purchase price linear average market price
2014 2015 2017 2016
2018 2014
2015
2017 20162018
0 200 400 600 800 1000 1200 1400
2500 3000 3500 4000 4500 5000
HUF
Yield
average purchase price average market price linear average purchase price lenear average market price
outstanding trade margin was observed for currants in the other examined fruit species in 2015, with a value of 11.6 times. Trader profits averaged 3-5 times. The five-year average analysis shows that apples were 8.6-fold, pears 4.3-fold, peaches 5.5-fold, apricots 3.2-fold, cherries and nectarines 2.6-fold, and cherries 3-fold. 8 times the average market price for plums 4.1 times, currants 7.3 times, raspberries 3.6 times and strawberries 1.7 times the average purchase price.
Figure 5: Trade margin ratio in relation to the average purchase price and the average market price, for selected fruits, 2014-2018
Source: Own editing based on the data of KSH, (2020)
Based on the results, the quantity produced and the price do not correlate in many cases. In general, the higher the coefficient of determination, the more the average market price or average purchase price depend on the quantity produced (Figure 6). In the case of the apricot market, the examined values are the highest, according to which the market price is determined by 96.9% and the average purchase price by 79.6% of the 5-year average of the produced quantity. The explanatory power is weak up to 9% at the market price of apples, pears, plums, currants and strawberries, weak-medium at the purchase price of currants, nectarines and the market price of nectarines. According to these data, it can be stated that the market price for these fruit species is independent of the yield.
13,3
6,1
8,8
4,2
10,5
4,0
5,5
4,2 3,7 4,1
2,8 3,0 3,0
3,9
3,4
4,3 4,2 4,0
2,7 5,8 5,1
5,3 4,4 5,2
7,1 6,9
11,6
7,2
3,8
6,9
0,0 2,0 4,0 6,0 8,0 10,0 12,0 14,0
2014 2015 2016 2017 2018
Tons (t)
Apple Pear Apricot Plum Peach Currant
Figure 6: The rate of trade margin in relation to the average purchase price and the average market price
Source: Own editing based on the data of KSH, (2020) Conclusions
According to the average data of the coefficient of determination, the yield does not affect the average purchase price for strawberries, currants, cherries and peaches. Producers could be provided with a predictable market price for these fruits. In practice, the opposite is true, as between the profit of the producer's work and the profit of the trader was 462 HUF / kg for strawberries, 830 HUF / kg for currants, 415 HUF / kg for cherries and 331 HUF / kg for peaches. The market price is composed of the price paid to the producer and a considerable trade margin.
The most optimal players in the fruit market are apricots, for which there is a very strong correlation between the purchase market price and the yield, and the trade margin is 3.2 times bigger than the purchase price on average. The relationship between yield and prices can also be established for cherries and raspberries. The margin for cherries is 3.8 times the average purchase price, and the margin for raspberries is 3.6 times the average purchase price.
Hypothesis “H1” was confirmed by the data.
The average purchase price and the average market price show a changing trend from year to year, both in terms of price and yield. It can be stated with certainty that for several fruit species there is no correlation between yield and price, thus the hypothesis “H2” was confirmed by the data. According to the findings, state or EU control of trade margins and purchase prices would be necessary for producers in order to be able to produce food profitably for the population, and
56,5%
85,2%
5,5%
79,6%
0,2%
70,5%
51,5%
15,7%
15,3%
49,6%
3,0%
1,6%
4,5%
89,5%
96,9%
63,0%
67,2%
5,8%
23,7%
5,2%
54,2%
0,0%
0,0% 20,0% 40,0% 60,0% 80,0% 100,0%
Apple Pear Peach Apricot Cherry Sour cherry Plum Nectarine Currant Raspberry Strawberry
average market price average purchase price
the greater part of the price is not given by the trade margin but the product. The efficiency of short supply chains is essential for a sustainable rural economy, as evidenced by the results.
The normal functioning of the market would result in lower market prices and a more valued relationship between producer, trader and consumer. Exploring the exact causes requires further and complex research, which will be part of my later research.
References
1. Bod P. Á. (2014): Bevezetés a gazdaságpolitikába. Budapest, Akadémiai Kiadó Zrt.
2. Čeryová, D. -- Bullová, T. -- Turčeková, N. -- Aamičková, I. -- Moravčíková, D. -- Bielik, P. (2020): Assessment of the Renewable Energy Sector Performance Using Selected Indicators in European Union Countries. In Resources. 9, 102 (2020), s. 2020.
ISSN 2079-9276.
3. Čeryová, D. -- Bullová T. -- Adamičková, I. -- Turčeková, N. -- Bielik, P. (2020):
Potential of investments into renewable energy sources. In: Problems and Perspectives in Management. 18, 2 (2020), s. 57--63. ISSN 1727-7051.
4. Brown C. – Miller S. (2008): The impacts of local markets: a review of research on farmers markets and community supported agriculture. American Journal of Agricultural Economics, 90. (5) 1298-1302. p.
5. Dudás Gy. (2009): A TÉSZ-en keresztüli értékesítést motiváló tényezők és körülmények. Gazdálkodás 53. (5) 404-412. p.
6. Kapronczai I. (2011): A magyar agrárgazdaság az EU-csatlakozástól napjainkig.
Budapest, Szaktudás Kiadó Ház ZRt.
7. KSH (2018): Gyümölcsös ültetvények összeírása, 2018, http://www.ksh.hu/interaktiv/storytelling/gyumolcs/index.html, Downloaded at:
2020.11.02.
8. Lajdová, Z. -- Lajda, J. -- Kapusta, J. – Bielik, P. (2016): Consequences of maize cultivation intended for biogas production. In: Agricultural economics. 62, 12 (2016), s. 543--549.
9. Mizik T. (2016): Agrárgazdaságtan I. Mezőgazdasági árak és piacok. Budapest, Akadémiai Kiadó Zrt.
10. Mizik T. (2018): Agrárgazdaságtan II. Az agrárfejlődés mikro- és makroökonómiája.
Budapest, Akadémiai Kiadó Zrt.
11. Pesti Cs. – Keszthelyi Sz. (2010): A különböző típusú üzemek jövedelmét befolyásoló tényezők vizsgálata és nemzetközi összehasonlítása. Budapest, Agrárgazdasági Kutató Intézet.
12. Soltész M. (1998): Gyümölcsfajta-ismeret és használat. Budapest, Mezőgazda Kiadó.
13. Swinnen J. F. M. (2009): On the Future of Direct Payments. Paper presented at the BEPA Workshop. February 26. 2009, European Commission, Brussels
14. Tomek W. G. – Kaiser H. M. (2014): Agricultural Product Prices. Ithaca, Cornnell University Press.
15. Tomek W. G. – Robinson K. (2003): Agricultural Product Prices. Chapter 11. Cornnell University Press.
16. Wang C. – Zhao J. – Huang M. (2010): Measurement of the fluctuation risk of the China fruit market price based on VaR. Agriculture and Agricultural Science Procedia, 1. 212–218. p.
17. Wohlgenant M. (2001): Marketink margin: Empirical analysis. In: Gardner B. L. – Rausser G. C. (eds): Handbook of Agricultural Economics. IB, Amsterdam