Journal Pre-proof
Swelling as a promoter of migration of plastic additives in the interaction of fatty food simulants with polylactic acid- and polypropylene-based plastics
Csaba Kirchkeszner, Noémi Petrovics, Tamás Tábi, Norbert Magyar, József Kovács, Bálint Sámuel Szabó, Zoltán Nyiri, Zsuzsanna Eke
PII: S0956-7135(21)00492-8
DOI: https://doi.org/10.1016/j.foodcont.2021.108354 Reference: JFCO 108354
To appear in: Food Control Received Date: 9 March 2021 Revised Date: 15 June 2021 Accepted Date: 16 June 2021
Please cite this article as: Kirchkeszner C., Petrovics N., Tábi T., Magyar N., Kovács J., Szabó B.S., Nyiri Z. & Eke Z., Swelling as a promoter of migration of plastic additives in the interaction of fatty food simulants with polylactic acid- and polypropylene-based plastics, Food Control, https://doi.org/10.1016/
j.foodcont.2021.108354.
This is a PDF file of an article that has undergone enhancements after acceptance, such as the addition of a cover page and metadata, and formatting for readability, but it is not yet the definitive version of record. This version will undergo additional copyediting, typesetting and review before it is published in its final form, but we are providing this version to give early visibility of the article. Please note that, during the production process, errors may be discovered which could affect the content, and all legal disclaimers that apply to the journal pertain.
© 2021 The Author(s). Published by Elsevier Ltd.
CRediT (Contributor Roles Taxonomy) authorship contribution statement
Csaba Kirchkeszner: conceptualization, design and conduct the experiments, data evaluation and visualization, formal analysis, writing – original draft
Noémi Petrovics: conceptualization, design and conduct the experiments, data evaluation and visualization, formal analysis, writing – original draft
Tamás Tábi: production and analysis of plastics, data interpretation, writing – review &
editing, funding acquisition
Norbert Magyar: data visualization, formal analysis, writing – review & editing
József Kovács: data visualization, formal analysis, writing – review & editing, funding acquisition
Bálint Sámuel Szabó: writing – review & editing, conceptualization
Zoltán Nyiri: writing – review & editing, conceptualization
Zsuzsanna Eke: conceptualization, supervision, writing – review & editing, funding acquisition
Journal Pre-proof
1
Swelling as a promoter of migration of plastic additives in the interaction of
1
fatty food simulants with polylactic acid- and polypropylene-based plastics
2 3
Csaba Kirchkesznera,b,‡, Noémi Petrovicsa,b, ‡, Tamás Tábic,d, Norbert Magyare, József 4
Kovácsf, Bálint Sámuel Szabóa,b, Zoltán Nyirib, Zsuzsanna Ekea,g*
5 6
a Hevesy György PhD School of Chemistry, Eötvös Loránd University, Pázmány Péter stny.
7
1/A, H-1117 Budapest, Hungary 8
b Joint Research and Training Laboratory on Separation Techniques, Institute of Chemistry, 9
Eötvös Loránd University, Pázmány Péter stny. 1/A, H-1117 Budapest, Hungary 10
c Department of Polymer Engineering, Faculty of Mechanical Engineering, Budapest 11
University of Technology and Economics, Műegyetem rkp. 3, H-1111 Budapest, Hungary 12
d MTA-BME Research Group for Composite Science and Technology, Műegyetem rkp. 3, H- 13
1111 Budapest, Hungary 14
e Department of Methodology for Business Analyses, Faculty of Commerce, Hospitality and 15
Tourism, Budapest Business School, Alkotmány u. 9–11, H-1054 Budapest, Hungary 16
f Department of Geology, Institute of Geography and Earth Sciences, Eötvös Loránd 17
University, Pázmány Péter stny. 1/C, H-1117 Budapest, Hungary 18
g Wessling International Research and Educational Center, Anonymus u. 6, H-1045 Budapest, 19
Hungary 20
21
* Corresponding author. E-mail address: zsuzsanna.eke@ttk.elte.hu (Zsuzsanna Eke)
22
Phone number: +36-30-598-0300 23
‡ These two authors contributed equally to the work.
24
E-mail addresses: csaba.kirchkeszner@ekol.chem.elte.hu, 25
noemi.petrovics@ekol.chem.elte.hu, tabi@pt.bme.hu, magyar.norbert@uni-bge.hu, 26
kevesolt@geology.elte.hu, balint.szabo@ekol.chem.elte.hu, zoltan.nyiri@ekol.chem.elte.hu 27
Journal Pre-proof
2
Abstract
28
The migration of various plastic additives (antioxidants: BHT, Ionox 220, Irgafos 168;
29
UV absorber: Uvinul 3039; plasticizers: TBAC and TOTM) from polypropylene and 30
polylactic acid was investigated in a series of experiments conducted over a period of 13 days.
31
As fatty food simulants, both ethanol 95 v/v% and isooctane were used. Non-Fickian 32
behaviour was observed on multiple occasions. The kinetic curves of both migration 33
concentrations and swelling were evaluated using variography to determine objectively the 34
starting points of long-lasting plateaus as well as short halts in the increase. A strong 35
correlation between migration and swelling was observed: the kinetic curves showed that 36
migration always followed swelling. Also, more intensive swelling results in the increased 37
migration of the additivies. Consequently, migration testing can be improved by considering 38
the swelling of the plastic.
39 40
Keywords
41
polylactic acid (PLA), polypropylene (PP), food contact materials (FCM), migration kinetics, 42
swelling effect, variography 43
44
Highlights
45
Migration and swelling kinetics of polylactic acid and polypropylene were studied.
46
Swelling strongly affects plastic additive migration from food contact materials.
47
The effect of molecular weight on additive migration can be overruled by plasticizers.
48
Variography was successfully applied to identify steady-states on kinetic curves.
49
Journal Pre-proof
3
1. Introduction
50
Plastic food contact materials (FCPs) play an indispensable role in food production, 51
storage, transport and safety. Nowadays, the most commonly used FCPs are petrochemical- 52
based polymers, such as polyethylene (PE) and polypropylene (PP). Its low price, good 53
malleability, and strong water barrier properties make PP a remarkable raw material in the 54
manufacture of food packaging. However, the rapid growth of environmental awareness has 55
increased demand for the use of biodegradable polymers. For food industry applications, the 56
most prominent biopolymer is polylactic acid (PLA), due to its high mechanical strength, 57
good optical properties, low toxicity, and relatively low price.
58
Along with polymers, FCPs also contain additives; antioxidants, UV stabilizers, slip 59
agents, nucleating agents, plasticizers and various other additives are used to prevent the 60
degradation of plastic products and improve the processability of the raw material. These 61
chemical compounds and their contaminants or degradation products can migrate from the 62
FCP into the food, which might pose a serious risk to human health. Migration studies are 63
therefore required in the case of plastic materials that are to be used as food contact materials.
64
Commission Regulation (EU) 10/2011 of 14 January 2011 on “Plastic materials and articles 65
intended to come into contact with food” (Commission Regulation (EU) 10/2011, 2011) lays 66
down rules for the basic circumstances (e.g. contact time, temperature) of such tests. Some 67
standard test settings are also determined, e.g. long-term storage at room temperature or 68
below are to be modelled using a 10 day migration test at elevated temperatures (40 °C or 60 69
°C).
70
Furthermore, the use of six food simulants instead of real food is prescribed. The 71
choice of appropriate simulant depends on the characteristics of the food intended to come 72
into contact with the FCP. For instance, vegetable oil with less than 1% unsaponifiable matter 73
is specified as a substitute for lipophilic food (Commission Regulation (EU) 10/2011, 2011).
74
Nevertheless, this food simulant is rarely used in specific migration studies, since it is not 75
compatible with either gas (GC) or reversed-phase high-performance liquid chromatographic 76
(RP-HPLC) analytical systems. Usually, 2,2,4-trimethylpentane (isooctane) and ethanol 95 77
v/v% are used instead (Aznar et al., 2019; Garde et al., 2001; Lu et al., 2021; Ramos et al., 78
2014; Vera et al., 2018; Yang et al., 2016). These are the solvents also specified in the 79
current consolidated version of the aforementioned regulation (Commission Regulation 80
(EU) 10/2011, 2011) for cases when it is not technically feasible to work with vegetable oil.
81
For such cases, however, the use of both solvents is required. With this approach, the 82
Journal Pre-proof
4
analytical work becomes incomparably easier, even though it duplicates the number of 83
samples to be analyzed. In the end, to ensure consumer safety, any decision on compliance of 84
the FCP tested must be based on the highest observed concentrations. This means the number 85
of samples to be analyzed can be kept under control if the solvent providing a more intensive 86
migration is known prior to the testing.
87
Migration is a complex process, the result of diffusion, dissolution, and equilibrium 88
(Manzanarez-López et al., 2011; Samsudin et al., 2018). Therefore, a deeper understanding 89
of this phenomenon is based on kinetic tests, in which the time dependence of mass transfer is 90
investigated. Several kinetic studies on the migration of various compounds into food 91
simulants are available. These studies usually aim at demonstrating the applicability of the 92
tested compounds to become the active agent of active packaging and thus focus on the 93
release of antioxidants (Chang et al., 2019; Garde et al., 2001; Jamshidian et al., 2012, 94
2013; Kang et al., 2018; Manzanarez-López et al., 2011; Ramos et al., 2014) or 95
antimicrobial compounds (Kuorwel et al., 2013; Mascheroni et al., 2010) from thin plastic 96
films (typically 50–200 µm). Recently, Kang et al. (2018) investigated concentrations of 97
BHT and Irganox 1010 in food simulants migrating from PP after pre-treatments mimicking 98
severe food processing conditions, such as sterilization at 121 °C, microwave cooking, and 99
deep freezing. The concentrations observed were presented as a function of contact time, thus 100
demonstrating how the conditions under consideration can amplify migration. A more 101
widespread approach is to assume that Fick's second law of diffusion applies and calculate 102
diffusion coefficients by determining the correlation between migrated concentrations (Mt) 103
normalized with migrated concentration at equilibrium (M∞) and contact time (t) (Chang et 104
al., 2019; Garde et al., 2001; Gavriil et al., 2018; Jamshidian et al., 2012, 2013; Kuorwel 105
et al., 2013; Manzanarez-López et al., 2011; Mascheroni et al., 2010; Ramos et al., 2014).
106
However, non-Fickian behaviour has been reported on multiple occasions. In a study 107
on the release of α-tocopherol from PLA films (α-tocopherol content: 2.58 w%) to oil and 108
ethanol, Manzanerez-López et al. (2011) observed an apparent equilibrium at 73 hours in 109
ethanol at 33 °C. After 106 hours of contact, the concentration of α-tocopherol in the ethanol 110
phase started to increase again, reaching a new equilibrium at 269 hours. Apparent 111
equilibrium was also found by Iñiguez-Franco et al. (2012), in the case of catechin and 112
epicatechin migration from PLA (at contact temperatures of 20 °C and 30 °C). Feigenbaum 113
et al. (2000) reported that the diffusion coefficient of aromatic antioxidants migrating from 114
PP random copolymer into isooctane increased constantly before the concentration of the 115
antioxidants in the isooctane phase reached a plateau. Garde et al. (2001) pointed out that the 116
Journal Pre-proof
5
penetration of n-heptane into PP must cause a time dependence in the diffusion coefficient of 117
antioxidants released from the polymer until the mass transfer of the n-heptane is completed.
118
The Fickian migration curves observed were explained as being caused by the swelling 119
process being fast compared to the migration of antioxidants. After the swelling process was 120
completed, the diffusion coefficient became constant, and this was the value measured 121
experimentally. Mascheroni et al. (2010) applied Fickian models with three different 122
boundary conditions to the prediction of the diffusivity of propolis compounds from PLA 123
films to ethanol and water. The failure of these theoretical models to predict the migration 124
process was attributed to the swelling effect of ethanol.
125
Bodai et al. (2015) introduced variography into chemometrics. It was used in the 126
evaluation of kinetic curves of the migration of Tinuvin P and Irganox 3114 from high- 127
density polyethylene. In the field of earth and environmental sciences this method has been 128
successfully applied to obtain the necessary sampling frequency in time (Hatvani et al., 129
2012; Kovács et al., 2012) and space (Hatvani et al., 2018; Hatvani et al., 2014, 2017, 130
2020; Kern et al., 2020; Trásy et al., 2018), in other words, to find the distance –be it in 131
space or time – at which the data are auto-uncorrelated. Bodai et al. (2015) demonstrated that 132
the original geostatistical method can be used to determine the time necessary to reach a 133
steady-state in the concentration of plastic additives in food simulants. This indicates the 134
likelihood of its applicability to the assessment of migration curves showing non-Fickian 135
behaviour.
136
The plasticizing effect of swelling and its effect of promoting on the migration of 137
polymer additives is widely known. It is usual to explain the relatively high diffusion 138
coefficients obtained using food simulants mimicking fatty food by the swelling of the 139
polymer (Feigenbaum et al., 2000; Nasiri et al., 2016). Samsudin et al. (2014) observed a 140
large release of astaxanthin from PLA to 95% ethanol and attributed it to disruptions of the 141
microstructure of the PLA film caused by ethanol. In this study, however, the degree of 142
swelling observed in PLA samples was not determined. Greater emphasis was assigned to the 143
swelling of PLA by ethanol by Iñiguez-Franco et al. (2017) in their work on the dependence 144
of ethanol sorption by PLA and PLA nanocomposite on ethanol fraction, demonstrating that 145
PLA became more elastic when it was immersed in a solution with a higher ethanol content.
146
Also, the migration of a nanoclay-related surfactant was followed in a 180 day long release 147
study. A connection between the elevated migration rate of surfactant and polymer swelling 148
was assumed in the early stage of release; the time dependence of solvent uptake was not, 149
however, followed. In general, increased migration is often associated with swelling (Garde 150
Journal Pre-proof
6
et al., 2001; Jamshidian et al., 2012; Manzanarez-López et al., 2011; Ramos et al., 2014), 151
the latter is, however, rarely measured, even though swelling renders the assumption of 152
Fickian diffusion invalid.
153
In this study, the aim was to take a deeper look at the connection between swelling and 154
migration by correlating their kinetic curves using PLA and PP polymers. Both polymers have 155
well-established uses as FCPs, while their physical-chemical properties differ to a remarkable 156
degree. The experiments conducted in the course of this study were designed bearing the 157
compliance testing of FCPs in mind. A timeframe close to 10 days was adhered to, as this is 158
the maximum necessary testing time according to Commission Regulation (EU) 10/2011 159
(Commission Regulation (EU) 10/2011, 2011). Beside antioxidants (BHT, Ionox 220, 160
Irgafos 168), a UV absorber (Uvinul 3039) and two plasticizers (TBAC, TOTM) were 161
included. These additives not only cover various functionalities, but also differ in molecular 162
weight. To avoid the need for assuming Fickian behaviour the determination of diffusion 163
coefficients was not pursued, and a decision was made to use variography to determine the 164
onset of steady-states.
165
2. Materials and Methods
166
2.1. Chemicals and Materials
167
IngeoTM Biopolymer 2500HP polylactic acid polymer resin (D-lactide content of 0.5 168
w%) was purchased from NatureWorks LLC (Minnetonka, Minnesota, USA). Tipplen H145F 169
polypropylene homopolymer resin was bought from MOL Group (Budapest, Hungary). Both 170
polymer types are suitable for the production of food contact materials.
171
The polymers were compounded with five different plastic additives. These were BHT 172
(2,6-di-tert-butyl-4-methylphenol, CAS: 128-37-0), Ionox 220 (4,4´-methylene-bis(2,6-di- 173
tert-butylphenol), CAS: 118-82-1), Uvinul 3039 (2-ethylhexyl 2-cyano-3,3-diphenylacrylate, 174
CAS: 6197-30-4), TBAC (tributyl acetyl citrate, CAS: 77-90-7) and TOTM (tris(2- 175
ethylhexyl) trimellitate), CAS: 3319-31-1). Besides, the PP resin originally contained the 176
antioxidant Irgafos 168 (tris(2,4-di-tert-butylphenyl) phosphite, CAS: 31570-04-4) at a 177
concentration of 0.5 w%. During sample preparation, mirex (perchloropentacyclodecane, 178
CAS: 2385-85-5) was used as an evaporation standard. BHT, TBAC, TOTM, and mirex were 179
purchased from Sigma-Aldrich Co. (Budapest, Hungary). Ionox 220 was bought from Alfa 180
Aesar (Molar Chemicals, Budapest, Hungary) and the Uvinul 3039 was donated by BASF 181
Hungary Ltd. (Budapest, Hungary).
182
Journal Pre-proof
7
In the migration tests, isooctane (2,2,4-trimethylpentane, CAS: 54-84-1) and ethanol 183
95 v/v% (CAS: 64-17-5) were applied as food simulants of fatty food. HPLC grade isooctane 184
and ethanol were purchased from Thomasker Finechemicals Ltd. (Budapest, Hungary).
185
The concentration of individual stock solutions of plastic additives and that of mirex 186
were 1000 mg/L and 200 mg/L, respectively.A working solution containing all five additives 187
at 150 mg/L was prepared. Calibration solutions for quantitative analysis were diluted to 10 188
different concentration levels from the working solution in the 25 μg/L–100 mg/L range. Each 189
solution contained mirex in a concentration of 10 mg/L. Calibration solutions were prepared 190
in both isooctane and ethanol 95 v/v%. Two linear curves were fitted in each calibration range 191
of target compounds to achieve the appropriate linearity (R2>0.9900). The lower and upper 192
concentration levels of the calibration linear curves were defined as the lower and upper limits 193
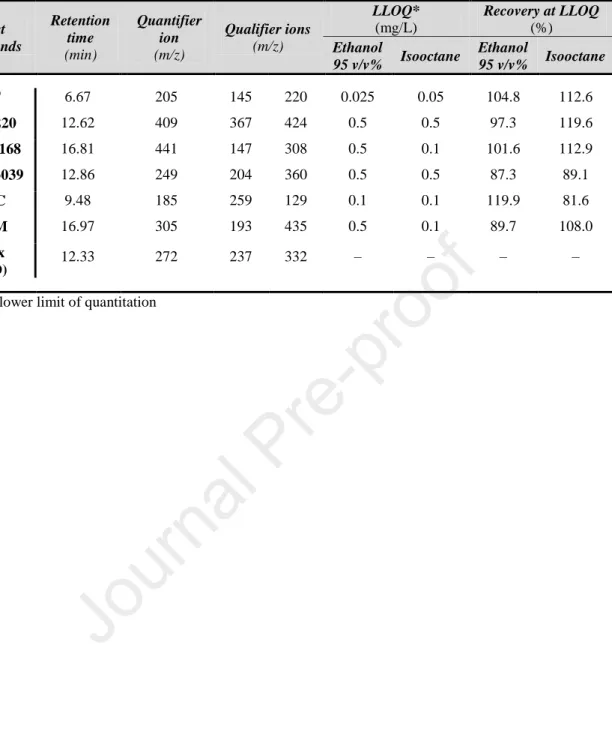
of quantitation (LLOQ and ULOQ). At these points, recoveries were calculated. LLOQ data 194
are listed in Table 1. More detailed information on the calibration curves and representative 195
chromatograms can be found in in Supp. Inf. Table 1.
196
2.2. Production of Plastic Samples
197
Plastic specimens were produced in a three-stage technological process. First, the 198
polymer resins were compounded with the additives using a twin-screw extruder. The 199
resulting filaments were then shredded and repelletized. Eventually, square-shaped sheet 200
specimens were made using injection molding.
201
In the case of PLA, overnight heating at 85 °C was necessary to prevent the hydrolysis 202
of polymer chains during production. In order to avoid possible interference between target 203
compounds and degradation products in quantitative analysis, each polymer was compounded 204
with only one additive. Therefore, the production process resulted in six different types of 205
plastics for both PLA and PP. Additive concentrations were set according to the 206
recommendation of the manufacturers: plastic specimens contained 1.0 w% BHT or Ionox 207
220, 0.75 w% Uvinul 3039, or 5.0 w% TBAC or TOTM. A production blank (i.e. reference 208
sample) was produced, as well.
209
Compoundation was performed with LTE 26-44 twin-screw extruder (Labtech 210
Engineering Co., Ltd., Samutprakarn, Thailand) which was equipped with 26 mm diameter 211
screws. Its rotational speed was 50 rpm during processing. The temperature profile of the 212
screw segments was 170–175–180–185–190 °C toward the nozzle. The average output was 213
60 m/min of 3 mm diameter plastic filament. 3 mm long pellets were shredded using a LZ- 214
120/VS pelletizer (Labtech Engineering Co., Ltd., Samutprakarn, Thailand).
215
Journal Pre-proof
8
The injection molding instrument was an Arburg Allrounder Advance 270S 400-170 216
(Arburg GmbH, Lossburg, Germany) with a 30 mm diameter screw. The temperature profile 217
increased from 190 °C to 210 °C (PLA) and 170 °C to 190 °C (PP) in 5 °C steps. Molding 218
temperature was 25 °C. Injection speed was 50 cm3/s. Holding pressure was 500 bar for 20 s 219
in the case of PLA and 350 bar for 5 s for PP. The residual cooling times of PLA and PP were 220
40 s and 20 s, respectively. The result of each injection molding cycle was a pair of 221
80×80×2 mm (height×width×thickness) plastic sheets.
222
2.3. Characterization of Plastic Materials
223
For the mechanical and thermal characterization of plastics, differential scanning 224
calorimetrical (DSC) analysis and melt flow rate (MFR) measurement were performed. The 225
DSC thermal analyzer (Q2000) was the product of TA Instruments (New Castle, Delaware, 226
USA). The DSC curves were recorded in heat/cool/heat scan cycles. The purge gas was 227
nitrogen. The mass of samples was between 3–6 mg. In the case of PLA, the examined 228
temperature range was 0–200 °C at 5 °C/min heating and cooling rates. For PP analysis, the 229
temperature range was –50–200 °C at 10 °C/min heating and cooling rates. The thermograms 230
were evaluated using TA Universal Analysis Software (TA Instruments, New Castle, 231
Delaware, USA). From the thermograms, glass transition temperature (Tg), melting 232
temperature (Tm), enthalpy of fusion (ΔHm), and enthalpy of cold-crystallization (ΔHcc) were 233
determined. The crystallinity (X%) of plastics was calculated using the following formula:
234
, (1)
where α is the amount of the additive in the plastic. The melting enthalpy of 100% crystalline 235
(ΔHf) PLA is 93.0 J/g (Battegazzore et al., 2011) and 207.1 J/g for PP (Wunderlich, 2015).
236
MFR was measured using a CEAST 7027.000 (Instron, Norwood, Massachusetts, 237
USA) instrument. Its operational settings were based on ISO 1133-2:2011 (ISO 1133-2:2011, 238
2011). The test temperature was 190 °C and the nominal load was 2.16 kg.
239
Both DSC and MFR measurements were performed in triplicate.
240
2.4. Migration Tests and Sample Preparation
241
The plastic sheets were cut into 30×10×2 mm (height×width×thickness) test 242
specimens with a table saw. The width, length, height, and weight of each specimen were 243
measured before immersion with Vernier callipers. The initial weights (mdry) were determined 244
using a Mettler Toledo AJ100L (Mettler Toledo, Columbus, Ohio, USA) analytical balance.
245
The measured specimens were placed into 40 mL glass vials before adding pre-heated (40 °C) 246
Journal Pre-proof
9
food simulants (isooctane or ethanol 95 v/v%). For the migration experiments, the surface and 247
food simulant mass ratio recommended by Commission Regulation (EU) 10/2011 248
(Commission Regulation (EU) 10/2011, 2011) (supposing that cubic packaging with 6 dm2 249
surface contains 1 kg food or food simulant) was employed, i.e. 0.6 cm2/g food simulant.
250
Therefore, either 18 mL isooctane or 16 mL ethanol 95 v/v% was used. Samples were stored 251
at 40 °C in a POL-EKO ST2 laboratory incubator (Pol-Eko-Aparatura, Wodzisław Śląski, 252
Poland). The contact times for the kinetic studies were the following: 5 min, 30 min, 1 h, 2 h, 253
6 h, 12 h, 1 d, 2 d, 3 d, 4 d, 5 d, 6 d, 7 d, 8 d, 9 d, 10 d, 11 d, 12 d, 13 d. For each sampling 254
time, five parallel samples were prepared. After the defined contact times, the sample vials 255
were removed from the incubator for immediate preparation. The weight of swelled plastic 256
specimens (mswelled) was measured after gentle wiping with a piece of blotting paper. When 257
the concentration of a migrated compound proved to be below or above the calibration range, 258
preconcentration or dilution was necessary (details are listed in Supp. Inf. Table 2). Mirex 259
served both as an evaporation and injection standard (ISTD). For enrichment, evaporation 260
under a nitrogen (purity: 4.5, Messer Hungarogáz Kft., Budapest, Hungary) stream was 261
applied. In these cases, mirex was added before the evaporation. The other samples were 262
spiked with ISTD solution before injection into GC-EI-QMS. Eventually, every sample 263
contained 10 mg/L mirex.
264
2.5. GC-EI-QMS Analysis
265
The quantitative analysis was performed using an Agilent 7890A gas chromatograph 266
(Agilent Technologies, Santa Clara, California, USA) equipped with a split/splitless inlet and 267
a 7683B autosampler coupled with an Agilent 5975C Inert XL MSD Mass Spectrometer with 268
an electron impact ion source, quadrupole analyzer, and triple-axis detector (Agilent 269
Technologies, Santa Clara, California, USA).
270
The samples were injected in split mode at a ratio of 1:10. The inlet temperature was 271
280 °C. The injection volume was 1 µL. A J&W DB-5MS ultra inert (Agilent Technologies, 272
Santa Clara, California, USA) capillary column was used with dimensions of 30 m × 0.25 mm 273
I.D. × 0.25 μm film thickness. The carrier gas was helium (purity: 5.0, Messer Hungarogáz 274
Kft., Budapest, Hungary) with a flow rate of 2.0 mL/min. The oven temperature was 100 °C 275
initially, then it was raised to 250 °C, at a rate of 30 °C/min. This temperature was maintained 276
for 4.5 min, then increased to 320 °C for 2.3 min at a rate of 30 °C/min. The final temperature 277
was maintained for 4 min. The electron impact (EI) ion source of the mass spectrometer was 278
applied with 70 eV ionization energy. The temperature of the ion source was 230 °C and the 279
Journal Pre-proof
10
quadrupole analyzer operated at 150 °C. The mass spectrometer was tuned with 280
perfluorotributylamine (PFTBA, CAS: 311-89-7). For the quantitative analysis, single ion 281
monitoring (SIM) mode was used. The qualifier and quantifier ions of target compounds are 282
summarized in Table 1. The GC-EI-QMS was controlled using Agilent MSD ChemStation 283
(E.02.02) software.
284
2.6. Data Evaluation
285
2.6.1. Swelling degree 286
From the mass of the initial (mdry) and swelled (mswelled) plastic specimen, the swelling 287
degree (SD%) can typically be determined using the following formula:
288
. (2)
But the migration of additives causes a considerable decrease in the weight of the specimen, 289
so it was decided that the adjusted swelling degree (ASD%) should be calculated instead:
290
, (3)
where cV,mig,i is the mass concentration of i additive (mass of migrated i additive normalized to 291
the volume of food simulant) and Vsimulant is the volume of the food simulant. To investigate 292
the swelling kinetic, ASD% was plotted as the function of contact time.
293
2.6.2. Surface normalized concentration of the migrant 294
Based on the measured dimensions (length, width, and height), the surface area of 295
each specimen (Aspecimen) was calculated. The results of quantitative analysis with GC-EI- 296
QMS give information about the mass concentration of additive i in the food simulant 297
(cV,mig,i). To consider the slight differences in the size of the test specimens, the surface 298
normalized concentration of the migrants (cA,mig,i) was calculated from cV,mig,i: 299
. (4)
On the migration kinetic curves, cA,mig,i was plotted as the function of contact time. The extent 300
of migration was characterized by the maximum value of cA,mig,i for all cases, regardless of the 301
presence or lack of a steady-state at the end of the migration experiment.
302
2.6.3. Pearson’s correlation test 303
Journal Pre-proof
11
The supposed relationship between the swelling of the plastic and the additive 304
migration was investigated using Pearson’s linear correlation test. Therefore, ASD% was 305
plotted as the function of cA,mig,i, and Pearson’s correlation coefficient (PCC) was calculated 306
using OriginPro 2018 (OriginLab Corporation, Northampton, Massachusetts, USA). When 307
the PCC value was above 0.9000, a strong correlation was assumed between ASD% and 308
cA,mig,i. 309
Journal Pre-proof
12 2.6.4. Empirical semivariogram
310
Empirical semivariograms were calculated and plotted to assess the temporal 311
autocorrelation structure of the concentrations of migrants and swelling degrees. Kovács et 312
al. (2012) give a description of the variogram in which Z(x) and Z(x+h) represent two of the 313
values measured for a particular parameter, and these two are at a distance h from each other.
314
The distance h might be distance in time or in space. Proceeding from this, a value for the 315
variance of the difference of Z(x) and Z(x+h) can be found, thus:
316
[ ] [ ] [ ] [ ]. (5) Furthermore, if it is the case that the samples under consideration derive from the same 317
population, then the following assumption may be made 318
[ ] [ ], (6)
and therefore 319
[ ] [ ] [ ] (7) The function expressed by 2γ(h) is the parameter’s variogram, and from this, γ(h) then 320
represents its semivariogram. With the use of simplified notation 321
[ ] , (8)
and 322
[ ] , (9)
323 so
(10)
It is then possible to use the Matheron algorithm (Matheron, 1965) to calculate the empirical 324
semivariogram 325
∑ [ ]
(11)
in which N(h) is the number of pairs to be found within a lag interval h.
326
In this study, Z(x) corresponds to the value of the parameter measured (e.g. ASD%, cA,mig,i) in 327
time t and h to the time interval.
328
Journal Pre-proof
13
Of the semivariograms thus obtained, four types can be distinguished:
329
a) When the semivariogram increases continuously over the distance (be it time 330
or space) examined. In this case, the given process does not reach a steady- 331
state.
332
b) When the values of the empirical semivariogram fluctuate randomly around a 333
constant after the initial rise. In general, the value at which this occurs on the 334
vertical axis is called a sill. On the horizontal axis, it is called range. Since in 335
the present work variography is applied to kinetic curves, these range values 336
specify the starting points (in time) of the steady-state.
337
c) When the empirical semivariogram on the vertical axis does not start from the 338
origin, or the initial ascending part of the curve is missing, so the points of the 339
semivariogram fluctuate around the variance, a nugget-effect type variogram is 340
obtained. It should be noted that this effect may result from inadequate 341
sampling or measurement errors (Hatvani et al., 2012).
342
d) When the increase ends with variation around a constant, and this is repeated a 343
number of times, i.e multiple ranges can be determined. This type of 344
semivariogram is called a nested semivariogram. It indicates that more than 345
one process has an influence on the variation of the data.
346
2.6.5. Analysis of variance (ANOVA) 347
The significance of differences was tested using ANOVA. The normal distribution of the 348
data was verified using the Shapiro-Wilk test (Shapiro & Wilk, 1965), the homoscedasticity 349
assumption was assessed by Bartlett’s test. Due to the absence of homoscedasticity, Welch’s 350
ANOVA was used, after which the Games-Howell post-hoc test was applied to compare all 351
possible pairs of additives (Welch, 1951). In the significance tests the maximum migrated 352
concentrations were compared for each of the PP and PLA samples. The same analysis was 353
performed with adjusted swelling degree data.
354
3. Results and discussion
355
3.1. Mechanical and thermal properties of produced plastics
356
The main mechanical and thermal properties of the plastics examined are summarized 357
in Table 2. MFR gives information about the flow properties of plastics, indirectly about their 358
molecular weight and dynamic viscosity in a molded state. The presence of a plasticizer in 359
Journal Pre-proof
14
PLA moderately influences the mechanical and thermal properties. PLAs containing TBAC or 360
TOTM have an increased MFR value compared to the reference plastic. Plasticizers also 361
change the glass transition temperature (Tg) by slightly decreasing it. In the first heat cycle in 362
the DSC analysis of PLA, the exotherm peak of cold-crystallization appears: Tcc of PLA 363
reference was 95.3 ± 0.3 °C, which fell to 86.3 ± 0.3 °C and 81.0 ± 0.1 °C due to TBAC and 364
TOTM, respectively. Some increase in the MFR value can be observed for BHT and Uvinul 365
3039 as well, but the other parameters show no distinct tendencies. Compoundation of PP 366
with additives (besides the Irgafos 168 that it originally contained) resulted in the increase in 367
MFR, irrespective of the function of additives. Otherwise, plastic additives at this level of 368
concentration hardly influence the thermal and mechanical properties of PP.
369
3.2. Swelling of PLA and PP in isooctane and ethanol 95 v/v%
370
3.2.1. The effect of food simulant on swelling 371
Even though isooctane and ethanol 95 v/v% are both commonly used as solvents to 372
substitute fatty food in migration tests, their physical-chemical characteristics differ 373
considerably. The difference can be observed in their ability to swell PP and PLA, as well.
374
Figures 1.A and 1.C show the swelling kinetic curves of the reference PLA (no additive) and 375
PP (with only Irgafos 168) samples, respectively.
376
The swelling of PLA in isooctane was negligible. Moreover, a slight but 377
unquestionable mass reduction was observed. Since this plastic did not contain any plastic 378
additive, this weight reduction cannot be explained by the migration of any substance. It 379
might be supposed that the decrease is the result of polymer degradation or solubilization. The 380
non-swelling effect of isooctane on PLA was also reported by Sato et al. (2012), however the 381
solubility test they performed lasted only for 24 hours, and the contact temperature was only 382
35 °C.
383
Ethanol molecules are smaller than isooctane molecules and their polarity is closer to 384
that of PLA. Consequently, PLA swelling in ethanol 95 v/v% shows a different pattern. In this 385
case, in the thirteen days of the experiment, the swelling could not reach a lasting steady-state.
386
As the semivariogram in Figure 1.B shows the increase of the ASD% came to a short halt at 387
112 h, but then it continued without reaching any further steady-states. The maximum value 388
of ASD% (equal to SD% in this case) was 2.8 ± 0.03%. Comparing this result to the work of 389
Iñiguez-Franco et al. (2012), the notable effect of test specimen thickness on swelling can 390
Journal Pre-proof
15
be seen: they found that neat PLA film (with 27.9 ± 9.9 µm thickness) reached swelling 391
equilibrium almost immediately with 6% ethanol sorption.
392
PP swells in both food simulants, however; due to its non-polar character, the 393
absorption of isooctane is more than one order of magnitude higher than that of ethanol. In 394
isooctane, the ASD% increases up to 165 h (based on its empirical semivariogram), at which 395
point a long-lasting steady-state starts at 8.9 ± 0.15%. On the other hand, the swelling of PP in 396
ethanol 95 v/v% shows an unconventional pattern (Figure 1.D). After the initial increase of 397
ASD% a steady-state starts to form at 68 h, but instead of stabilizing permanently, the ASD%
398
starts to increase again to reach a second plateau at 0.24 ± 0.01%, starting at 210 h. This 399
results in a nested semivariogram, and this behaviour suggests that the swelling advances 400
layer by layer, in accordance with the fact that polymer chain orientation varies along the 401
cross-section of test specimens. This heterogeneity in chain orientation is the result of 402
fountain flow in the injection molding process.
403
3.2.2. The effect of plastic additive’s function on swelling 404
The kinetic curves of the swelling of the various PLA samples in ethanol 95 v/v% and 405
that of PP samples in isooctane – i.e. the solvent having a stronger swelling effect – are 406
presented in Figures 2.A and 2.B. As expected, they show that plasticizers (TBAC and 407
TOTM) promote the swelling of both polymers. The maximum values of ASD% in the case of 408
PLA with no additive (reference), PLA–BHT, PLA–Ionox 220, and PLA–Uvinul 3039 are 409
between 2.8 ± 0.03% and 3.1 ± 0.03% in ethanol 95 v/v%. The statistical analysis proved that 410
there is no significant difference (α=0.05) in the swelling of neat and antioxidant or UV 411
stabilizer spiked PLA, even though the MFR values of the PLA–BHT and PLA–Uvinul 3039 412
plastics are moderately elevated compared to the reference PLA. Meanwhile, the maximum 413
ASD% of PLA–TBAC and PLA–TOTM are 6.4 ± 0.10% and 4.3 ± 0.23%, respectively. This 414
increase in the ASD% values of the two plasticizer-spiked PLAs is a result of the polymer 415
chain mobilizing effect of these additives.
416
The ASD% values for PP in isooctane at the end of the experiment for the plastics with 417
various additives fall within a narrow range (8.8 ± 0.08%–10.7 ± 0.10)%. However, the 418
statistical analysis revealed significant difference between PP with stabilizers and PP with 419
plasticizers. The plasticizing effect which facilitates easier swelling is even more apparent in 420
the slopes of the kinetic curves in the first 4 days of the experiments. Due to the faster 421
swelling, PP–TBAC and PP–TOTM reaches the steady-state at 44 h and 60 h, respectively.
422
Whereas, the samples without plasticizer took about 113–167 h to reach the final degree of 423
Journal Pre-proof
16
swelling. These results imply that the ASD% of PLA samples may eventually rise to a similar 424
value, too. But 13 days’ contact time was clearly not enough to reach the equilibrium of the 425
PLA–ethanol system.
426
3.3 Migration of additives
427
3.3.1. Migration in different polymer-solvent systems 428
The surface normalized concentrations of the migrated additives as a function of time 429
provided different patterns for each of the polymer–food simulant pairs. In all cases, 430
significant differences (α=0.05) were found using Welch’s ANOVA among the maximum of 431
migrated concentrations (see Table 3). Furthermore, the significant difference for all possible 432
pairs was confirmed using the post-hoc test. As an example, both the swelling and migration 433
kinetic curves of the polymers containing TBAC are presented in Figure 3, whereas Table 3 434
lists the maximum observed concentrations of every additive. Isooctane does not swell PLA, 435
consequently, the additives appearing in the solvent within the 13 days come from the surface 436
layer of the plastic. Thus, the concentrations in the isooctane phase remain so low that their 437
measurement could be carried out only with a relatively high degree of uncertainty.
438
Furthermore, the mass transfer from the surface is prompt. As a result of these two factors, 439
nugget-effect type semivariograms were obtained for all additives in the PLA–isooctane 440
system.
441
In the PLA–ethanol systems for all additives, the maximum of the surface normalized 442
concentrations was three orders of magnitude higher. Within the 13 days of the experiments, 443
equilibrium could not be reached for any of the additives. Both the swelling and the migration 444
curves show an indisputably increasing trend, even though the rate of the increase is not 445
constant: at least one short halt can be detected in all cases.
446
For PP, the situation is reversed. Ethanol can only slightly penetrate PP, but isooctane 447
swells it considerably. Consequently, migration of the additives studied from PP into 448
isooctane gave typically concentrations in the solvent phase one order of magnitude higher 449
than that into ethanol 95 v/v%. With the exception of BHT, the migration curves in the PP–
450
isooctane systems showed a dynamically increasing initial part, which between 63 h and 255 451
h turned into a presumably long-lasting steady-state. But the migration of BHT into isooctane 452
slowed down for a short while and then increased again to reach a lasting steady-state at 453
163 h. Such changes in the rate of increase of the migrated concentrations were, however, 454
much more characteristic of the PP–ethanol systems. These halts and plateaus in the increase 455
of surface normalized concentrations in the liquid phase of the PLA–ethanol and the PP–
456
Journal Pre-proof
17
ethanol systems indicate that not only the swelling, but also the migration proceeds layer by 457
layer. The observation of this phenomenon was facilitated by the use of unusually thick test 458
specimens.
459
The effect of swelling on the migrant concentrations can be observed clearly on the 460
maximum values of surface normalized concentrations as well. For all additives, the highest 461
concentrations were observed when PP was in contact with isooctane, that is, where the 462
swelling was the most intense. A similar observation was made by Alin & Hakkarainen 463
(2010), who investigated the migration of two antioxidants (Irganox 1010 and Irgafos 168) 464
from PP-based FCP into various food simulants by microwave irradiation. In their research 465
they found that the amount of Irganox 1010 and Irgafos 168 was approximately 40 and 20 466
times higher in isooctane than in ethanol 95 v/v%, respectively (Alin & Hakkarainen, 2010).
467
Isooctane with PLA provided the lowest concentrations, in agreement with the lack of 468
swelling. Ethanol was absorbed by both PLA and PP, but not to the same extent. The ASD%
469
values for PLA samples were about one order of magnitude higher than those for the PP 470
samples. Accordingly, for every additive, the concentrations in ethanol 95 v/v% were higher 471
when they migrated from the PLA.
472
3.3.2. Molecular weight of additives and migration 473
For the comparison of the observed concentrations in the food simulants across the 474
different additives, one must take into consideration the fact that for the preparation of the 475
plastics, the additives were applied in different mass ratios. Figure 4 shows the surface 476
normalized concentrations divided by the applied mass ratios for both PLA and PP.
477
For the stabilizer additives (BHT, Ionox 220, Uvinul 3039, and Irgafos 168), a clear tendency 478
can be observed in the migration concentrations: as the molecular weights of the additives 479
increase, the migrated concentrations decrease. The diffusion of chemical compounds is an 480
essential part of migration from plastics which thus depends directly on the hydrodynamic or 481
Stokes radius of the migrating molecule at a given temperature and hence, indirectly, on its 482
molecular weight. Beyond molecular weight, the size and shape of the migrating compound, 483
and its affinity to the formation of intermolecular interactions can be essential in the process 484
of migration. Samsudin et al. (2014) in their work compared their results (for astaxanthin 485
release) with previous antioxidant migration studies from PLA. They noticed that the 486
diffusion coefficient of BHT (Ortiz-Vazquez et al., 2011) is at least twice as high as any 487
other antioxidant's. The presumed explanation for the higher migration rate was the BHT 488
molecule's non-bulky structure, compared to the other compounds examined. Samsudin et al.
489
Journal Pre-proof
18
(2014) also considered the theory of Iñiguez-Franco et al. (2012) concerning the number of 490
hydroxyl groups in the migrating compound molecule, which speculates that the presence of 491
this functional group decreases the release rate.
492
The pattern expected on the basis of the additives’ molecular weight is disturbed by 493
the plasticizers. According to the molecular weight of the additives, the expected order of 494
maximum migration concentration would be: Irgafos 168 (PP only) < TOTM < Ionox 220 <
495
TBAC < Uvinul 3039 < BHT. However, in PLA the order was: Ionox 220 < TOTM < Uvinul 496
3039 < BHT < TBAC; while in PP it was: Irgafos 168 < Ionox 220 < Uvinul 3039 < BHT <
497
TOTM < TBAC. The reason of the change is the chain mobilizing effect of the plasticizers.
498
TBAC facilitated its own diffusion among the polymer chains of both PLA and PP to 499
such an extent that its migration concentrations went higher than that of all the smaller 500
stabilizer additives (BHT, Ionox 220 and Uvinul 3039). In the PP–isooctane system, the same 501
happens for TOTM, hence its curve on Figure 4 closely approaches that of TBAC instead of 502
Irgafos 168. But the plasticizing effect of TOTM in PLA was not as intense as that of TBAC.
503
As Figure 2.A shows, the swelling of PLA–TOTM is approximately in the middle between 504
the PLA–TBAC and the other PLA-based plastics. This is in accordance with the picture in 505
Figure 4, in which its curve moves just a bit above that of Ionox 220 even though its higher 506
molecular weight would suggest otherwise. On the other hand, the plasticizing effect of 507
TOTM was enough for a moderate enhancement of the swelling, which in turn was able to 508
facilitate its migration somewhat over the migration of the next additive in line. But this effect 509
was not strong enough to elevate this migration to the level of the smaller additives, let alone 510
TBAC.
511
3.4. Correlation between swelling degree and migrated concentration of additives 512
Both swelling and migration kinetic curves displayed various shapes. As detailed in 513
the previous sections, there were occasions when the change in the relevant parameter was 514
small compared to the degree of uncertainty in its measurement. In the case of the most 515
intense swellings and migrations, the curves reached a steady-state after a consistent increase 516
at the beginning of the experiments. A stepwise increase was also often observed. Even amid 517
this great variety, the corresponding swelling and migration curves always followed the same 518
pattern. To demonstrate that the similarity in the shapes of the curves is a result of a strong 519
relationship between the two processes, ASD% and cA,mig,i values were correlated. Since the 520
isooctane absorption of PLA was negligible, these cases were not considered. For all the other 521
polymer–additive–solvent systems the obtained Pearson’s correlation coefficients showed a 522
Journal Pre-proof
19
strong linear correlation, as they ranged between 0.9664 and 0.9924, except for Uvinul 3039 523
in PP–isooctane, for which the value was 0.9134.
524
Figure 5 demonstrates the relation between the swelling and migration curves of the 525
PLA–Uvinul 3039 (Figure 5.A) and the PP–BHT (Figure 5.B) samples in contact with 526
ethanol 95 v/v%. Their respective semivariograms are also shown. Both of these curves show 527
stepwise processes. In the case of PLA–Uvinul 3039, neither the swelling nor the migration 528
could reach steady-state. Still, short halts in the increase of the respective parameter can be 529
observed. The presence of these is confirmed for both curves by their nested semivariograms.
530
Moreover, with the help of the variograms, the starting points of these halts can be identified.
531
As Figure 5.A shows, in this case starting points on the two curves follow each other closely, 532
there is no significant difference between the time pairs.
533
Figure 5.B also shows a stepwise increase for both swelling and migration for the PP–
534
BHT samples. In this case, however, the starting points in the migration curve are 535
considerably delayed with respect to those in the swelling curve. As a result, only two starting 536
points can be detected in the migration curve within the 13 day timeframe of the experiment, 537
whereas the swelling curve has three. It is safe to assume that over the 13 days, a further 538
increase in the concentration of BHT in the ethanol 95 v/v% could be observed.
539
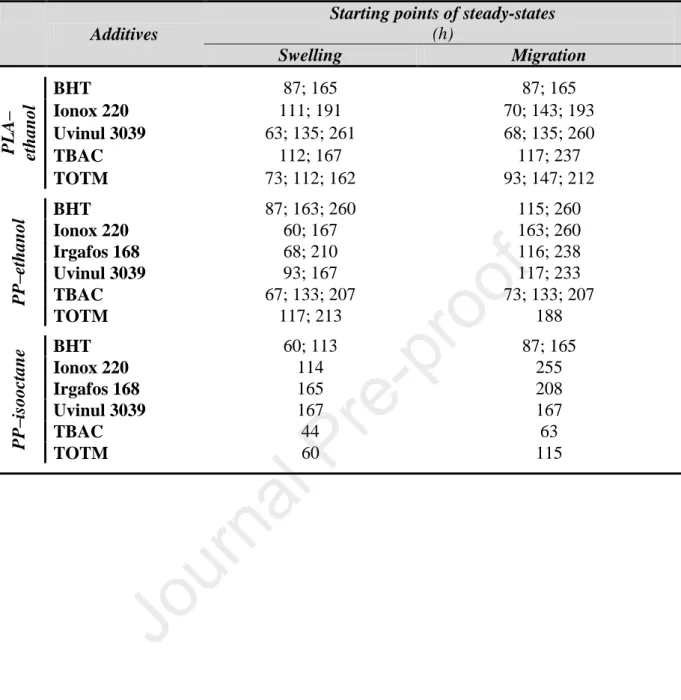
The starting points identified by the semivariograms for the other polymer–additive 540
pairs are listed in Table 4. Most of the data follow one or other of the above-described 541
patterns: practically equal starting points or considerably delayed migration. In some cases 542
(e.g. PP–Uvinul 3039 in ethanol 95 v/v%), the delay at the first detected point is negligible, 543
but by the second plateau, the delay becomes obvious. Either way, the migration always 544
follows the swelling, even if closely. The only exception seems to be Ionox 220 migrating 545
from PLA to ethanol 95 v/v%. In this case, the first halt in the migration is so short that the 546
corresponding halt in the swelling curve could only be detected after increasing the frequency 547
of the sampling. Unfortunately, the presence and the extent of the delays shows no apparent 548
pattern. Consequently, the time necessary to reach a steady-state on the migration curve 549
cannot be predicted on the basis of the swelling curve.
550
Journal Pre-proof
20
4. Conclusions
551
In the present work, the time dependence of the migration of commonly used plastic 552
additives from polylactic acid (PLA) and polypropylene (PP) to ethanol 95 v/v% and 553
isooctane was investigated in 13 day long experiments. Alongside the measurement of the 554
concentration of the additives in these food simulants, the swelling of the test specimens was 555
followed. As expected, a strong correlation was observed between the two processes.
556
PLA cannot be swelled by isooctane, but it is penetrated by ethanol, whereas PP is 557
swelled to a great degree by isooctane and only slightly by ethanol. For all polymer-food 558
simulant pairs, where swelling can be observed, the addition of plasticizers increased the rate 559
and degree of swelling, though this change had a smaller effect than changing the polymer or 560
the food simulant in the experimental setting.
561
Both for swelling and migration, a stepwise increase in the relevant parameter was 562
observed. Short halts in the increase were characteristic rather of the PLA–ethanol systems, 563
whereas clear plateaus formed when PP was in contact with ethanol 95 v/v%. The kinetic 564
curves of the PP samples in isooctane were, in general, more regular: they consisted of a 565
dynamically increasing initial part, which turned into a lasting steady-state.
566
Regardless of the shape of the kinetic curves, for all additives the greater the swelling, 567
the higher migration concentrations observed. This relation between swelling and migration 568
has an important implication. Whenever isooctane and ethanol 95 v/v% as simulants are used 569
for fatty food instead of vegetable oil, the decision on the compliance of the tested plastic 570
must be based on the highest observed migration concentrations to ensure food safety. If the 571
migration tests are performed only in the solvent that provides these higher concentrations, 572
the number of experiments can be about half of what would otherwise be allotted. The results 573
presented here suggest that for additives that are well soluble in both simulants, the solvent 574
that can better penetrate the plastic should be used. On the other hand, using a solvent that 575
swells the polymer much better than vegetable oil will probably result in the extreme 576
overestimation of the migration.
577
The diffusion of the additives is an essential part of their migration to food simulants.
578
So, the hydrodynamic or Stokes radius of the migrating molecule and thus, indirectly, the 579
molecular weight may be expected to influence the concentration of the migrants.
580
Accordingly, the migration of stabilizers from PLA to ethanol 95 v/v%, as well as from PP to 581
isooctane decreased with increasing molecular weight. But the migration of TBAC was 582
stronger in both cases, even though its molecular weight is bigger than that of BHT and 583
Journal Pre-proof
21
Uvinul 3039. This means that the promoting effect of plasticizing on swelling and thus 584
migration outweighed the demoting effect of the higher molecular mass.
585
The strong correlation between the swelling degree and migration concentrations was 586
confirmed by the fact that the values of Pearson’s correlation coefficients were over 0.9100.
587
Furthermore, variography was successfully employed in the determination of the start of 588
plateaus on the kinetic curves. In the case of PLA–isooctane systems, nugget-effect type 589
empirical semivariograms were obtained due to the low level of migration and the 590
comparatively high uncertainty of the concentration results. But for all other cases, the 591
semivariograms could objectively highlight the starting points of both short halts and 592
somewhat longer plateaus in the increase of either the swelling degree or the migrant 593
concentration. The result thus obtained unambiguously showed that migration, either closely 594
or loosely, nonetheless strictly follows the swelling even in the case of multiple-level curves.
595
All these results prove that the extent of the migration of a certain additive should not 596
be estimated solely on parameters characterizing the materials alone (additive, polymer and 597
food simulant). Rather, it is the interactions between these parameters, especially the 598
plasticizing effect of either the additive or the solvent, that are fundamental.
599