B
H
OC
C
ASI
ON
AL PAP
ER S
24
Adopting the euro in Hungary:
expected costs, benefits and timing
Edited by
Attila Csajbók – Ágnes Csermely
ADOPTING THE EURO IN HUNGARY:
EXPECTED COSTS, BENEFITS AND TIMING
EDITED BY ATTILA CSAJBÓK – ÁGNES CSERMELY
NBH
OCCASIONAL PAPERS
(24)
The views expressed are those of the authors
and do not necessarily reflect those of the National Bank of Hungary.
Written by Zsófia Árvai, Attila Csajbók, Ágnes Csermely, Zoltán Gyenes, Ágnes Horváth, Gábor Kiss, Mihály András Kovács, Viktória Kovács, Judit Krekó,
Éva Papp, Zoltán Szalai, Balázs Világi and Balázs Vonnák Edited by Attila Csajbók and Ágnes Csermely E-mail: csajboka@mnb.hu, csermelya@mnb.hu
Published by the National Bank of Hungary Krisztina Antalffy, Director of Communications
www.mnb.hu
ISSN 1216-9293
TABLE OF CONTENTS
I. SUMMARY 5
Quantifying costs and benefits 6
Abandoning monetary autonomy and the effect on business cycles 9
Timing of joining the euro area 12
II. HUNGARY’S MATURITY FOR EURO AREA PARTICIPATION 15
II.1. Hungary and the less advanced EU member states
five years prior to currency union membership 18 II.2. Equilibrium level of Hungarian inflation in the event of entry
into monetary union 26
III. COSTS OF JOINING THE EURO AREA 36
III.1. Integration and structural similarity 44 III.1.1. Similarity of economic structures 44 III.1.2. Integration of the Hungarian economy into the euro area 52
III.1.3. Business cycle linkages 61
III.2. Adjustment to asymmetric shocks 72
III.2.1. Price adjustment 72
III.2.2. Wage adjustment 74
III.2.3. Labour mobility 76
III.2.4. Adjustment via fiscal policy 78
III.2.5. Financial integration, international risk sharing
and asymmetric shocks 82
III.3. Effects of the common monetary policy 83 III.3.1. Optimality of the uniform interest rate policy
for the Hungarian economy 83
III.3.2. Efficiency of monetary transmission 89
III.4. Seigniorage loss as a result of entering monetary union 97
IV. BENEFITS OF JOINIG THE EURO AREA 104
IV.1. Gains from reduced transaction costs 104
IV.2. Gains from foreign trade expansion 112
IV.3. Benefits of a reduction in exposure to financial contagion 121 IV.4. Effect of falling real interest rates and more favourable
opportunities to borrow abroad on economic growth 125 IV.4.1. Expected fall in real interest rates as a result of joining
the euro area 127
IV.4.2. NIGEM model simulation 133
IV.4.3. Compact, calibrated exogenous growth model simulation 136 IV.4.4. Summarising the results of the NIGEM simulation
and the compact calibrated model 138
V. TIMING OF EURO AREA ENTRY 140
V.1. Time schedule of accession 149
V.2. Elements of the Hungarian convergence programme
and prospective costs of convergence 149
V.2.1. Fiscal adjustment 150
V.2.2. Reducing inflation 155
V.2.3. Prospective costs of convergence
in the light of international experience 161
VI. APPENDICES 170
VI.1. Effects of negative external demand shocks
on Hungarian gross domestic product 170
VI.2. Identifying supply and demand shock
using structural VAR estimates 176
VI.3. The model used to estimate foreign trade expansion 183 VI.4. Description of the calibrated growth model 185
GLOSSARY 189
REFERENCES 193
I. SUMMARY
Accession to the Economic and Monetary Union is one of the most important steps in Hungary's European integration, which will entail abandoning the national currency and adopting the euro as domestic legal tender. For Hungary as a new member state in the EU, introduction of the euro will not be an option but an obligation.
Nevertheless, new EU members will have some leeway to set the date of adopting the euro1. Therefore, it is useful to analyse the likely costs and benefits of joining the euro area for Hungary and to define the choice of medium-term economic policy strategy in the light of the results of this analysis. The National Bank of Hungary would like to contribute to the formulation of an economic policy strategy by issuing this volume, which contains a cost-benefit analysis of the likely effects of the country's joining the euro area. This analysis is confined strictly to the economic benefits and costs of introducing the euro and is not intended to examine its other possible impacts, including, for example, the implications for politics and national security.
Adopting the euro will likely have a permanent impact on Hungarian economic growth. This impact will become evident through numerous channels. Bank staff have attempted to quantify and sum up the extent of this impact transmitted through the various channels. The findings of this analysis suggest that the intro- duction of the euro will bring about significant net gains in growth.However, wel- fare is influenced not only by the level and rate of GDP growth, but their stability as well. A widely fluctuating national income will produce lower welfare than a more stable one, even if on average the two income levels are identical. For this reason, it is important to examine whether joining the euro area will increase or mitigate the volatility of business cycles. In other words, the key question is whether Hungary and the euro area form an optimum currency area, that is whether the monetary policy of the euro area is capable of adequately substituting independent Hungarian monetary policy in smoothing out cyclical fluctuations. In the findings of this analysis, the euro area seems to be in most respects at least as optimal a currency area for Hungary as for less developed euro area member countries.
1One example of the current EU member states is Sweden, which even though committed to joining the euro, has been postponing it by staying outside the ERM II. By contrast, Great Britain and Denmark have an official opt-out. The new EU members did not request an opt-out, and probably they would not have received one.
Quantifying costs and benefits
In estimating the likely costs and benefits of monetary union, it is very important to clarify to which alternative path those costs and benefits are related. The alter- native path used in our study reflects possible economic developments if Hungary enters the EU at a relatively early stage, but refrains from adopting the common currency for some reason, pursuing independent monetary and exchange rate policy strategies. This study assumes successful disinflation and continued income convergence towards the euro area even in the staying-out scenario. However, if Hungary stays out from currency union, disinflation will entail higher real economic sacrifices, due to the costs of accumulating and preserving central bank credibility.
Disinflation undertaken with a well-defined purpose and time-horizon of joining the euro area would probably enjoy higher credibility and thus would be less costly.
As this credibility gain arising from the presence of an early EMU-entry date cannot be quantified, it has not been accounted for in our cost-benefit analysis, but its significance will be stressed when determining the optimal timing of joining the euro area.
The methodology of estimating the costs and benefits is necessarily eclectic, but Bank staff have attempted to confirm the calculations from several aspects, taking account of recent theoretical and empirical findings in the international academic literature.
The analysis quantifies three key benefitsarising from euro area membership, in the form of gains from reduced transaction costs, expansion of foreign trade and a drop in real interest rates(and the simultaneous easing of the current account constraint).
Maintaining a country’s own currency can be viewed as an administrative restriction causing welfare losses to society, since part of the physical and human resources are tied up due to this very restriction. These losses appear in the form of transaction costs incurred by firms and households. One group of transaction costs is conversion costs, comprising fees and commissions charged by banks and other financial intermediaries for converting euros into forints (and vice versa) and of bid-ask spreads. The other group contains in-house costs incurred by firms engaged in foreign currency transactions, due to extra administration and risk management
tasks associated with these transactions. Giving up a national currency will reduce these transaction costs and the reallocation of resources released in this way may raise the level of GDP. Estimates of the magnitude of transaction costs are partly derived from data for Hungarian foreign exchange market turnover and from the size of commissions, and partly from international estimates. Thus, Bank staff estimate that the gains from reduced transaction costs will cause a one-off rise in the level of GDP of 0.18-0.30 of a percentage point.
The bulk of international empirical research suggests that maintaining an inde- pendent currency will also have an adverse effect on external trade. In contrast, currency union with major trading partners will boost a country’s external trade, leading to higher growth via various externalities (such as technology and know-how transfer). In this analysis, we have used a methodology that has recently gained popularity to gauge such effects on external trade and growth.
The approach is based on gravity models and large panel data to estimate the effect of a currency union. Accordingly, the adoption of the euro may raise GDP growth by 0.55-0.76 of a percentage point over the long run, via the expansion of external trade.
Domestic interest rates currently contain a risk premium component to compensate non-resident investors for the uncertainty about movements in the exchange rate.
The switch to the euro will remove this premium from domestic nominal rates, causing real rates to be lower. A lower level of real interest rates will in turn encourage domestic investment. Furthermore, once in the euro area, investment can grow unhindered by current account deficits, as depreciation will cease to be a threat to non-resident investors. Thus, the adoption of a common currency will help the country maintain macroeconomic equilibrium even in the face of a higher current account deficit, thanks to the removal of a major restraint on investment growth.
More buoyant investment will, over the longer term, boost economic growth and accelerate convergence towards the average income level within the EU. To quantify this additional growth, Bank staff have first estimated the size of the expected reduction in the risk premium following the euro changeover, using information inherent in the forint yield curve. Using as input the reduction in real rates obtained in this way, two different models were employed to estimate the effect on growth in numerical terms. The findings suggest that the common
currency will raise the rate of GDP growth by 0.08-0.13 of a percentage point over the longer term via lower real rates of interest.
A quantifiable cost of abandoning autonomous monetary policy arises from giving up part of the government’s revenue from seigniorage. Once inside the monetary union, Hungary will also share the seigniorage revenues arising from the use of euro notes and coins. However, due to accounting rules, this share will likely be lower than if the National Bank had retained its right of issue. Estimates suggest that lower seigniorage revenues will cause an annual loss in the range of 0.17–0.23 of a percentage point in the levelof GDP.
When summarising the benefits and costs, it creates some difficulty that the euro- induced increases/decreases in GDP are distributed across time in a way that is not identical or not known for each individual mechanism. Savings arising on lower transaction costs will presumably appear over the very short term, pushing up the level of GDP. The same applies to the losses caused by the lower seigniorage.
Therefore, it seems plausible to treat the benefits and costs of entering monetary union associated with these two items as changes in the level of GDP.
The situation is different with regard to the benefits arising from the reduction in real rates, the subsequent pick-up in investment and the expansion of external trade. Here, GDP growth will unfold fully only over the longer term, justifying the expression of these benefits as changes in the growth rate of GDP. When quantifying these two effects, the assumption is that GDP will reach the higher level estimated for the long term (20 years) by growing at an even pace. The benefit obtained from joining the euro area is expressed in the form of average annual gain in growth calculated in this way.
It is important to distinguish between the short-term benefits and costs affecting the level of GDP and those affecting its rate of growth only in the longer run. Being approximately equal in size, the quantifiable short-term benefits and costs (i.e.
the gains from reduced transaction costs and the loss due to lower seigniorage) effectively cancel each other out. The sum of the estimated long-term benefits reflects significant net gains, as euro area membership may raise the growth rate of Hungarian GDP by 0.6 to 0.9 of a percentage point in terms of a long-term (20-year) average.
Table I-1
Effect of short-term factors on (the level of) GDP as a percentage of GDP
Reduction in transaction costs (+) 0.18–0.30 Change in seigniorage revenue (–) –0.17– –0.23
Net effect 0.01–0.07
Table I-2
Effect of long-term factors on GDP growth (percentage points)
Reduction in real rates (+) 0.08–0.13
Expansion of external trade (+) 0.55–0.76
Net effect 0.63–0.89
Abandoning monetary autonomy and the effect on business cycles
The welfare cost of abandoning the national currency and autonomous monetary policy is determined by the extent to which business cycle volatility increases in the wake of joining the euro. This in turn greatly depends on the exposure of the Hungarian economy to asymmetric shocks, that is unexpected disturbances in the economic environment affecting Hungary and the euro area to differing degrees.
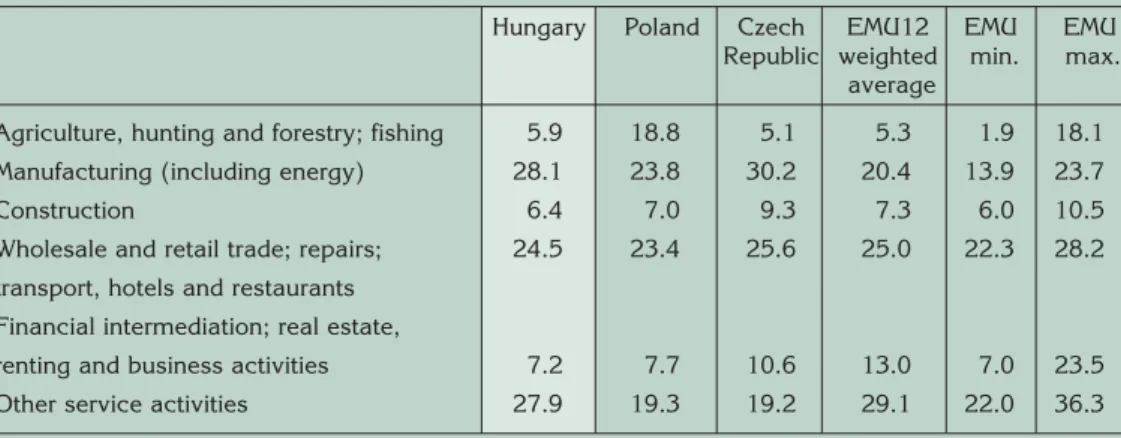
This study claims that the incidence of asymmetric shocks is no more likely in Hungary than in current less-developed members of the euro area.
The first reason for this is that integration of Hungarian economy and trade towards the euro area appears to be on a par with that achieved by current members, in terms of both quantitative indicators (such as the size of trade with the euro area) and qualitative indicators (such as export/import structure, weight of intra-industry trade and penetration of high value added markets).
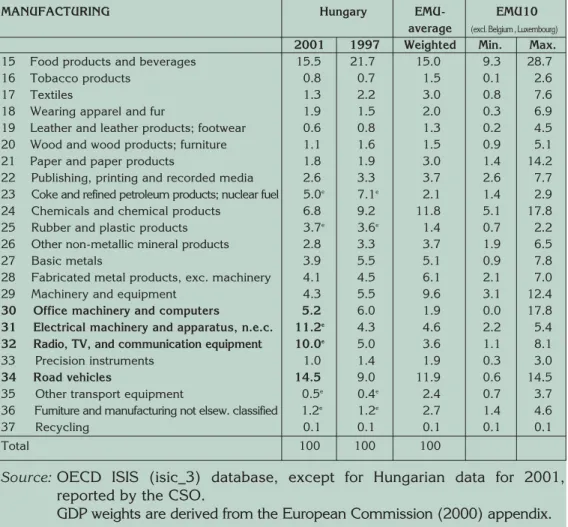
Secondly, the structure of the Hungarian economy, in terms of the contribution of individual sectors to GDP and employment, does not significantly differ from the euro area average. Thus, sector-specific shocks tend to have a similar effect in the euro area as in Hungary. Hence, common monetary policy responses to such
sectoral shocks at the euro area level also appear to be optimal in the case of Hungary. There exists a certain degree of asymmetry regarding a few specific industries within manufacturing, but this does not exceed the asymmetry experienced by the current smaller euro-area members.
The third reason is that since the middle of the past decade, the Hungarian business cycle has been increasingly in line with that in western Europe, at least as much as the business cycles of peripheral euro area members in respect of some indicators.
Provided that this trend is permanent, the anti-cyclical monetary policy of the European Central Bank will be suitably timed, with a cyclical smoothing effect on the Hungarian economy.
Abandoning independent monetary policy will entail a smaller loss in welfare provided there exist effective market mechanisms and economic policy instruments capable of taking monetary policy’s place in the management of the asymmetric shocks that may arise.
Comparative studies suggest that Hungary does not lag behind the west European average in respect of the flexibility of goods markets and probably outperforms the former in terms of labour market flexibility. Hence, price and wage adjustments by the market can be counted on in the management of asymmetric shocks at least as much as in the case of the current euro-area members.
Fiscal policy may be suitable for dampening asymmetric shocks at the aggregate level in a country. However, to be able to respond with the necessary speed it has to be sufficiently flexible and unplagued by high deficits or debts. This is to be ensured by the Maastricht criteria on the size of the budget deficit and public debt which countries wishing to join monetary union have to meet and, after accession to the EU, by the requirements laid down in the Stability and Growth Pact.
Adjustment to the shocks can be implemented in two different ways, namely the operation of automatic stabilisers and active discretionary fiscal measures. As fiscal revenues and expenditures in today’s Hungary are predominantly linked to wages and consumption, and as the expenditures are less variable relative to the cycle, automatic stabilisers do not have a very large effect. However, this should not be seen as exceptional, as automatic stabilisers play a similarly minor role in some (typically south European) EU countries. Consequently, discretionary measures, with special regard to those aimed at smoothing investment activity,
exposed more to cyclical fluctuations than consumption, are to play a more pronounced role. It should be noted that the EU prefers aggregate demand management via the automatic stabilisers to that via discretionary measures.
Even though monetary independence is a useful instrument in smoothing cyclical fluctuations, it may actually magnify the cycles under certain circumstances. For a small open economy, still classified within the ‘emerging’ market investment category, maintaining the national currency may by itself induce undesirable shocks, such as financial contagion and speculative attacks on the currency. A country sticking to its currency may have to face larger volatility in capital flows than that experienced by more developed countries and/or countries in a currency union with their major trading partners. This may also make a mark on the business cycle, triggering more erratic movements than in the more advanced economies or in countries that gave up their national currencies. It should be stressed that although surpassing the emerging market status may by itself mitigate higher capital flow volatility, it cannot completely eliminate it, as that can only be achieved by giving up the national currency. Thus, Hungary’s entry into the EU and its prospective move away from the emerging market status in itself offers no complete remedy to this problem.
Adopting the euro is also expected to be conducive to financial integration. The end of exchange rate uncertainty will likely prompt Hungarian households to reallocate investment portfolios and transfer a large portion of their savings into euro area instruments. The ensuing higher diversification of portfolios will lead to a wider distribution of risk across Hungarian and euro-area households, a welcome development for both parties. Wider diversification of risks will in turn reduce exposure to asymmetric shocks, since income changes triggered by the shocks tend to be smaller if portfolios are more diversified. However, it is rather difficult to quantify the rise in utility through this channel, as that would require knowledge of both the size of the expected diversification and the risk aversion of Hungarian households.
Our cost-benefit analysis could be summarised as follows. The quantifiable benefits arising from joining the euro area considerably exceed the costs entailed, resulting in higher economic growth and faster real convergence towards western Europe.
It is impossible to quantify the impact of the introduction of the euro area on
business cycle fluctuations and its welfare implications. Giving up the national currency will entail the loss of a device for keeping some of the asymmetric shocks at bay, while, at the same time, it eliminates one potential source of asymmetric shocks (i.e. emerging market financial contagion). The likelihood of other asymmetric shocks is not higher than in the less developed euro-area countries, thanks to the similarity of production structures, the advanced state of trade integration with the euro area and cyclical synchronicity. Furthermore, flexible price and wage adjustment mechanisms and discretionary fiscal policy instruments can tackle any disturbances that may still occur at least as effectively as in the euro-area member nations at a similar stage of development.
Timing of joining the euro area
Since the our cost-benefit analysis has produced convincing evidence in support of the existence of considerable gains in growth if the single currency is adopted, the question of optimal timing seems easy to answer: the sooner the better. The findings suggest that by postponing entry, Hungary will miss out on extra growth.
Nevertheless, the situation is not as simple as that, since nominal convergence, a prerequisite of joining the euro area, may entail real economic costs, which are not unrelated to the speed of the accession process. Currently, the rapid fulfilment of the Maastricht criteria on inflation and the fiscal deficit may be problematic. There is the danger that rapid disinflation and fiscal adjustment (aimed at a changeover in 2007) may entail excessive sacrifice of growth. It should be noted however, that quite a few current euro area countries had to accomplish a similar degree of fiscal adjustment and disinflation during a similarly short period of time. Follow-up studies (see for instance, ECB (2002)) reveal that these countries have not incurred any significant costs in connection with this rapid adjustment.
Should the issue of postponing Hungary’s adoption of the single currency arise, the following three implications should be considered. The first is the fiscal policy obligations emerging right after Hungary joins the EU. The second is the rise in exposure to speculative capital flows, especially during the period between the EU entry and joining the euro. The third factor is the effect on the credibility of the disinflation programme of postponing the participation in the euro area.
Fiscal adjustment must be accomplished not solely for the purpose of joining the euro area, since the Agreement requires member countries to reduce fiscal deficits below 3% as early as accession. Furthermore, the Stability and Growth Pact also requires that member nations seek to attain a balanced fiscal position at a prescribed pace and as laid down in their convergence programmes.
If non-resident investors are confident that Hungary will join the euro area in the near term, it may trigger speculative capital inflows and start off a ‘convergence play’ similar to the ones that had involved other countries earlier in preparation of Monetary Union. This threatens a rapid reversal of capital flows and drastic depreciation, should investor confidence drop unexpectedly (due perhaps to exogenous factors). It is easy to see that Hungary’s accession to the EU will give continued momentum to speculative capital inflows, as the entry will give investors a clear signal that the country has passed a major milestone on the way towards adopting the single currency. The history of a few current euro area members in the 1990s well illustrates the proposition that EU membership by itself does not provide protection from a sudden reversal in capital flows, speculative attacks on the national currency and a potential currency crisis (see EMS crises in 1992 and 1995). Another argument in favour of the earliest possible participation in the euro area is that it would shorten the period marked by intensive exposure to speculative capital flows. Volatile investment flows could trigger extreme fluctuations in the exchange rate of the forint. Steady inflows of capital may cause the exchange rate to appreciate steadily at first, only to be replaced by rapid depreciation once there is a reversal in the direction of capital flows. A successful accession programme may also enhance stability of the exchange rate, since international experience suggests that as the date of entry gets nearer, exchange rate expectations tend to approach the expected conversion rate.
Commitment to joining the euro area at an early date is one of the key factors enhancing the credibility of the disinflation programme in the eyes of market participants. In turn, the credibility of the disinflation programme has a major impact on the magnitude of the real economic sacrifices involved in achieving it.
The lower the level of inflation expectations in response to an announced disinflation path, the easier and faster it is to actually reduce inflation to the desired level, in other words, the smaller the real economic sacrifice of disinflation. Commitment to
joining the euro area as early as possible, especially if it is a consensus objective of the central bank and the government, signifies an ‘end point’ to market participants which lends credibility to the preceding disinflation process and is extremely favourable for inflation expectations, ultimately reducing the costs of disinflation.
On the other hand, this also means that should the expected end point become uncertain for any reason (such as postponing the entry to some unspecified date), that may significantly push up the costs of disinflation.
II. HUNGARY’S MATURITY FOR EURO AREA PARTICIPATION
This analysis starts with a discussion of what considerations should be used to decide whether it is worthwhile for Hungary to give up its autonomous monetary policy and join the euro area.
In the academic literature, the theory of Optimum Currency Areas (OCAs) deals with the conditions and the analytical framework that can be employed to assess when a country should fix its exchange rate, that is give up its monetary independence. The classic theory of OCAs was established in the 1960s as a result of research by Mundell (1961), McKinnon (1963) and Kenen (1969). These authors attempted to establish guidelines for the selection of the most suitable exchange rate system.
Mundell’s line of reasoning, in fact the starting point of the theory, can be best presented within a two-country model. Let us assume that there is an increase in demand for the products of country (region) A at the cost of the products of country (region) B, implying a change in consumer preferences. If there are nominal rigidities in B (for instance, nominal wages are inelastic downwards), equilibrium (of the trade balance) may be restored via a depreciation of the currency of B. If there is a pegged exchange rate regime or currency union, mobility of labour is needed, or else B will suffer a rise in unemployment and a trade deficit vis-à-vis A. Thus, Mundell believes that the widest boundaries of an OCA are designated by labour mobility. Many authors have since pointed out the existence of other equalising mechanisms, such as fiscal transfers, which makes labour mobility no longer necessary for a currency union.
The theory has drawn attention to the conditions that must exist for asymmetric shocks to occur at all, that is disturbances affecting the economies of various regions to differing degrees, potentially requiring adjustment via relative prices once they occur. An adequately diversified sectoral structure may ensure that the effects of sectoral shocks are averaged out. Structural similarity between countries also rules out major incidence of shocks at the aggregate level. Sections III and IV examine whether it is worthwhile for Hungary to join monetary union, analysing several aspects of the OCA theory.
Mundell and his followers exclusively determined real criteria – nominal criteria were not among the conditions of a sustainable currency pegging. One of the conditions for participating in the European currency union is meeting the Maastricht convergence criteria, which establish numerical values for nominal variables (for more details, see Section V). It is perhaps less well known that the Maastricht criteria include real measures as well, although without numerical values. These indicators provide supplementary information about the extent to which nominal convergence is sustainable (e.g. trade and current account balances, unit labour costs, labour productivity, developments in real wages, etc.)2. Nevertheless, the main reason for giving nominal criteria the primary role is that meeting solely the real economic criteria derived from the OCA theory does not automatically guarantee monetary stability in the region introducing the common currency. But the designers of EMU did not simply wish to create an ‘optimal’, or put more practically, well functioning currency area. Rather they wished to create an area of monetary stability.
It is important to note that neither the OCA theory nor the convergence criteria involve the economy’s ‘level of development’, as it is traditionally measured by per-capita GDP. The official standpoint of the ECB and the European Commission is included in the press release3issued about the Helsinki seminar4. This states that real and nominal convergence should proceed simultaneously. During real conver- gence, the economic structure will become similar to that existing within the EU, while growth picks up speed via structural reforms, helping living standards approach the levels seen in the EU. Referring to historical examples, they stress that this progress should proceed in parallel with nominal convergence, by which they mean price stability and sound public finances. As progress towards meeting the Maastricht criteria does not impede the implementation of structural reform, they also suggest that monetary policy should be directed at achieving price
2It must have been an important factor in setting the Maastricht criteria that it was not possible to specify optimal levels for real-convergence indicators in numerical terms. The lack of numerical values would have hampered the objective selection of eligible participants. However, decision-makers were in agreement as to the need for basing participation in the currency union on objective and quantifiable criteria which leave only minimum space for discretion.
3http://www.ecb.int/press/pr991112.htm
4The Helsinki seminar was held in the capital of Finland in November 1999. High-ranking officials of the ECB and accession-country central banks met to discuss strategic issues relating to EMU participation. This was the first meeting of its kind aimed at establishing contact between the ECB and the accession-country central banks. See also pp. 20-21 in Bini-Smaghi et. al.(1994) on the circumstances which led to the formulation of this position, called ‘parallelism’ during the course of the Maastricht Treaty preparatory talks.
stability, which should also be supported by fiscal policy. Finally, they add that it is at each country's discretion to choose which path for convergence to follow towards currency union membership, as long as the ultimate objective remains convergence. Similar statements could be cited from speeches by high-ranking officials of the ECB delivered at various forums and from European Commission documents5. They all have one feature in common in that by real convergence they mean the similarities between economic structures and the level of economic development, while regarding economic integration, privatisation and progress with structural reform to be more important than the catch-up in respect of per- capita GDP.
Taking into account the requirements of economic theory, the ECB and the European Commission, we view real economic criteria marked by the optimum currency areas as authoritative in deciding whether Hungary is sufficiently mature to become a member of the monetary union. These criteria are discussed in detail in Section III. But before examining the issue, we would like to analyse using another method whether Hungary has already achieved the level of economic development required for accession to the euro area. In the following, we will compare Hungary's most important economic properties with those of the less advanced euro area member states in the five years preceding their entry. A comparison of real convergence indicators allows us to judge whether or not Hungary is mature for European Union membership. On the other hand, this comparison may serve as a yardstick against which to measure the feasibility of meeting the convergence criteria. However, the results of comparisons should be treated with reservations – the accession countries are now faced with both a different external economic climate and different economic policy challenges6.
The lower stage of development of the Hungarian economy has no bearing on the question whether the economy is mature enough to join monetary union. But this lower level does have an important macroeconomic consequence – should the exchange rate be fixed, the process of catching up will entail higher structural or equilibrium inflation. The Bank's estimate of expected equilibrium inflation is presented in Chapter II.2.
5See, for example, Padoa-Schioppa (2002) and Rempsberger (2001), pp. 5-6.
6 For more details, see Horváth-Szalai (2001).
II.1. Hungary and the less advanced EU member states five years prior to currency union membership
This chapter compares some of Hungary's key real and nominal convergence indicators with those of the less advanced EU member countries. Assuming 2006 as the earliest possible date of joining the euro area, Ireland's, Portugal's and Spain's data for 1994 and those of Greece for 1996 provide the basis for comparison with Hungary's data for 2001.
Admittedly, in respect of per-capita GDP Hungary lags behind the four countries examined – Hungarian per-capita GDP, measured on a purchasing power parity basis, was 53% of the EU average in 2001 (see Chart II-1). Using OECD and Eurostat methodologies, this ratio rose by 6% between 1997 and 2001. Thus, Hungary managed to reduce this gap by an annual 1.5% on average. Taking other real and welfare indicators into account, however, the calculation of Hungarian GDP currently underestimates actual income, due to the differences between Eurostat and CSO methods of calculating GDP (for example, the method of recording imputed income from owner-occupied dwelling and tourism).
As noted earlier, neither economic theory nor the EU requirements contain numerical criteria for economic development. Indeed, from which aspect may the stage of economic development still be of relevance?
One of the issues to consider is that membership in the EU7 and the euro area entails certain commitmentswhich place material burdens on the acceding country (e.g. centralising part of international reserves at the ECB, or other obligations stemming from the common monetary policy). The relevance of these for membership in monetary union is not too large and they are not materially different from the costs which would be incurred should independence be retained. Indeed, some minor cost savings can be achieved, for example, by reducing international reserves to lower levels over the longer term.
Second, the size of the income gap may reflect the expected structural tensions.
However, the importance of structural problems may be measured more accurately using direct indicators. For example, the issue whether domestic companies will be
7 EU membership may involve major obligations in respect of issues such as environmental protection and transport, which may entail financial burdens in the short term.
Chart II-1
Per-capita GDP measured on a PPP basis (EU15=100)
Source:Eurostat.
able to stay afloat in a market also unified from a monetary perspective can be examined through the depth of integration in foreign trade and production, in addition to the general indicator of income levels (for more details, see Chapters III.1.1 and III.1.2). The Copenhagen criteria for EU membership also follow the method of direct comparison (e.g. the ability to undertake commitments arising from membership or the ability of a country to withstand competition in the EU market).
This approach makes the requirement for the use of the national income level as indirectindicator unnecessary.
The level of economic development is also used to indirectly measure the expected migration of labour forcefollowing accession. There are much more precise direct indicators in this area8; suffice it to note that monetary union membership influences migration less than EU membership.
Finally, differences in income levels can show indirectly the extent of expected structural inflation. It should be stressed, however, that the inflation criterion for
8For more details, see Chapter III.1.2.
100 90 80 70 60 50 40 30 20 10 0
Ireland 1994
Spain 1994
Portugal 1994
Greece 1996
Hungary 2001
%
monetary union membership measures structural inflation directly, on the basis of inflation convergence, and not indirectly, through the income level.
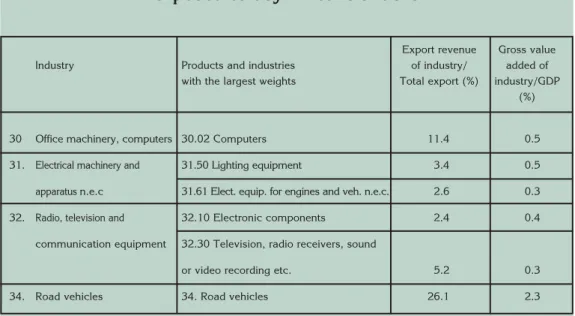
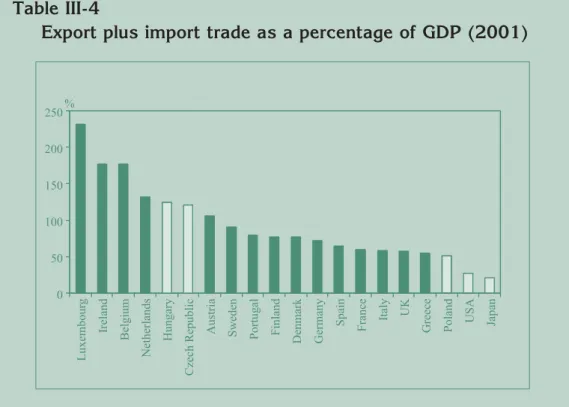
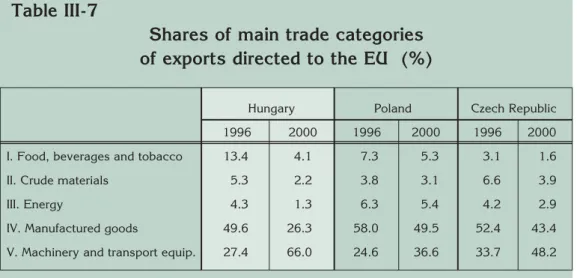
A comparison of major economic indicators, particularly those expressing the degree of foreign trade integration, reveals that Hungary is at a more advanced stage of integration with the euro area than the less advanced EU members had been five years prior to the euro’s introduction (see Charts II-2, II-3 and II-4). The euro area is Hungary's most important trading partner – Hungarian manufacturers have increased their share in the European single market over the past five years;
the proportion of high value-added products has risen within exports to the EU;
foreign trade accounts for a relatively high percentage of manufacturing, a sector reflecting the state of economic integration9.
Chart II-2
Economic openness
(goods and services exports plus imports as a percentage of GDP)
Sources:European Commission (2000) and Bank calculation.
9 For more details, see Chapter III.1.2.
140 120 100 80 60 40 20 0
Ireland 1994
Spain 1994 Portugal
1994
Greece 1996 Hungary
2001
%
Chart II-3
Proportion of exports to the euro area within total exports
Sources: OECD SITC database.
Chart II-4
Proportion of intra-sectoral trade within exports to the EU
Sources: Bank calculation for Hungary and Kaitila (2001), p. 9.
80 70 60 50 40 30 20 10 0
Ireland 1994 Spain
1994 Portugal
1994
Greece 1996 Hungary
2001
%
60 50 40 30 20 10 0
Ireland 1994 Spain
1994
Portugal 1994
Greece 1996 Hungary
2001
%
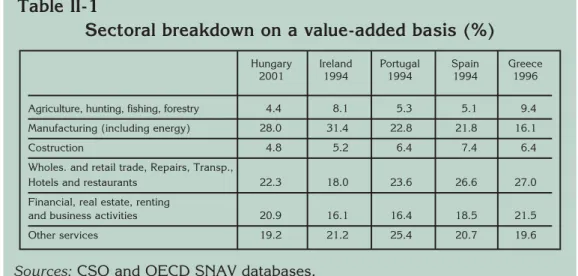
A comparison of contributions to GDP by the main sectors shows that Hungary's economic structure is very similar to that of Ireland, when it was at the same distance from monetary union (see Table II-1). However, industry accounts for a higher share and services for a lower share of Hungarian value added relative to other countries. As in the case of Ireland, this relatively high proportion of industry rests basically on comparative advantages10; being mainly reflected in business services and less in financial services, the lag of services behind other sectors does not hamper future economic growth. Moreover, with the increase in income levels, the proportion of these up-to-date services will rise to the detriment of industry, as is suggested by the Irish model.
Table II-1
Sectoral breakdown on a value-added basis (%)
Sources:CSO and OECD SNAV databases.
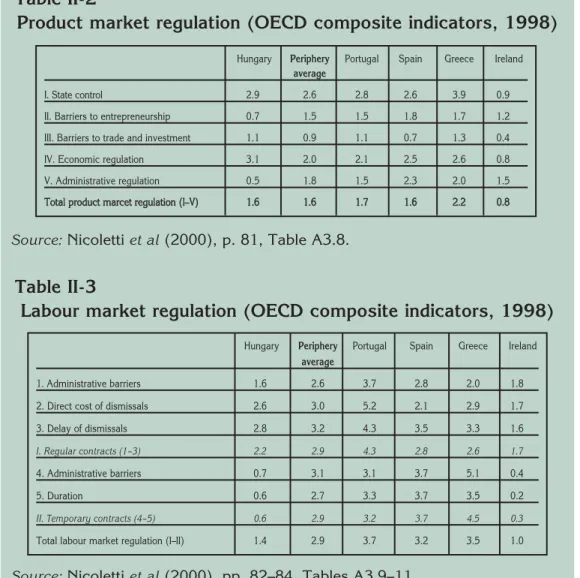
The OCA theory places great emphasis on product and labour market flexibility, being factors reducing the costs of adjustment in the event that the independent exchange rate and monetary policies are abandoned. In the absence of a single, consensus gauge for product and labour market flexibility, we have relied on the OECD's 1998 indicators of composite market regulation (see Tables II-2 and II-3).
Clearly, Hungary's product market is similarly regulated, while its labour market is much less regulated than the average for the less advanced EU member countries.
An assessment of compliance with the Maastricht convergence criteria reveals that
10For more details, see Chapter III.1.2.
Hungary Ireland Portugal Spain Greece
2001 1994 1994 1994 1996
Agriculture, hunting, fishing, forestry 4.4 8.1 5.3 5.1 9.4 Manufacturing (including energy) 28.0 31.4 22.8 21.8 16.1
Costruction 4.8 5.2 6.4 7.4 6.4
Wholes. and retail trade, Repairs, Transp.,
Hotels and restaurants 22.3 18.0 23.6 26.6 27.0
Financial, real estate, renting
and business activities 20.9 16.1 16.4 18.5 21.5
Other services 19.2 21.2 25.4 20.7 19.6
Table II-2
Product market regulation (OECD composite indicators, 1998)
Source: Nicoletti et al(2000), p. 81, Table A3.8.
Table II-3
Labour market regulation (OECD composite indicators, 1998)
Source: Nicoletti et al(2000), pp. 82–84, Tables A3.9–11.
Hungary does not have a larger lag in fulfilling any of the criteria than the member countries reviewed when they were five years prior to accession. Indeed, the picture is much more favourable in respect of long-term interest rate convergence and gross public debt (see Charts II-6, II-7 and II-8).
Hungary's lag in terms of meeting the inflation criteria appears to be relatively greater; yet the gap does not fall outside the range of values for the countries examined (see Chart II-5).
Hungary Periphery Portugal Spain Greece Ireland average
1. Administrative barriers 1.6 2.6 3.7 2.8 2.0 1.8
2. Direct cost of dismissals 2.6 3.0 5.2 2.1 2.9 1.7
3. Delay of dismissals 2.8 3.2 4.3 3.5 3.3 1.6
I. Regular contracts (1–3) 2.2 2.9 4.3 2.8 2.6 1.7
4. Administrative barriers 0.7 3.1 3.1 3.7 5.1 0.4
5. Duration 0.6 2.7 3.3 3.7 3.5 0.2
II. Temporary contracts (4–5) 0.6 2.9 3.2 3.7 4.5 0.3
Total labour market regulation (I–II) 1.4 2.9 3.7 3.2 3.5 1.0 Hungary Periphery Portugal Spain Greece Ireland
average
I. State control 2.9 2.6 2.8 2.6 3.9 0.9
II. Barriers to entrepreneurship 0.7 1.5 1.5 1.8 1.7 1.2 III. Barriers to trade and investment 1.1 0.9 1.1 0.7 1.3 0.4
IV. Economic regulation 3.1 2.0 2.1 2.5 2.6 0.8
V. Administrative regulation 0.5 1.8 1.5 2.3 2.0 1.5 T
Toottaall pprroodduucctt mmaarrcceett rreegguullaattiioonn ((II––VV)) 11..66 11..66 11..77 11..66 22..22 00..88
Chart II-5
Deviations from the inflation criterion
(HICP)
Sources:Eurostat and NBH.
Chart II-6
General government deficit* as a proportion of GDP
Suorces:Eurostat and NBH.
* Hungarian general government deficit on SNA basis; NBH estimate.
8 7 6 5 4 3 2 1 0
Ireland 1994 Spain
1994 Portugal
1994 Greece
1996
Hungary 2001
% points
0 –1 –2 –3 –4 –5 –6 –7 –8
Ireland 1994 Spain
1994
Portugal 1994 Greece
1996
Hungary 2001
%
Chart II-7
Gross debt as a proportion of GDP
Sources:Eurostat and NBH.
Chart II-8
Deviations from long-term interest rate convergence
Sources:Eurostat and NBH.
120 100 80 60 40 20 0
Ireland 1994
Spain 1994 Portugal
1994 Greece
1996
Hungary 2001
%
9 8 7 6 5 4 3 2 1 0 –1
Ireland 1994 Spain
1994 Portugal
1994 Greece
1996
Hungary 2001
% points
Hungary introduced a more proactive disinflation policy in 2001, with its constituents being the changes made to the monetary and exchange rate policy regimes.
Similarly, there are no material differences in meeting the fiscal criterion. Thanks to a steady reduction in gross debt in recent years, the fiscal indicator for Hungary has been below the 60% reference value for a sustainable period. Hungary is faced with a fiscal adjustment of a magnitude, in terms of general government finances, comparable to that which the reviewed members, except Ireland, faced in the nineties (see Chart II-6).
The high degree of long-term interest rate convergence indicates that market participants judge early membership in monetary union to be a realistic prospect.
II.2. Equilibrium level of Hungarian inflation in the event of entry into monetary union
As discussed in Chapter II.1, although lagging behind the less advanced euro area countries in terms of per-capita GDP, Hungary has reached, and in certain dimensions even surpassed, comparable indicators of those countries in the area of structural similarities and integration. Consequently, based on international comparison, Hungary forms an optimum currency area with the euro area, but, due to the phase of real economic catch-up, Hungarian inflation will likely be higher than in the euro area following the changeover to the common currency.
Although the time that has passed since the introduction of currency union has been too short to allow separation of cyclical from structural shocks, there has been a higher level of inflation observable in the less advanced euro-area countries as well. Excess inflation above the euro area average has been 1.1 percentage points in Spain, Portugal and Greece, and 2.9 percentage points in Ireland, since joining the euro. Below, we will attempt to quantify the size of the expected excess inflation in the case of Hungary.
The size of excess inflation is determined by the equilibrium real appreciationof the forint.11 This means that at any given exchange rate, domestic inflation is derived as the sum of average foreign inflation and equilibrium exchange rate appreciation over
11The remainder of the chapter draws on a study by András Kovács Mihály: Equilibrium Real Exchange Rate in Hungary. See Kovács M. A (2001).
a longer period.12 The equilibrium real exchange rate is usually defined as the relationship between foreign and domestic price levels in the same currency at which the economy is in a state of external and internal equilibrium.13 In other words, at a given exchange rate level the economy grows along with the trend potential output, in a way that the current account balance moves on a sustainable path over the long term.14A general equilibrium model describing the Hungarian economy in detail would be required in order to define the level of equilibrium real exchange rate. However, such a model is currently not available. But, starting from the theoretical framework, it is possible to determine the most important factors underlying the variations in the equilibrium real exchange rate. Below, we attempt to provide estimates for this.
The real exchange rate is the ratio of general domestic and foreign price levels expressed in the same currency. The aggregate real exchange rate can be decomposed into two factors – (i) real exchange rate of tradables,15 i.e. external real exchange rate (the ratio of domestic and foreign tradables prices expressed in the same currency) and (ii) the ratio of services and tradables prices (both for domestic and foreign prices), i.e. the domestic real exchange rate.16According to economic theory, the first component does not reflect a trend over the long term, developing as it does in a stable way.17 In contrast, the second component grows along a long- term trend, according to both theory and the empirical literature.
The consumer price-based real exchange rate appreciated by 28%in Hungary in the period 1990–2000. This implies a 3.2% real appreciation on a yearly average.
However, the evolution of the indicator can be divided into two clearly distinguishable phases. Annual average appreciation amounted to 8.5% in the period up to 1993;
and since then appreciation has only been of the order of 1%. In the first, transition
12 The calculation of the equilibrium real exchange rate uses inflation data on Hungary’s major trading partners according to their weights in trade, which is not identical with the weighting applied in the HICP. The section below does not take account of the bias arising from the composition effect.
13 See Black (1994).
14 Balance of payments current account sustainability can be interpreted in several different ways. In its stronger version it can be viewed as a path for the balance of payments which allows debt accumulation to be covered by future savings. Its weaker version refers to a current account that is consistent with a constant debt rate. Sustainability is also sometimes seen as a deficit that can be financedby capital flows stable over the medium run.
15This study undertakes a separate analysis of two sectors within the economy, with regard to price behaviour. They are the sectors of internationally traded and non-traded goods, hereinafter referred to as tradablesand services, for simplicity.
16 See Kovács and Simon (1998).
17 See, for example, Rogoff (1996).
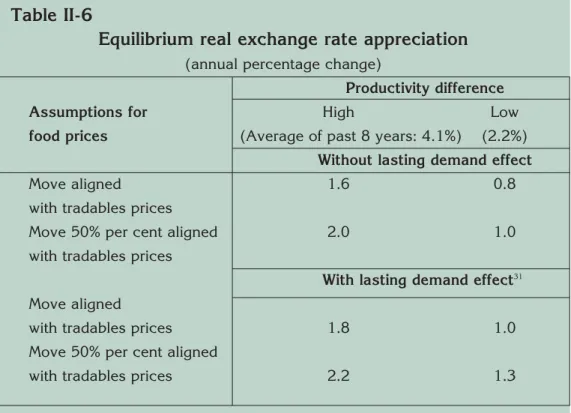
phase, massive appreciation was required as a consequence of market liberalisation, although available information suggests that the extent of this appreciation was exaggerated, contributing to upsetting external equilibrium in 1993–1994.18 However, the 1% real appreciation observed ever since has been somewhat less than the 1.5%–3% values estimated for the equilibrium real exchange rateso far.19 This is attributable mainly to the fact that, while the domestic real exchange rate has appreciated continuously, the external real exchange rate has depreciateddue in large part to the operation of the crawling-peg exchange rate mechanism (see Table II-4).
Table II-4
Components of the real exchange rate between 1991–1999*
(Annual average growth in per cent)
External real Domestic real Weights** Aggregate real exchange rate exchange rate exchange rate
–2.1 3.5 –0.1 1.2
* The Bank's own calculation based on the methodology by Kovács and Simon (1998); on a GDP deflator basis. Negative values denote real depreciation.
** Statistical impact arising from the domestic and foreign sectoral differences.
In the monetary union, variations in the external real exchange rate can be treated as negligible. Therefore, the factors determining the services-to-tradables prices ratio should be taken into account in order to estimate the expected size of equilibrium real exchange rate appreciation. These factors can be categorised into the main groups below.20
Supply-side shocks: the Balassa-Samuelson effect
On the supply side, the mechanism hallmarked by Balassa(1964) and Samuelson
18 See Kovács (1998).
19 See Oblath (1997), and Kovács and Simon (1998).
20In the following, any reference to the relative situation of the service and the tradables sectors (relative prices and productivity) is intended to describe domestic conditions relative to abroad even when there is no explicit indication. This is because the constant repetition of the long phrase ‘services/tradables price ratio relative to the corresponding price ratio abroad’ would be rather cumbersome stylistically. Whenever the reference is to the tradables/services price ratio or productivity ratio of one single country, there is a special note made.
(1963), based on the productivity gap between the services and tradables sectors, is generally taken into account. On the assumption that the profitability of wages and capital is equilibrated across the two sectors, the following relationship emerges. If the tradables sector is more capital intensive and/or, by nature, offers higher productivity gains, the services sector will only be able to maintain its initial profitability by raising services prices, due to the general wage increasing pressure from the productivity gains in the tradables sector. If the difference in productivity gains between the two sectors persists, services prices will continue to increase as a trend relative to tradables prices. This implies that the equilibrium real exchange rate will be under permanent pressure to appreciate.
Chart II-9
Tradables/services sector productivity and the services-to-tradables price ratio between Hungary and its competitors (1992=100)
Source:Kovács (2001).
A number of studies have attempted to quantify the pressure of real appreciation arising from productivity gaps in the cases of developed, catching-up and transition economies. In general, a significant relationshiphas been found between relative prices and productivity rates. There are a number of studies on developed economies which have run regressions across services and tradables prices and
150 140 130 120 110 100 90
1991 1992 1993 1994 1995 1996 1997 1998 1999 Tradables/services productivity
Services/tradables price ratio
the performance of the services and tradables sectors. A major finding of these studies is that, over the long term, services/tradables price indices correlate, with unit elasticity, with movements in labour productivity in tradables/services.21 No similar exact econometric tests have been conducted for the transition economies.
The studies have in general searched for a relationship between the real exchange rate and aggregate productivity, and between the real exchange rate and real productivity rates, or else they have applied indirect methods to investigate the Balassa-Samuelson effect.22 Although these studies have also not tested the unit elasticity between labour productivity and relative prices, the majority of estimates do not contradict with the unit productivity–relative price elasticity, provided the assumptions are plausible.23 Unit elasticity appears to be supported by Hungarian data as well. Table II-5 clearly shows that gains in tradables/services productivity entailed price changes of virtually the same order in Hungary between 1991 and 1999.
Table II-5
Developments in relative prices and productivity in Hungary and its competitors*
(Annual average rises between 1991–1999)
Hungary Competitors Relative
Services/tradables productivity 6.5 2.3 4.1
Services/tradables prices 6.2 0.9 5.3
* The Bank's own calculation based on the methodology by Kovács-Simon (1998).
21 See Canzoneri et al(1998) and Alberola et al (2000).
22 Halpern et al (1997, 1999, 2000), Krajnyák et al (1997), Oblath (1997), Corricelli et al (2001), Darvas (2001), De Broeck et al (2001) and Dobrinsky (2001), Jakab and Kovács (1999).
23 By taking into account the CPI weight of the service sector and the relationship between aggregate productivity and the tradables/services productivity ratio.
Demand-side shocks
Cyclical swings in demand generally do not influence the equilibrium real exchange rate. In contrast with this, lasting structural changes in the pattern of demand do have an impact on the size of the equilibrium real exchange rate. The impact of these permanent demand twists is clearly demonstrable in the opposing developments in the services-to-tradables price ratio and consumption. Should the services-to-tradables price ratio be exclusively determined by supply, a rise in the services-to-tradables price ratio would cause the share of services consumption to fall relative to the share of tradables consumption. However, it has been observed empirically that simultaneously with the rise in the services-to-tradables price ratio, there is also an increase in the consumption of services/tradables, in evidence of the role played by demand over the longer term. This is generally attributed to a shift in consumer preferencesor the increasing role played by fiscal policy.
Research into the role of demand factors has generally been less successful than research based exclusively on productivity regressions. The analysis of cyclical effects has revealed significant relationship between certain demand variables and relative prices over the short term, but the coefficients obtained for the long term often proved to be non-significant and highly volatile.24
Other factors may influence the size of equilibrium real appreciation, in addition to demand and supply shocks. A change in the terms of trade will alter the amount of disposable income and induce substitution on the part of consumers and producers.
In addition, it directly influences the goods balance. Whether this terms-of-trade shock will be negative or positive is not unequivocal, due to the complexities of the impact, although empirical evidence has generally shown that deterioration in the terms of trade tends to devalue the equilibrium real exchange rate, as it worsens the external balance.25
The analysis of the Portuguese catch-up process has raised the issue that EU transfers following accession put significant upward pressure on the equilibrium exchange rate.26An explanation for this is that such funds were used in large part
24See Micossi et al (1994), De Gregorio et al(1994), Jakab and Kovács (1999), Halpern et al (2000), Dobrinsky (2001).
25See Williamson (1994).
26See Abreu (2001).
to finance infrastructural investment, which in turn boosted the economy's supply capacity. The impact of financial integration may also increase upward pressure on the real equilibrium exchange rate. Accession to monetary union tends to reduce a country's risk premium. This implies more capital for the domestic economy and so greater economic potential, which is also a factor putting pressure on the exchange rate to appreciate.27These two influences, ceteris paribus, would imply a greater Balassa-Samuelson effect. However, we believe that economic and institutional change influencing the earnings potential of capital investments in the years of transition were at least as influential as those associated with EU membership and creation of the currency union. Hence, the Balassa-Samuelson effect observed in the recent period is probably an adequate estimator of expected developments following the creation of currency union.
Based on the theoretical and empirical considerations outlined above, in the following we will attempt to estimate the evolution of the forint real exchange rate during the convergence period. Taking the theoretical considerations into account, we have focussed primarily on the productivity impactand, secondarily, with a higher uncertainty, we have tried to quantify the impact of the preference shiftsas well. The estimate of the productivity impact is based on the hypothesis that services/tradables productivity raises the services-to-tradables price ratioaccording to unit elasticity.
It is important to note that, theoretically, unit elasticity relates to value added deflators.
This impact is presumably smaller on final, i.e. consumer, prices. An explanation for this is that the services-to-tradables price ratio has risen by less in the consumer price index since the political changeover in Hungary than suggested by the value added deflators. The principal reason for this is that services in the consumer price index include a tradables component and vice versa, tradables in the index include a services component. Based on average deviation in the past, this impact may reduce the impact of the productivity gap on consumer prices by a couple of percentage points.
We have used two scenarios in the case of productivity gaps. In the first case, we have assumed that the relatively stable trend observed between 1991 and 2000 will continue, which implies a 6.5% gap in productivity gains in the services/tradables sectors. In the second case, we have assumed that the domestic productivity gap
27See the analysis by Abreu (2001) of the experiences with inflation in Portugal.
is somewhat less, at 4.6%, which is broadly comparable with the values for Portugal in the 1980s and 1990s.28In each case, foreign productivity is assumed to be equal to productivity values registered by Hungary's trading partners between 1991 and 1999, at 2.3%.
Two scenarios have been tested in relation to a lasting demand impact– (i) there is no such demand effect and (ii) the coefficient of the lasting demand effect is 0.12.29In this case, the proxy-variable of demand is real GDP growth, set at a 4.5%
rate. Hence, demand raises the services-to-tradables price ratio by an annual 0.5%
over the longer term.30
The behaviour of products belonging to the non-tradables and non-services price categories of the consumer price index must be determined, in order to quantify real appreciation. Market energy, motor fuel, and drinks and tobaccoprices have been assumed to move in line with tradables prices. We have been faced with uncertainties mainly in respect of assumptions for food prices and regulated prices.
According to economic theory, foodstuffs are tradable goods. However, in practice their prices may differ significantly from the exchange rate due to various administrative measures. Observing past trends, food prices have been moving somewhere between tradables and services prices. Taking this into account, we have examined twoscenarios – (i) food pricesare assumed to behave similarly to tradables prices and (ii) food prices are determined 50% by tradables prices and 50% by services prices.
Regulated prices have risen more strongly than market services prices in the past (see Table II-6). This, however, is attributable in large part to the very depressed level of the relative prices of government services in the communist era. In developed
28See Alberolaet al(2000).
29As noted earlier the coefficients of the estimates for the demand effect vary widely. This paper has drawn on estimates by Micossi et. al.(1994), which relate to the service-tradables price ratios with- in the EU countries. We have adjusted the coefficients estimated by the authors so that they show the effect as projected on the overall CPI. We have relied on the cited authors’ estimates because we have been curious about the relationships prevalent in normal market economies rather than in transitional economies. Note, however, that the coefficient obtained in this way does in effect correspond to Dobrinsky’s (2001) estimates for transitional economies.
30This refers to the demand impact prevalent over the long term, measuring thus not the impact of excess demand due to unsustainable economic policy which may divert the current real exchange rate from its equilibrium vale, but rather the impact of generally manifest long-term change in private or state preferences. Being permanent demand shocks, they will modify price relations over the long term so that the price of goods in greater demand will rise. If services are in relatively greater demand than tradables during the convergence process, services prices will increase.