Minimal Clinically Important Differences for Burke-Fahn-Marsden Dystonia Rating Scale and 36-Item Short-Form Health Survey
Dávid Pintér, MD,1* József Janszky, MD, DSc,1,2 and Norbert Kovács, MD, DSc1,2
1Department of Neurology, Medical School, University of Pécs, Pécs, Hungary
2MTA-PTE Clinical Neuroscience MR Research Group, Pécs, Hungary
A B S T R A C T : Background: Although an increasing number of trials are reported on the treatment of general- ized or segmental isolated dystonia, the minimal clinically important difference thresholds for the most frequently reported outcome measures are still undetermined.
Objectives:To estimate the minimal clinically important difference for the Burke-Fahn-Marsden Dystonia Rating Scale and the 36-Item Short-Form Health Survey in gen- eralized or segmental dystonia.
Methods:A total of 898 paired examinations of 198 consec- utive patients, aged >18 years, with idiopathic and inherited (torsin family 1 member A positive) segmental and general- ized isolated dystonia were analyzed. To calculate the mini- mal clinically important difference thresholds, both anchor- and distribution-based methods were used simultaneously.
Results:Any improvement >16.6% or worsening larger than 21.5% on the Burke-Fahn-Marsden Dystonia Rating Scale indicates a minimal, yet clinically relevant, change.
Threshold values for the Burke-Fahn-Marsden Dystonia Disability Scale were 0.5 points for both decline and
improvement. Cut-off scores for the Physical Component Summary, the Mental Component Summary, and the Global (Total or Overall) Score of the 36-Item Short-Form Health Survey were 5.5 and 5.5, 6.5 and 7.5, and 7.5 and 8.5 points for clinically meaningful improvement and deterioration, respectively.
Conclusions:The minimal clinically important difference represents the smallest change in an outcome measure that is meaningful to patients. Our estimates for the Burke-Fahn-Marsden Dystonia Rating Scale and the 36-Item Short-Form Health Survey may allow more reli- able judgment of the clinical relevance of different treat- ments for segmental and generalized isolated dystonia.
© 2020 The Authors.Movement Disorders published by Wiley Periodicals, Inc. on behalf of International Parkinson and Movement Disorder Society.
Key Words:36-item Short-Form Health Survey; Burke- Fahn-Marsden Dystonia Rating Scale; deep brain stimu- lation; dystonia; minimal clinically important difference
There is increasing research into health-related qual- ity of life (HRQoL) in dystonia.1 Currently, available data strongly suggest that patients with dystonia gener- ally experience lower levels of HRQoL than do healthy individuals.1Several factors seem to determine the level of disability related to dystonia, including, but not lim- ited to, the objective severity of dystonia and the pres- ence of nonmotor symptoms, such as anxiety and depression, sleep disturbances, and pain.2 Given that treatments for dystonia aim to relieve these problems in a holistic manner, measuring the changes in HRQoL can be an adequate way to evaluate the effectiveness of therapeutic interventions. The Burke-Fahn-Marsden Dystonia Rating Scale (BFMD-RS; frequently reported also as the Burke-Fahn-Marsden Motor Scale), Burke- Fahn-Marsden Dystonia Disability Scale (BFMD-DS), and 36-Item Short Form Health Survey (SF-36) are among the most frequently reported outcome measures in such trials.3,4
---
This is an open access article under the terms of the Creative Commons Attribution License, which permits use, distribution and reproduction in any medium, provided the original work is properly cited.
*Correspondence to:Dr. Dávid Pintér, Department of Neurology, Medical School, University of Pécs, Rét utca 2, 7623, Pécs, Hungary;
E-mail: david_pinter@outlook.com
Relevant conflicts of interest/financial disclosures:Nothing to report.
Fullfinancial disclosures and author roles may be found in the online version of this article.
Funding agencies:This study was supported by the Hungarian Brain Research Program (2017-1.2.1-NKP-2017-00002), NKFIH EFOP- 3.6.2-16-2017-00008, NKFIH SNN125143, and NKFIH EFOP-
3.6.1.-16-2016-00004 government-based funds. Our research was partly financed by the Higher Education Institutional Excellence Program of the Min- istry of Human Capacities in Hungary, within the framework of the 5th thematic program of the University of Pécs, Hungary (20765/3/2018/FEKUSTRAT). All the authors of this publication are members of the European Reference Net- work for Rare Neurological Diseases (Project ID No.: 739510).
Received:5 December 2019;Revised:11 March 2020;Accepted:23 March 2020
Published online 22 May 2020 in Wiley Online Library (wileyonlinelibrary.com). DOI: 10.1002/mds.28057
The BFMD-RS is currently the only instrument that is recommended by the International and Parkinson Movement Disorder Society for evaluating the severity of generalized dystonia.5Other available scales, such as the Global Dystonia Rating Scale and the Unified Dys- tonia Rating Scale, are only suggested by the task force for such a purpose.5A PubMed search, using two terms (“dystonia”AND”Burke-Fahn-Marsden Dystonia Rat- ing Scale”) for All Fields, conducted on November 20, 2019, found 209 publications. A considerable part of these items was DBS6-17 interventions reporting changes in the scores of the BFMD-RS and the BFMD- DS as their outcomes. According to the results of a recent analysis, the SF-36 is the most commonly used tool in studies reporting aspects of HRQoL in dysto- nia.1Consequently, the BFMD-RS, BFMD-DS, and SF- 36 are widely used in clinical research for dystonia;
however, their minimal clinically important difference (MCID) thresholds have not yet been established.
Although the first randomized and controlled trials on DBS for dystonia used the arbitrary >25% improve- ment in BFMD-RS scores as the indicator of clinical relevance,13,14 the accuracy and feasibility of this approach have never been tested before.
In clinical practice, a discrepancy may exist between levels of improvement or worsening in the objective severity of disease and the changes per- ceived by the patient. For example, the level of symp- tomatic improvement reported by the patient may be superior to that captured by clinicians.18,19 There- fore, the sole use of threshold values established by only objective estimations for detecting clinically rele- vant changes in the severity of patients’ symptoms may lead to distortions during evaluation of the effi- cacy of a treatment. However, the use of MCID threshold values, which reflect the smallest changes in an outcome measure that are meaningful to patients, may serve as a more feasible approach for revealing clinically important changes and contribute thereby to a more reliable translation of clinical outcomes into clinical practice.
Because no clinimetrically verified threshold values for detecting minimal but clinically relevant changes are available for the BFMD-RS, BFMD-DS, and SF-36 in generalized and segmental isolated (primary) dystonia, we aimed to determine these hallmarks.
Materials and Methods
The study protocol was similar to the procedure Makkos and colleageus used to establish MCID esti- mates for the Unified Dyskinesia Rating Scale.20 A con- secutive series of patients with idiopathic and inherited (torsin family 1 member A [TOR1A] positive) segmental and generalized isolated dystonia aged >18 years were
enrolled with the ethical approval of the Regional and Institutional Ethical Committee (3617.316-24987/KK41) in the Department of Neurology, Pécs, Hungary, between 2013 and 2019. None of the included patients had structural brain abnormalities capable of producing dystonia, hallmarks of neurodegeneration (eg, brain iron accumulation) according to MRI, or other known causes of acquired dystonia, including neuroleptic use.
The diagnosis of dystonia was confirmed by a neurolo- gist specialized in the diagnosis and treatment of move- ment disorders.
In addition to demographic, treatment, and disease- related data, the BFMD-RS,3 BFMD-DS,3 and the SF-364 were obtained at baseline. With respect to the SF-36, the Physical Component Summary (PCS) and Mental Component Summary (MCS) scores were also calculated in addition to the scores of the eight sub- scales (physical functioning, social functioning, role lim- itations because of physical problems, role limitations because of emotional problems, mental health, energy and fatigue, bodily pain, and general health).4Although it is not recommended to calculate a single measure of HRQoL based on the individual SF-36 domains, the SF-36 Global Score, which has previously been called Total or Overall Score, has been increasingly reported during the past 20 years.21 Therefore, we also gener- ated such a global measure by the arithmetic averaging of the scores of the eight subscales.21-26Neurocognitive performance was also measured to detect major neurocognitive disorder (Montreal Cognitive Assess- ment [MoCA] score < 20.5),27,28 which served as an exclusion criterion.
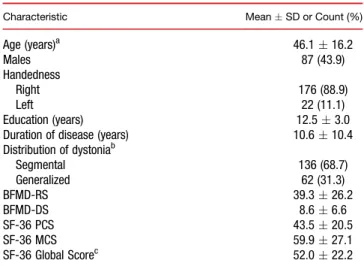
TABLE 1.Baseline sociodemographic and clinical characteristics of the study cohort (n = 198)
Characteristic MeanSD or Count (%)
Age (years)a 46.116.2
Males 87 (43.9)
Handedness
Right 176 (88.9)
Left 22 (11.1)
Education (years) 12.53.0
Duration of disease (years) 10.610.4
Distribution of dystoniab
Segmental 136 (68.7)
Generalized 62 (31.3)
BFMD-RS 39.326.2
BFMD-DS 8.66.6
SF-36 PCS 43.520.5
SF-36 MCS 59.927.1
SF-36 Global Scorec 52.022.2
aEvery patient was at least 18 years old at baseline.
bPatients only with isolated dystonia were included.
cThis score was calculated by the arithmetic averaging of the scores of the eight subscales.
SD, standard deviation.
All enrolled patients were asked to return for follow- up every 12 months. At follow-up, the BFMD-RS, BFMD-DS, and SF-36 were reassessed. The magnitude
of the perceived change in motor symptoms and disease-related difficulties since the last visit was mea- sured using the Patient-rated Global Impression of TABLE 2.Mean changes in scores of the SF-36, BFMD-RS, and BFMD-DS compared to PGI-I scores
Outcome Measure PGI-I
No. of Paired Visits
Change (Follow-up vs. Baseline)
Effect Size (Cohen’sd)
ROC Analysis
Mean
Standard
Deviation 95th CI
Optimal Cutoff
Sensitivity (%)
Specificity (%) LR+ LR– SF-36
Physical Functioning
3 A little better 154 3.8 13.4 –1.3 8.9 0.25 3.5 60.2 57.7 1.3 0.7
4 The same 235 0.3 7.4 –2.2 3.1 0.02 N/A
5 A little worse 128 –2.9 10.2 –7.2 0.4 –0.20 –3.5 67.4 60.1 1.4 0.7
SF-36
Role Limitations due to Physical Problems
3 A little better 154 5.7 27.9 2.5 10.0 0.23 6.0 70.4 67.4 1.6 0.7
4 The same 235 0.3 16.1 –3.2 4.7 0.05 N/A
5 A little worse 128 –4.6 25.2 –10.6 0.4 –0.22 –5.0 69.8 71.1 1.5 0.7
SF-36
Role Limitations due to Emotional Problems
3 A little better 154 4.4 24.4 –7.3 12.1 0.16 5.0 71.2 70.2 1.6 0.8
4 The same 235 0.5 23.6 –5.5 6.5 0.03 N/A
5 A little worse 128 –4.3 24.9 –10.3 5.6 –0.19 –4.5 69.8 68.9 1.5 0.8
SF-36
Energy and Fatigue
3 A little better 154 2.4 12.5 –0.5 5.9 0.24 2.5 66.7 67.8 1.7 0.8
4 The same 235 –0.4 10.4 –2.7 2.9 –0.03 N/A
5 A little worse 128 –3.1 11.5 –1.6 –7.8 –0.25 –3.5 67.8 69.9 1.7 0.8
SF-36 Mental Health
3 A little better 154 4.6 20.1 –0.8 8.0 0.19 4.5 68.7 65.5 1.7 0.8
4 The same 235 0.7 21.9 –3.2 4.6 0.06 N/A
5 A little worse 128 –3.8 23.7 –8.0 1.5 –0.20 –4.5 71.2 68.9 1.9 0.7
HRQoL PGI-I
Number of paired
visits
Change (follow-up vs. baseline)
Effect size (Cohen’sd)
ROC analysis
Mean
Standard
Deviation 95th CI
Optimal cutoff
Sensitivity (%)
Specificity
(%) LR+ LR−
SF-36 Social
Functioning
3 A little better 154 8.7 29.8 2.2 15.3 0.28 8.5 71.2 69.8 1.7 0.6
4 The same 235 0.9 25.2 –3.6 5.4 0.07 N/A
5 A little worse 128 -5.2 24.8 –1.2 9.6 –0.22 –5.5 72.3 71.2 1.9 0.6
SF-36 Bodily Pain
3 A little better 154 5.1 28.1 –1.5 9.4 0.21 5.5 61.2 62.5 1.5 0.8
4 The same 235 0.2 23.7 –3.0 3.4 0.02 N/A
5 A little worse 128 –4.9 29.6 –12.8 0.9 –0.19 –6.5 64.2 62.4 1.5 0.8
SF-36 General Health
3 A little better 154 7.6 20.1 –0.4 15.5 0.23 8.5 65.5 72.1 1.8 0.7
4 The same 235 1.4 29.4 –2.8 4.6 0.07 N/A
5 A little worse 128 –5.8 26.8 –10.3 –1.3 –0.26 –6.5 68.9 64.5 1.6 0.7
SF-36 Physical
Component Summary
3 A little better 154 4.9 13.8 –3.9 8.2 0.26 5.5 79.5 78.4 1.9 0.6
4 The same 235 0.3 6.4 –5.5 5.0 0.03 N/A
5 A little worse 128 –4.5 17.2 –11.4 1.6 0.17 –5.5 77.5 80.1 1.9 0.6
SF-36 Mental
Component Summary
3 A little better 154 6.6 9.3 –2.1 9.4 0.25 6.5 77.8 76.9 1.8 0.6
4 The same 235 0.6 16.4 –3.7 3.7 0.06 N/A
5 A little worse 128 –7.2 11.9 –12.9 1.5 0.19 –7.5 73.9 77.6 1.7 0.6
HRQoL PGI-I
Number of paired visits
Change (follow-up vs. baseline)
Effect size (Cohen’sd)
ROC analysis
Mean
Standard
Deviation 95th CI
Optimal cutoff
Sensitivity (%)
Specificity
(%) LR+ LR−
SF-36 Global Score
3 A little better 154 6.8 15.9 3.2 12.4 0.24 7.5 65.5 76.5 1.9 0.6
4 The same 235 1.4 14.9 –1.8 4.6 0.03 N/A
5 A little worse 128 –8.8 19.7 –20.4 1.5 0.19 −8.5 67.9 73.8 1.8 0.6
BFMD-RSa 3 A little better 154 –16.3% 17.9% –34.3% –1.3% 0.22 –16.6% 69.6 70.4 2.0 0.5
4 The same 235 –3.2% 15.6% –19.9% 13.1% 0.03 N/A
5 A little worse 128 22.1% 19.7% 4.5% 40.1% 0.24 21.5% 73.2 70.3 2.0 0.6
BFMD-DS 3 A little better 154 –1.05 0.50 –1.16 –0.87 0.17 –0.5 79.7 60.2 2.0 0.7
4 The same 235 0.10 0.57 0.00 0.19 0.02 N/A
5 A little worse 128 1.24 0.56 1.18 1.38 0.19 0.5 71.7 59.8 1.8 0.7
The number of return visits did not appreciably alter these values.
aRelative changes in the BFMDRS scores were calculated using the following formula: (scorebaseline–scorefollow-up) / scorebaseline. CI, confidence interval; LR+, positive likelihood ratio; LR–, negative likelihood ratio; N/A = not applicable.
Improvement (PGI-I) scale (1 = very much better; 2 = much better; 3 = a little better, 4 = no change; 5 = a little worse; 6 = much worse; and 7 = very much worse).29
Statistical Analysis
The detailed methods for estimating MCID were described previously.30Briefly, MCID values were deter- mined following the recommended strategy,31 including the simultaneous use of both anchor- and distribution- based methods. Anchor-based methods estimate MCID by using an independent and clinically relevant tool that is simultaneously interpretable by itself and has a suffi- ciently strong correlation with the evaluated instru- ment.31,32 Spearman’s correlation method was used to test whether correlation coefficients between the PGI-I and changes in BFMD-RS, BFMD-DS, or SF-36 reached the required minimum of 0.3.31 Correlation coefficients were 0.443, 0.357, and 0.374, respectively. Although all correlation coefficients exceeded the required minimum, ordinal regression modeling was also performed between the PGI-I (dependent value) and changes in scores of the BFMD-RS, BFMD-DS, and SF-36 to verify that the PGI-I is feasible to use as an anchor.33Subsequently, the first anchor-based method (within-patients score change method) compared changes in scores of the investigated instruments with the PGI-I score 4 (no change) to changes in the BFMD-RS, BFMD-DS, and SF-36 mea- sures associated with the PGI-I score 5 (minimal worsen- ing) and PGI-I score 3 (minimal improvement). The second anchor-based method (sensitivity- and specificity- based approach) used receiver operating characteristic (ROC) curve analysis to identify the MCID thresholds showing the most optimal specificity and sensitivity.
To ascertain the responsiveness of the PGI-I, a distribution-based approach was also used during the estimation of MCID values. Effect-size values (Cohen’sd) were calculated34 and, as has been recommended, changes in measures corresponding to a small effect size (approximately 0.2) were applied for determining the MCID cut-off values.31,34
All statistical analyses were performed using the IBM SPSS software package (version 24.0.2; IBM Inc., Armonk, NY).
Results
A total of 898 paired examinations of 198 patients werefinally analyzed. The number of paired visits, dur- ing which the change in the scores of the assessed scales was associated with a PGI-I score of 3, 4, or 5, was 517. The median number of follow-up visits was four, with the median intervisit interval of 12 months. Base- line characteristics of the study cohort are represented in Table 1.
Changes in treatment for dystonia during follow-up are shown in Supporting Information Table S1. A total of 136 patients (68.7%) were treated with DBS at the last follow-up.
Significant ordinal logistic regression models could be developed between the PGI-I and changes in BFMD-RS (Nagelkerke pseudo-R-square: 0.412; P< 0.01) and BFMD-DS scores (Nagelkerke pseudo-R-square: 0.389;
P < 0.05). We could also build a significant ordinal logistic regression model between the PGI-I and changes in scores of the SF-36 (Nagelkerke pseudo-R- square: 0.461;P< 0.01).
Mean changes in BFMD-RS, BFMD-DS, and SF-36 scores, effect sizes, MCID values, and results of ROC curve analysis for the whole study population are shown in Table 2. Controlling forTOR1Agene testing (TOR1A positive [n = 59] vs. negative cases) did not alter the calculated thresholds considerably (Table 3).
Discussion
The concept of MCID is increasingly used in biomed- ical research for judging whether statistical significance implies clinical relevance. However, MCID scores for the BFMD-RS, BFMD-DS, and SF-36 had not yet been evaluated in the population with segmental and gener- alized isolated dystonia. Therefore, we aimed to calcu- late MCID thresholds for these instruments. Following the recommendations of Revicki and colleagues,31 the cut-off values on the BFMD-RS and BFMD-DS for min- imal, yet clinically meaningful, improvement and wors- ening were 16.6% and 0.5 points and 21.5% and 0.5 points, respectively. Cut-off scores for the PCS, MCS, TABLE 3.Optimal MCID threshold values depending onTOR1A(DYT-1) genetic testing results
Total Population (Mixed) TOR1A-Positive Subgroup TOR1A-Negative Subgroup
MCID MCID MCID
Improvement Worsening Improvement Worsening Improvement Worsening
SF-36 PCS 4.9 –4.5 4.6 –4.7 5.1 –4.5
SF-36 MCS 6.6 –7.2 6.1 –6.7 6.9 –7.4
SF-36 Global Score 6.8 –8.8 6.6 –9.1 6.9 –8.7
BFMD-RS –16.3% 22.1% –14.2% 20.7% –17.2% 19.1%
BFMD-DS –1.05 1.24 –0.97 1.19 –1.08 1.26
and the Global Score of the SF-36 for observing clini- cally meaningful improvement and relevant deterioration regarding HRQoL in dystonia could be set at 5.5 and 5.5, 6.5 and 7.5, and 7.5 and 8.5 points, respectively.
As far as the authors are aware, present MCID esti- mations for the BFMD-RS and BFMD-DS cannot be compared to those of other studies because this is the first report on such threshold values for these instru- ments. Previous studies investigating DBS for isolated dystonia used a threshold value of >25% improvement in the BFMD-RS for considering clinical efficacy and >50% improvement for identifying “good” responders.9,13-17,35 Furthermore, patients having a 25% to 50% decrease in the BFMD-RS have been reported as partial responders.36-38 Using the rec- ommended methods for MCID estimation, we found that the threshold for minimal, yet clinically relevant, improvement in BFMD-RS scores may lie at an even lower level (16.6%). Our MCID threshold may give some explanations for those patients who reported per- ceived improvement despite <25% improvement on the BFMD-RS after DBS.
Some previous studies have already evaluated MCID thresholds for the SF-36 in patients with asthma,39heart disease,39chronic obstructive pulmonary disease,39rheu- matoid arthritis,40 and chronic fatigue syndrome,41 and in patients undergoing total hip42 or knee replacement surgeries,43where MCID values for SF-36 subscales var- ied between 0.4 and 25 points and between 8.3 and 25 points for improvement and decline, respectively.
Although the SF-36 is a general health status measure, application of the aforementioned MCID estimations to dystonia patients may be misleading and inappropriate because MCID is highly dependent on characteristics of the study population.39,44
The concept of MCID was established to overcome the issue of statistical significance not necessarily implying clinical importance. Therefore, our estimations may be useful in judging the clinical relevance of results from previous and future studies by using the BFMD-RS, BFMD-DS, and SF-36 to measure the effectiveness of treatments for isolated dystonia, especially DBS.
According to our MCID calculations, the beneficial effects of neurosurgical procedures for isolated dystonia on the severity of dystonia and disability related to dysto- nia intensify with time, and, after reaching a plateau, they remain clinically relevant during long-term follow-up. In addition, improvements developing a long time after neu- rosurgical interventions exceed the MCID thresholds established in the present study in a more pronounced manner compared to those measured soon after the sur- gery (Supporting Information Tables S2 and S3).
The strength of the present approach lies partly in the simultaneous use of anchor- and distribution-based methods, resulting in similar MCID estimations. In addi- tion, we provide MCID scores for scales evaluating
changes in severity of dystonia both objectively and from patients’ perspectives. The high number of included patients may also ensure reliability and enhance the wider applicability of the calculated thresholds. However, our estimations should be used with caution because differ- ences in characteristics of study populations may exist.
Based on disease severity, our patient population is largely characteristic for patients suitable for DBS ther- apy, but less likely proper for a focal dystonia cohort referred for botulinum neurotoxin treatment. Given that the present study cohort did not include patients with dystonia of genetic origin other than TOR1A gene, acquired dystonia, and pediatric patients, our MCID thresholds are not necessarily feasible in such populations. In addition, although we tried to investigate a relatively homogeneous population (idiopathic and inherited isolated dystonia syndromes with segmental and generalized distribution), a considerable heterogeneity may exist in both motor and nonmotor symptoms, which could not be specifically addressed during the study.
References
1. Girach A, Vinagre Aragon A, Zis P. Quality of life in idiopathic dys- tonia: a systematic review. J Neurol 2019;266:2897–2906.
2. van den Dool J, Tijssen MA, Koelman JH, Engelbert RH, Visser B.
Determinants of disability in cervical dystonia. Parkinsonism Relat Disord 2016;32:48–53.
3. Burke RE, Fahn S, Marsden CD, Bressman SB, Moskowitz C, Friedman J. Validity and reliability of a rating scale for the primary torsion dystonias. Neurology 1985;35:73–77.
4. Ware JE, Jr., Sherbourne CD. The MOS 36-item short-form health survey (SF-36). I. Conceptual framework and item selection. Med Care 1992;30:473–483.
5. Albanese A, Sorbo FD, Comella C, et al. Dystonia rating scales: cri- tique and recommendations. Mov Disord 2013;28:874–883.
6. Eltahawy HA, Saint-Cyr J, Giladi N, Lang AE, Lozano AM. Primary dystonia is more responsive than secondary dystonia to pallidal interventions: outcome after pallidotomy or pallidal deep brain stim- ulation. Neurosurgery 2004;54:613–619; discussion, 619–621.
7. Gruber D, Kuhn AA, Schoenecker T, et al. Pallidal and thalamic deep brain stimulation in myoclonus-dystonia. Mov Disord 2010;
25:1733–1743.
8. Sako W, Morigaki R, Mizobuchi Y, et al. Bilateral pallidal deep brain stimulation in primary Meige syndrome. Parkinsonism Relat Disord 2011;17:123–125.
9. Cif L, Gonzalez-Martinez V, Vasques X, et al. Staged implantation of multiple electrodes in the internal globus pallidus in the treatment of primary generalized dystonia. J Neurosurg 2012;116:1144–1152.
10. Bruggemann N, Kuhn A, Schneider SA, et al. Short- and long-term outcome of chronic pallidal neurostimulation in monogenic isolated dystonia. Neurology 2015;84:895–903.
11. Lettieri C, Rinaldo S, Devigili G, et al. Clinical outcome of deep brain stimulation for dystonia: constant-current or constant-voltage stimula- tion? A non-randomized study. Eur J Neurol 2015;22:919–926.
12. Zhan S, Sun F, Pan Y, et al. Bilateral deep brain stimulation of the subthalamic nucleus in primary Meige syndrome. J Neurosurg 2018;
128:897–902.
13. Vidailhet M, Vercueil L, Houeto JL, et al. Bilateral deep-brain stim- ulation of the globus pallidus in primary generalized dystonia. N Engl J Med 2005;352:459–467.
14. Kupsch A, Benecke R, Muller J, et al. Pallidal deep-brain stimulation in primary generalized or segmental dystonia. N Engl J Med 2006;
355:1978–1990.
15. Sensi M, Cavallo MA, Quatrale R, et al. Pallidal stimulation for seg- mental dystonia: long term follow up of 11 consecutive patients.
Mov Disord 2009;24:1829–1835.
16. Reese R, Gruber D, Schoenecker T, et al. Long-term clinical out- come in meige syndrome treated with internal pallidum deep brain stimulation. Mov Disord 2011;26:691–698.
17. Deli G, Balas I, Komoly S, et al. [Treatment of dystonia by deep brain stimulation: a summary of 40 cases]. [Article in Hungarian].
Ideggyogy Sz 2012;65:249–260.
18. Kranz G, Shamim EA, Lin PT, Kranz GS, Hallett M. Transcranial magnetic brain stimulation modulates blepharospasm: a randomized controlled study. Neurology 2010;75:1465–1471.
19. van Vugt FT, Boullet L, Jabusch HC, Altenmuller E. Musician’s dys- tonia in pianists: long-term evaluation of retraining and other thera- pies. Parkinsonism Relat Disord 2014;20:8–12.
20. Makkos A, Kovacs M, Pinter D, Janszky J, Kovacs N. Minimal clin- ically important difference for the historic parts of the Unified Dyski- nesia Rating Scale. Parkinsonism Relat Disord 2019;58:79–82.
21. Lins L, Carvalho FM. SF-36 total score as a single measure of health-related quality of life: scoping review. SAGE Open Medicine 2016;4:2050312116671725.
22. Beaton DE, Hogg-Johnson S, Bombardier C. Evaluating changes in health status: reliability and responsiveness offive generic health sta- tus measures in workers with musculoskeletal disorders. J Clin Epidemiol 1997;50:79–93.
23. Ariza-Ariza R, Hernandez-Cruz B, Navarro-Sarabia F. Physical function and health-related quality of life of Spanish patients with ankylosing spondylitis. Arthritis Rheum 2003;49:483–487.
24. Angst F, Goldhahn J, Pap G, et al. Cross-cultural adaptation, reli- ability and validity of the German Shoulder Pain and Disability Index (SPADI). Rheumatology (Oxford) 2007;46:87–92.
25. DeVine J, Norvell DC, Ecker E, et al. Evaluating the correlation and responsiveness of patient-reported pain with function and quality-of- life outcomes after spine surgery. Spine 2011;36(21 Suppl.):S69–S74.
26. Boccard SG, Pereira EA, Moir L, et al. Deep brain stimulation of the anterior cingulate cortex: targeting the affective component of chronic pain. Neuroreport 2014;25:83–88.
27. Lucza T, Karadi K, Kallai J, et al. Screening mild and major neurocognitive disorders in Parkinson’s disease. Behav Neurol 2015;
2015:983606.
28. Lucza T, Karadi K, Komoly S, et al. Neurocognitive disorders in Parkinson’s disease. Orv Hetil 2015;156:915–926.
29. Hauser RA, Gordon MF, Mizuno Y, et al. Minimal clinically impor- tant difference in Parkinson’s disease as assessed in pivotal trials of pramipexole extended release. Parkinsons Dis 2014;2014:467131.
30. Horvath K, Aschermann Z, Acs P, et al. Minimal clinically impor- tant difference on the Motor Examination part of MDS-UPDRS.
Parkinsonism Relat Disord 2015;21:1421–1426.
31. Revicki D, Hays RD, Cella D, Sloan J. Recommended methods for determining responsiveness and minimally important differences for patient-reported outcomes. J Clin Epidemiol 2008;61:102–109.
32. Jaeschke R, Singer J, Guyatt GH. Measurement of health status.
Ascertaining the minimal clinically important difference. Control Clin Trials 1989;10:407–415.
33. Horvath K, Aschermann Z, Kovacs M, et al. Minimal clinically important differences for the experiences of daily living parts of Movement Disorder Society-sponsored Unified Parkinson’s Disease Rating Scale. Mov Disord 2017;32:789–793.
34. Cohen J. Statistical Power Analysis for the Behavioral Sciences, 2nd ed. Hillsdale, NJ: Earlbaum; 1988.
35. Kovacs N, Janszky J, Nagy F, Balas I. Changing to interleaving stim- ulation might improve dystonia in cases not responding to pallidal stimulation. Mov Disord 2012;27:163–165.
36. Valldeoriola F, Regidor I, Minguez-Castellanos A, et al. Efficacy and safety of pallidal stimulation in primary dystonia: results of the Span- ish multicentric study. J Neurol Neurosurg Psychiatry 2010;81:65–69.
37. Sakas DE, Leonardos A, Boviatsis E, et al. Constant-current deep brain stimulation of the globus pallidus internus in the treatment of primary dystonia by a novel 8-contact (octrode) lead. World Neuro- surg 2017;103:45–56.
38. Fecikova A, Jech R, Cejka V, et al. Benefits of pallidal stimulation in dystonia are linked to cerebellar volume and cortical inhibition. Sci Rep 2018;8:17218.
39. Wyrwich KW, Tierney WM, Babu AN, Kroenke K, Wolinsky FD. A comparison of clinically important differences in health-related qual- ity of life for patients with chronic lung disease, asthma, or heart disease. Health Serv Res 2005;40:577–591.
40. Ward MM, Guthrie LC, Alba MI. Clinically important changes in short form 36 health survey scales for use in rheumatoid arthritis clinical trials: the impact of low responsiveness. Arthritis Care Res 2014;66:1783–1789.
41. Brigden A, Parslow RM, Gaunt D, Collin SM, Jones A, Crawley E.
Defining the minimally clinically important difference of the SF-36 physical function subscale for paediatric CFS/ME: triangulation using three different methods. Health Qual Life Outcomes 2018;16:202.
42. Quintana JM, Escobar A, Bilbao A, Arostegui I, Lafuente I, Vidaurreta I. Responsiveness and clinically important differences for the WOMAC and SF-36 after hip joint replacement. Osteoarthritis Cartilage 2005;13:1076–1083.
43. Escobar A, Quintana JM, Bilbao A, Arostegui I, Lafuente I, Vidaurreta I. Responsiveness and clinically important differences for the WOMAC and SF-36 after total knee replacement. Osteoarthritis Cartilage 2007;15:273–280.
44. Keurentjes JC, Van Tol FR, Fiocco M, Schoones JW, Nelissen RG.
Minimal clinically important differences in health-related quality of life after total hip or knee replacement: a systematic review. Bone Joint Res 2012;1:71–77.
Supporting Data
Additional Supporting Information may be found in the online version of this article at the publisher’s web-site.