Co-worker Networks and Agglomeration Externalities
Rikard H. Eriksson Department of Geography
and Economic History Umeå University
Umeå, SE-901 87 Sweden
rikard.eriksson@umu.se
Balázs Lengyel
Agglomeration and Social Networks Lendület Research Group Centre for Economic and
Regional Studies Hungarian Academy of
Sciences Budapest 1112 Hungary
lengyel.balazs@krtk.mta.hu and
International Business School Budapest Budapest 1031 Hungary
Key words: co-worker network network density agglomeration specialization productivity
JEL codes: D85
J24 J61 R11 R23
abstract
The present article provides an initial systematic analysis of how social networks influence produc- tivity in regional agglomerations. This is accom- plished by means of matched employer–employee data for the entire Swedish economy for the period 1990–2008, allowing us to construct a weighted co- worker network with aggregated tie weights on the plant level. We find evidence that increasing density of the plant-level network has a positive effect on productivity, particularly in large regional industry- clusters with high degrees of specialization. Triadic closure of ties is, however, negatively linked to productivity, suggesting the importance of nonre- dundant knowledge. Moreover, we find only limited support for the notion that the diversity of linkages within or across regions as such is beneficial for productivity. Instead, we show that the degree of specialization conditions the extent to which both linkages to related industries in the region and non- local ties are beneficial. Our results thus suggest that having dense social networks is a crucial feature of high-performing agglomerations, and that interin- dustry, as well as interregional, linkages are com- pensatory in cases when sufficient industry specialization is absent.
GEOGRAPHY
65
95(1):65–89.www.economicgeography.org
© 2018 The Author(s). Published by Informa UK Limited, trading as Taylor & Francis Group, on behalf of Clark University. This is an Open Access article distributed under the terms of the Creative Commons Attribution License (http://creativecom mons.org/licenses/by/4.0/), which permits unre- stricted use, distribution, and reproduction in any medium, provided the original work is properly cited.
The spatial dimension of network-related learning has long been a core interest in economic geography (e.g., Bathelt and Glückler 2003; Ter Wal and Boschma 2009). It is, for example, well understood that transaction costs are diminished by physical proximity as well as personal connections, which enhance the efficiency of mutual learning (Maskell and Malmberg 1999; Borgatti et al. 2009).
Consequently, most of the learning processes occur within a certain spatial proximity, despite the fact that distant and, presumably, weak ties might pro- vide the region with new knowledge (Bathelt, Malmberg, and Maskell 2004; Glückler 2007).
Social networks are hence argued to strongly shape regional development (Boschma and Frenken2010).
Empirical studies have, however, primarily focused on small-scale examples (Giuliani 2013) or specific cases (Ter Wal 2014). One very important question has therefore largely been overlooked: which struc- ture of social networks induces growth and in which type of industry agglomerations?
The mechanisms underlying how different types of social ties induce agglomeration externalities demand close attention for three main reasons. First, external- ities stemming from agglomeration have long been attributed to the social interaction of the involved actors through increasing the potential for efficient sharing of common goods, high-quality labor market matching, as well as learning via intended or unin- tended interfirm spillovers (Arrow 1962; Duranton and Puga 2004). This has, however, mainly been attributed to abstract notions like the buzz derived from the density of urban agglomerations (Ciccone and Hall 1996; Glaeser 2000; Storper and Venables 2004), with limited empirical evidence explaining the underlying mechanisms of this social interaction.
Second, different agglomerations might benefit dif- ferently from learning through social ties. This is mainly because cohesive local networks benefit from diverse external links, whereas open local net- works gain a great deal from specialized external linkages (e.g., Funk 2014; Ter Wal et al. 2016).
Consequently, the role of networks is not a matter of whether more specialized or diverse linkages trigger positive externalities, as frequently argued in the lit- erature (Kemeny and Storper2015), but more a mat- ter of to what extent the degree of industry specialization and internal network structure influ- ence the role played by different types of local and nonlocal linkages (Fitjar and Rodríguez-Pose2011).
Acknowledgments
We greatly appreciate the help and advice of Attila Varga in coding and Zoltan Elekes in visualizing our network variables. The article benefited greatly from the suggestions of David Rigby, Thomas Kemeny, Koen Frenken, and three anonymous referees.
The authors are grateful to the comments received at ERSA in Vienna, AAG in San Francisco, Geography of Innovation in Toulouse, Networkshop in Pecs, and seminars at Umeå
University. All usual disclaimers apply. Funding for this research was provided by the Swedish Research Council, Grant [2016-01803].
66
Third, despite the wide recognition that social networks influence productivity through both spillover effects and peer pressure, the case-oriented nature of previous empirical studies raises the question of whether network-related findings apply to the labor market in general (cf. Cornelissen, Dustmann, and Schönberg2017).
The objective of the present article is to assess what types of social networks induce agglomeration externalities. This is done by analyzing how the structure of co-worker networks within industries in a region, between industries in the same region, and to the same or different industries in other regions influenced the performance of indus- try-regions (i.e., per industry in each region) in Sweden 1995–2008. Our network is derived from individuals who, at a given point in time, have been working in the same workplace (cf. Beaman and Magruder 2012), since this is the social domain in which most knowledge sharing occurs. According to Storper and Venables (2004), this is because workplaces enable employees to establish cognitive and social proximities that might be maintained even after moving from one workplace to another. Co-worker ties can thus help former colleagues share knowledge (Dahl and Pedersen 2004), which presumably enhances information diffusion (Granovetter 1995; Calvo-Armengol and Jackson 2004), as well as learning and performance (Breschi and Lissoni2009), even across large distances (Agrawal, Cockburn, and McHalle 2006). Because agglomera- tions induce externalities that either reduce the costs or increase the efficiency and information spillovers of the involved firms (Henderson 2003), we focus primarily on changes in productivity.
The present study provides the first systematic empirical evidence for the argument made in economic geography that social networks induce learning and productivity in agglomerations. We achieve this using a unified framework in which local and nonlo- cal linkages combined with intraindustry and interindustry ties are considered. We find evidence that increasing density of the plant-level network has a positive effect on productivity, particularly in large regional industry clusters with high degrees of specialization. Triadic closure of ties is, however, negatively linked to productivity, suggesting the importance of nonredundant knowledge in industry specializations. We also show that the degree of specialization conditions both the extent to which linkages to related industries in the region are beneficial and the impact of nonlocal ties. Our results thus suggest that interindustry as well as interregional linkages are compensa- tory in cases when sufficient industry specialization is not present.
The article is organized as follows. After this introduction, the next section discusses the previous literature and presents our hypotheses. This is followed by the data and methods used to create co-worker ties in the entire economy and to analyze the impact of the network on performance. The penultimate section presents the results, and the final section presents our conclusions.
Literature Review and Hypotheses
Since learning and the diffusion of unstandardized knowledge are embodied in interac- tive processes that require face-to-face interaction (Gertler2003), social interactions have for long been argued to be a core mechanism behind agglomeration externalities (Arrow 1962). However, despite the role ascribed to labor mobility to induce knowledge flows and agglomeration externalities (Breschi and Lissoni2009; Eriksson2011), empirical analyses of social networks between present and former colleagues have nonetheless mainly focused on small samples or specific cases (Dahl and Pedersen 2004; Agrawal, Cockburn, and McHalle2006; Breschi and Lissoni2009). One exception is Lengyel and Eriksson (2017), who propose an approach to defining social networks based on
67
CO-W ORKER NETW ORKS AND A GGLOMERA TION
longitudinal microdata. In essence, they use ideas from labor economics and sociology to define subgroups of workers in plants based on worker characteristics and then show that the density of ties between co-workers within Swedish regions strongly influences regional economic growth. This is basically because dense, compared to sparse, regional networks increase the likelihood of successful interactive learning (Ciccone and Hall1996). While our so-called homophily biased approach (cf. McPherson, Smith-Lovin, and Cook 2001;
Currarini, Jackson, and Pin 2009) resembles that of Lengyel and Eriksson (2017), we advance previous research on the role of social linkages and agglomeration in three key regards, which are detailed below.
Regional within-Industry Networks
First, rather than only looking at region-level network density, we zoom in on a plant- level network to isolate the dynamics of triadic closure (transitivity) from those of network density and measure their effect within industry-regions. As previously shown by Henderson (2003), the absolute regional concentration of plants in a given industry influences productivity due to information spillovers. Building on Arrow (1962), Cornelissen, Dustmann, and Schönberg (2017) argue that this is likely to be an effect of the social networks that either enhance information spillovers or increase the peer pressure that alleviates potential free-rider problems. Here, we propose that this phe- nomenon is related to the cohesiveness of social relations and the diversity of accessible knowledge within such agglomerations, since recent studies reveal a trade-off between cohesion and diversity, claiming that combining them is optimal for achieving creative outcomes (Uzzi and Spiro2005; Aral2016; Ter Wal et al.2016). This literature offers a dual explanation of the role of social network structure in agglomerations.
On the one hand, cohesiveness of social relations should favor Marshall-Arrow- Romer (MAR) externalities, since local connectedness within the agglomeration is related to a pooling effect that enhances both matching and interactive learning, which in turn leads to higher productivity (Montgomery1991; Ciccone and Hall1996; Calvo- Armengol and Zenou 2005). Ideas similar to network-related learning have been employed in relation to industry agglomerations. For example, tightly knit social ties within certain sectors in specialized industrial districts are claimed to enhance the prevalence of MAR externalities, thus fostering incremental innovation and productiv- ity (Asheim 1996; Amin 2000). This is because cohesive local networks enable efficient understanding and transmission of complex knowledge (Singh 2005;
Sorenson, Rivkin, and Fleming 2006). On the other hand, much less attention has been paid to the role of diverse knowledge access in local social networks within industry specializations. This is despite the overwhelming importance of diverse knowledge in job search (Granovetter 1973) and innovation (Burt 1987). Because networks that are overly embedded and too cohesive can lead to lock-in (Grabher 1993; Uzzi 1997), Glückler (2007) argues that novel combinations are important for local network evolution. Building on the studies by Giuliani (2013) and Juhász and Lengyel (2017), we use the concept of transitivity to capture the presence of strong cohesiveness in industry specializations and propose that a negative effect of the indicator would suggest that too much cohesion might harm the impact of MAR externalities. This leads to our first hypothesis:
H1a. Dense, compared to sparse, co-worker networks within a local industry enhance productivity, but transitive linkages hamper productivity.
68
However, the role of cohesiveness is expected to increase with the size of the regional agglomeration, since the accumulated knowledge increases with the size of the agglomeration. In fact, Funk (2014) argues that learning between firms in special- ized agglomerations is facilitated if the internal networks are cohesive, because that is essential in internalizing the local stock of complex knowledge residing in the agglom- eration. Translating this argument to the level of regional industry agglomerations, we propose that the stronger the presence of an industry is in a given region, the greater the need for cohesive networks, because knowledge of the local industry becomes more difficult to internalize. This notion extends our first hypothesis as follows:
H1b.Density of co-worker networks induces productivity in strongly specialized industry- regions more than in weakly specialized industry-regions.
Regional between-Industry Networks
Of course, firms in agglomerations that are too closely connected might run the risk of cognitive lock-in and therefore need access to other sources of knowledge. This could either be through links to other industries in the region, or to the same or different industries in other regions. Our second contribution to the extant literature is therefore to also assess the structure and strength of linkages to other industries in the region. We thereby explicitly link our analysis to the literature advocating the benefits of regional diversity (e.g., Glaeser et al. 1992; Feldman 1999) by arguing that diverse networks across industries in urban areas could be associated with Jacobsian externalities.
However, the diversity of networks alone cannot describe the extent of new knowledge creation, because the relatedness of technologies or skills across sectors also influences the extent of novel combinations. Frenken, Van Oort, and Verburg (2007) therefore propose that an analytical distinction needs to be made between related and unrelated diversity (or variety), where the former leads to new combinations of knowledge that are growth enhancing while the latter causes portfolio effects that can help regions withstand asymmetric shocks and/or induce very radical innovations. To consider this, we make an analytical distinction between the strength of ties to related industries with complemen- tary knowledge and to unrelated, and thus very different, industries in the region. This distinction is based on how skill-related industries are. That is, to what extent two industries share similar human capital endowments (cf. Neffke and Henning 2013).
Due to both the relative cognitive proximity between related industries and the improved interindustry matching, related industries are expected to facilitate productivity-enhanc- ing externalities (Boschma, Eriksson, and Lindgren 2014). Our second hypothesis is therefore formulated as follows:
H2a. Co-worker links to related industries in the region enhance productivity, while knowledge from linkages between very different industries does not.
Despite the fact that more specialized or more diverse regions may produce different types of externalities (Glaeser et al. 1992; Henderson, Kuncoro, and Turner 1995;
Frenken, Van Oort, and Verburg2007), there is still great ambiguity as to what types of linkages the involved actors benefit from. In fact, while Marshall (1920) argued early on that a concentration of similar and related activities would generate externalities related to learning, sharing, and matching, Jacobs (1969) provides no precise answer to the question whether firms in diverse regions benefit more from direct linkages to a
69
CO-W ORKER NETW ORKS AND A GGLOMERA TION
diverse set of activities in the region than from linkages to the same or related industries (Kemeny and Storper2015). Consequently, the local mechanisms underlying agglomeration externalities are often taken for granted in the empirical literature without considering whether the externalities derived from within-industry or be- tween-industry linkages are conditioned by the degree of industry specialization.
As in the case of intraindustry cohesiveness, it is reasonable to expect that the size of the local agglomeration influences the extent to which linkages to other regional indus- tries are beneficial or even necessary. For example, in a study of Italian business groups, Cainelli and Iacobucci (2012) show that the more spatially concentrated an industry is, the lesser the need for interindustry vertical integration within the regional business system due to the amount and complexity of within-industry knowledge. This is likely to particularly be the case for interpersonal networks like co-worker networks, because they tend to be more localized than input–output relations (cf. Singh2005). In the organiza- tional literature, it has been acknowledged for some time that so-called boundary spanning leads to informational advantages through access to external sources of infor- mation (e.g., Tortoriello and Krackhardt 2010). Building on this, Ter Wal et al. (2016) argue that the cognitive schema and the network structure have a joint effect on creative outcomes. Because closed networks offer redundant knowledge (Uzzi1997), linkages to third parties with similar knowledge in an already closed network lead to overembedd- edness. Open networks offer access to diverse and nonredundant knowledge, and links to third parties lacking knowledge complementarities and shared schema in a diverse network could lead to information overload. In the context of agglomeration externali- ties, it is therefore reasonable to expect that less-concentrated industries are less likely to have as ready access to local industry knowledge and therefore need to find new knowledge outside the industry (cf. Funk 2014). Hence, substituting the cognitive schema from Ter Wal et al.’s (2016) argument with the degree of interindustry related- ness, we would expect a trade-off between the degree of specialization and the impor- tance of links to related industries. This leads to the following extension of hypothesis 2a: H2b. Co-worker links to related industries in the same region enhance productivity in weakly specialized industries.
Networks to Other Regions
Third, as regional knowledge constraints can be overcome by fostering interpersonal links across regions (Singh 2005; Agrawal, Cockburn, and McHalle 2006), we relate our analysis to the literature arguing for the need for extraregional linkages (e.g., Bathelt, Malmberg, and Maskell 2004). This is done by assessing whether linkages to other regions are more beneficial if they involve a diverse set of industries or whether linkages to the same industry are better. Recent studies have shown the importance of “long ties” (i.e., ties that connect the region to other regions compared to within-regional ties) when assessing the impact of social networks on regional growth (e.g., Holzbauer et al. 2016). This is basically because long-distance ties are able to diffuse more effective flows of novel information. This aligns with recent arguments in the innovation literature showing that Norwegian firms with a greater diversity of international partners are more innovative compared to firms firmly embedded in the local or national context (Fitjar and Rodríguez-Pose 2011). We thereby formulate our third hypothesis as follows:
70
H3a. Diverse nonlocal linkages enhance industry productivity.
However, the absorptive capacity of regions is crucial to internalizing interregional knowledge spillovers (Caragliu and Nijkamp 2016), and, therefore, the level of spe- cialization should influence the role of nonlocal linkages. Given Boschma and Iammarino’s (2009) findings on the impact of regional trade flows on regional growth in Italy and Boschma, Eriksson, and Lindgren’s (2009) findings on labor flows in Sweden, it is reasonable to expect that long ties as such are not of importance. Of more importance is instead to have linkages to other regions that can provide knowledge different from what is already present in the region. Still, the literature on nonlocal linkages predominately views these as complementary to the local linkages rather as a compensating factor in cases where local knowledge spillovers are missing. In a sample of over two thousand Swedish firms, Grillitsch and Nilsson (2015) show that firms with limited access to local spillovers tend to collaborate more with nonlocal partners compared to agglomerated firms. For the latter group of firms, nonlocal linkages tend to be regarded as complementary to the local pool of knowledge. If this holds true for co-worker linkages as well, we expect that the size of the regional industry would influence whether nonlocal linkages are actually beneficial for produc- tivity. This is likely to also influence which types of nonlocal linkages are beneficial.
Small industry-regions with presumably a limited access to local industry-specific skills and spillovers, are expected to benefit more from nonlocal linkages to the same industry to compensate for the absence of local endowments. For large indus- try-regions, however, nonlocal linkages could be regarded as a complementary factor in cases when particular types of local knowledge are missing. Thus, the existing regional resources need to be considered if we are to actually understand to what extent different types of nonlocal linkages can contribute to learning and productivity. This argument leads to our last hypothesis:
H3b. Co-worker ties to the same industry in other regions enhance productivity in weak specializa- tions, while a diversity of nonlocal linkages enhance productivity in strong specializations.
Data and Methods
Data and Network Creation
To create the co-worker networks, we resort to a longitudinal database of matched employer–employee data obtained from official registers from Statistics Sweden.
Among a wide variety of information, we have access to age, gender, and detailed education codes for all workers in Sweden. These data enable us to identify employee– employee co-occurrence at plants for the period 1990–2008. Co-occurrence tables are generated on a yearly basis, and if employees change workplace during the year, they are listed repeatedly with different plant codes in the same year. Localization of plants is defined by transforming the data from a 100m × 100m grid setting into latitudes and longitudes. Workers without tertiary education are excluded from the data to keep the co-occurrence size at the limit the network creation can handle. Apart from this practical motivation, it is also reasonable to expect that workers with a tertiary education will benefit more from learning by seeing and interacting (Glaeser 2000).
As a result, the data contain 366,336 individuals and 52,872 plants in 1990 and 785,578 individuals and 113,441 plants in 2008.
71
CO-W ORKER NETW ORKS AND A GGLOMERA TION
In co-worker networks, those employees who have spent some period of their career at the same workplace are linked together, and it is widely assumed that employees develop social ties while working together in the same plant (Beaman and Magruder 2012).
However, this assumption is problematic in large plants where employees are not likely to know all their co-workers. Therefore, Lengyel and Eriksson (2017) develop a method to identify the probability of co-worker tie establishment at workplaces, in which they assume that the similarity of co-workers increases the probability of ties (cf. McPherson, Smith- Lovin, and Cook2001; Currarini, Jackson, and Pin2009). Akin to their study, we used three characteristics of employees—direction of education, gender, and age—to identify similar- ity and consequently to calculate the probability of ties between each pair of employees in every plant and every year. Then, in line with previous studies (Glitz2013), we selected the most probable fifty co-workers of each employee in each year and traced these co- occurrences over the full period. As Lengyel and Eriksson (2017) demonstrate, a threshold of fifty co-worker ties is well suited to capturing the clustering of individuals in larger plants while also allowing for all workers in plants of up to fifty employees to know each other.
The calculation of co-worker tie probability is described in more detail in Appendix 1 in the online supplementary file.
The co-worker ties are generated at workplaces, and we assume that these ties hold even after either party in the co-worker pair leaves the plant for another job. Therefore, in this approach the mobility of workers drives the creation of the co-worker networks that link plants and industries. However, ties may lose their strength after the mobility event (Burt 2000). To mitigate this problem, we introduce the strength of co-worker ties of individuals at distinct plants as a function of time of co-working and time spent after termination of co-workership. Motivated by insights from sociology, the natural logarithm is used to index duration of co-workership because“returns in terms of tie strength to increased duration of a relationship decline with increasing length of acquaintance” (Marsden and Campbell 1984, 488). We apply exponential time decay to calculate tie strength after termination of co-workership, which reflects the phenom- ena that the tie loses strength after termination of co-workership but that the slope of the decay steepens only a few years after termination and then smoothes out again (Jin, Girvan, and Newman2001). The calculation of co-worker tie probability is described in more detail in Appendix 1 in the online supplementary file.
We then aggregate the co-worker network on the plant level to calculate independent network variables and investigate their effect on the growth of industry-regions. We also aggregate the network on the industry-region level to solve the endogeneity problem between wage differences and network formula- tion, which we discuss later on (see detailed description of network aggregation in Appendix 1 in the online supplementary file). The regional scale employed in the present study refers to 72 functional local labor market regions defined by the Swedish Agency for Economic and Regional Growth and stems from observed commuting distances between the 290 municipalities in Sweden. Although it could be argued that agglomeration externalities are primarily present at the urban (municipal) scale, this regional definition is chosen for two main reasons.
First, it is important to have regions that reflect local labor markets, because co- worker networks are largely driven by mobility across plants (Collet and Hedström 2012), and mobility is largely confined within functional labor markets (Lengyel and Eriksson 2017). Moreover, previous studies have also shown that it is at the regional scale, compared to the municipality level, where significant size and variation of agglomeration externalities that are not obscured by spatial interdependencies can be found (Boschma, Eriksson, and Lindgren 2014). The 72
number of plants varies considerably across industries. We observe most of the plants in services, in particular in the sectors denoted by two-digit NACE codes 74 (other business services), 80 (education), 85 (health and social work), 50 (sale and repair of motor vehicles), and 52 (retail), while the distribution of plants in manufacturing industries is more even. See Appendix 2 in the online supplemen- tary file for the distribution of plants across industries in 1992 and 2008.
Network Description. Because interplant co-worker networks are generated by labor flows across plants (Lengyel and Eriksson2017), a sufficient number of job moves are needed for the network to develop, which limits the interpretation of the network in the first years for which we have data. Therefore, in this article, the first year we describe the co-worker network is 1992, and we eliminate 1990 and 1991 from the descriptive analysis.
Around two-thirds of the links and even a higher rate of weights are concentrated within functional regions in the beginning of our investigation (Table 1). These shares are still high in 2008 despite their slight decrease due to interregional labor flows over the period. One-third of local ties remain within industries in 1992, and this share decreases over time. The edges within industries are stronger on average than the edges across industries. For more information on the plant-level network that constitutes the industry-region network, see Appendix 3 in the online supplementary file.
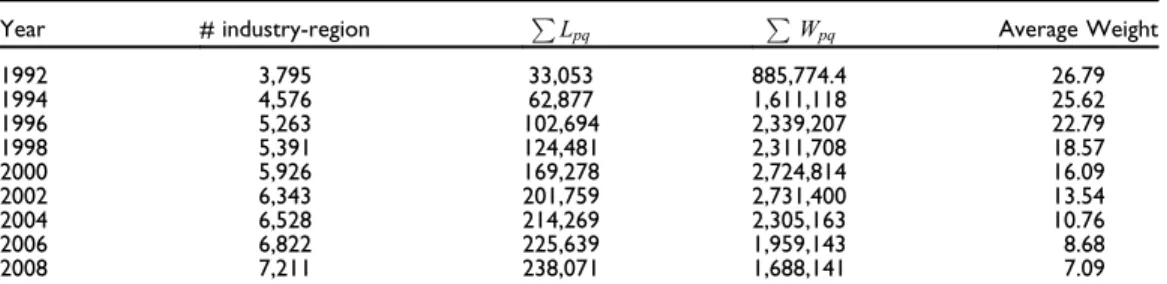
The number of industry-regions and the number of edges are growing over the full period, but the sum of the weights reaches its maximum at half of the period (Table 2).
These industries are connected with a monotonically growing number of unweighted links (column 3). However, the increase in the sum of weights defined by equation IV in Appendix 1 in the online supplementary file seems to slow down after 1996, and there is even a maximum in year 2002, after which it decreases slightly (column 4).
This implies that there are more and more weak ties in the network and that the average weights of the edges are monotonically decreasing (column 5).
The probability distribution of weighted degrees seems to have a very similar pattern in 1992 and in 2008 (Figure 1A). The curve is shifted down over the period, which is due to the increased number of industries. More importantly, the Kernel density visualization reveals a normal distribution of weighted degrees in 2008 (Figure 1B), meaning that the
Table 1
The Number and Weight of Plant Ties within Regions and Industries, 1992 and 2008.
1992 2008
PLukl P
Wkl P
Lukl P Wkl
Across regions 38,551
(33%)
174,401.8 (20%)
520,309 (41%)
415,773.5 (25%)
Within regions 77,872
(67%)
711,974.9 (80%)
764,309 (59%)
1,273,877 (75%)
SUM (100%) of links 116,423 886,376.8 1,284,618 1,689,650
Across industries in the region 54,227 (70%)
386,536.7 (54%)
612,856 (80%)
823,038 (65%) Within industries in the region 23,645
(30%)
325,438.2 (46%)
151,453 (20%)
450,839 (35%)
SUM (100%) of links within regions 77,872 711,974.9 764,309 1,273,877
Note: regions denote the 72 functional regions in Sweden and are equivalent to labor market areas. Industries are defined by 4-digit NACE codes. Luklrefers to the number of individual co-worker links between plantskandl, Wkl
denotes the aggregated strength of ties between plantskandl.
73
CO-W ORKER NETW ORKS AND A GGLOMERA TION
consideration of time in edge weighting—both co-working and decay—normalizes the weighted degree distribution.
However, the weighted degree of industry-region pis highly dependent on the size of the industry-region. For example, the number of employees (Figure 2A) as well as the number of plants (Figure 2B) in the industry-region is positively associated with the weighted degree.
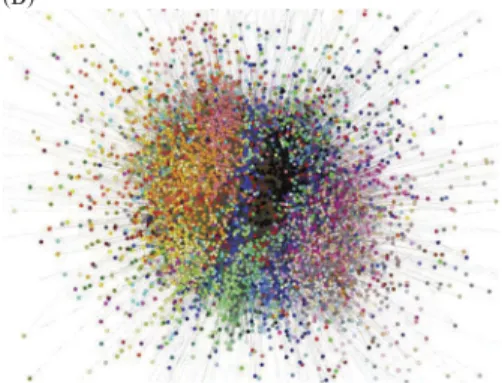
We plotted the weighted networks for the years 1992 and 2008 (Figure 3). Because we used a spring algorithm—in which strongly connected industry-regions are pulled together—and used identical colors for regions, the co-location of the same colored nodes in the plot illustrates the importance of co-location of industries in regions. In other words, co-located industries seem to develop strong ties over time. However, there are also strongly connected industry-regions that are not co-located.
To sum up, the weighted co-worker network across plants and industry-regions promises us interesting insights into the mechanisms behind local knowledge externalities.
Dependent Variable
This article uses per capita labor productivity at the level of industry-region as the main dependent variable to investigate how dynamic agglomeration economies prevail through co-worker networks (Rosenthal and Strange2004; Frenken, Van Oort, and Verburg2007).
While many other studies define labor productivity as per capita value added, we chose per capita wages instead. This is motivated by the fact that wages tend to be considered the best available proxy for worker productivity (Kemeny and Storper 2015), because worker productivity tends to be expressed in higher wage levels in cities and regions (Combes, Duranton, and Overman2005; Feldstein2008). Since wages are directly linked to each plant, while value added is attributed to firms, it is also less straightforward to allocate value added in multiplant firms across different regions (see, e.g., Eriksson2009for a thorough discussion). All prices are adjusted to 2016 price levels. We have also estimated an alternative specification adjusting all regional incomes to the average housing costs to control for regional differences in purchasing power. This did not alter the main interpre- tation of the results.
Independent Variables
One can assume that co-worker links are endogenously created by wage dynamics because wage differences are major motivations underlying interfirm labor flows.
Table 2 Nodes and Links in the Industry-region Network, 1992–2008
Year # industry-region P
Lpq P
Wpq Average Weight
1992 3,795 33,053 885,774.4 26.79
1994 4,576 62,877 1,611,118 25.62
1996 5,263 102,694 2,339,207 22.79
1998 5,391 124,481 2,311,708 18.57
2000 5,926 169,278 2,724,814 16.09
2002 6,343 201,759 2,731,400 13.54
2004 6,528 214,269 2,305,163 10.76
2006 6,822 225,639 1,959,143 8.68
2008 7,211 238,071 1,688,141 7.09
Note:Lpqrefers to the number of individual co-worker links between industriespandq, Wpqdenotes the aggregated strength of ties between industriespandq.
74
Given that such flows are instrumental to the creation of co-worker links, we need to handle the potential endogenous connection between the growth of industry-regions and their co-worker networks. This is done by estimating the strength of ties from the volume of previous industry–industry labor flows and using the remaining error term for weighting network variables. Exponential time decay is assumed, considering the effect of labor flows on the strength of co-worker links, which is identical to the decay function used in the co-worker network creation. For further explanation of the endogeneity issue that might arise due to potential wage differences, see Appendix 4 in the online supplementary file.
Variables that characterize the plant-level co-worker networks within industry- regions are used to uncover the prevalence of MAR externalities through network cohesion effects (Uzzi 1997). The first explanatory indicator is network density (DENS). It is measured by the share of observed links as compared to the number of possible links between plants in industry regions, and we multiply this ratio by the error term of estimated tie weights. Therefore, high values of DENS denote that plant networks within industry-regions are tightly connected and consist of relatively strong individual links. Further, we apply network transitivity (TRANS), also called triadic closure or global clustering, to capture the level of embeddedness in industry-regions.
As exemplified in Figure 4, compared to DENS that assess the actual linkages within
(A) (B)
Figure 1. Weighted degree distributions of industry-regions, 1992 and 2008.
Note: (A) Weighted degree distribution of industry-regions in 1992 and 2008. The integer of weights has been used for binning. (B) Univariate Kernel density distribution of industry-region weighted degree, logarithmic scale.
(A) (B)
Figure 2. The strength of industry-regions in the co-worker network as the function of their size, 1992 and 2008.
Note: (A) Strength of industry-regions by edge weights versus the number of employees, 1992 and 2008. (B) Strength of industry-regions by edge weights versus the number of plants, 1992 and 2008.
75
CO-W ORKER NETW ORKS AND A GGLOMERA TION
industry-regions, TRANS measures the number of triangles among all possible trian- gles in the network. The connection between network cohesion and MAR externalities is not trivial. On the one hand, tightly knit networks fasten information flow, favor trust, and help collaboration of firms within industry-regions as well as ease the transfer of complex and tacit knowledge. On the other hand, too much cohesion is often claimed to drive the region into lock-in. For a detailed formulation of DENS and TRANS variables, see Appendix 5 in the online supplementary file.
We capture the connections to co-located industries by exploring how ties to related and unrelated industries, respectively, favor growth. This is done by first constructing a matrix of skill-related industries (Neffke and Henning 2013) based on the methodology recently developed by Neffke, Otto, and Hidalgo (2016). In short, industry-to-industry combinations are defined as related if the observed level of labor flows exceeds the expected level of labor flows between the industries. This counts for about 50 percent of all cases. Then, we construct the connection variable to related (REL) and to unrelated (UNREL) industries, as exemplified in Figure 4, by calculating the ratio of observed plant-level ties over all possible plant-level ties across the industry pairs and multiplying this density type of measure by the error term of estimated tie weights. Therefore, high values of REL and UNREL mean that the plants of the industry-region are relatively likely to be connected to related or unrelated plants and also have relatively strong individual connections. For a detailed formulation of REL and UNREL variables, see Appendix 5 in the online supplementary file.
The importance of interregional connections is addressed using two diversity indi- cators (Eagle, Macy, and Claxton2010). First, we compute the diversity of links to the same industries in distinct locations (DIVSAME) to assess whether it is beneficial to have strong linkages to the same industry in many different regions or in only a few (see Figure 4). Second, agglomerations may not only benefit from having nonlocal linkages to the same type of activities but also to a diversity of industries in other regions (Fitjar and Rodríguez-Pose 2011). We therefore calculate the diversity to distant and different industries (DIVOUT), as exemplified inFigure 4. In both cases,
(A) (B)
Figure 3. Industry-region network, 1992 and 2008.
Note: Self-loops have been filtered out and only the giant component is visualized. Identical colors were used to illustrate regions (e.g., Stockholm is black). A spring algorithm was used to pull those industry-regions together. (A) The weighted industry-region network, 1992. Only the edges stronger than 1 have been illustrated. (B) The weighted industry-region network, 2008.
Only the edges stronger than 1 have been illustrated.
76
we use the normalized entropy indicator of diversity, which we calculate from the error term of the estimated industry-industry links. Because only a few industry-regions have a high number of connections, which eventually gives us a very long-tailed distribu- tion, we log transformed the above diversity indicators. See Appendix 5 in the supplementary online file for a detailed variable formulation.
We also include a number of control variables that are known to influence productivity.
First of all, the degree of specialization, the diversity and size of the region, and the regional human capital endowments are all likely to strongly influence economic growth (e.g., Glaeser et al.1992; Henderson2003; Kemeny and Storper2015). We therefore construct an indicator of regional specialization by means of the number of plants in each four-digit industry-region (ABSSPEC).1 We expect specialization to positively influence productivity due to the potential benefits arising from strong industry agglomerations. Absolute numbers (rather than relative) are used, since the absolute concentration of plants in an industry much better captures specialization than do relative measures, which are dependent on the distribution of other sectors (cf. Kemeny and Storper2015). Apart from industry specialization, the diversity of activities in the region and the mere size of the region may also influence performance (Feldman1999; Glaeser2000). A diverse regional economy (DIVERSITY) is defined by means of an entropy measure comparing the number of employees in each two-digit industry in each region with the total number of employees in a region (Jacquemin and Berry1979).
Regional size (REGSIZE) can, on the one hand, be assumed to influence the potential for spillovers, irrespective of the sectoral composition of regions. Such urbanization externalities Figure 4. Schematic visualization of network variables.
1 Due to the potential problem of granularity, the level of aggregation of sectors may influence our results.
Consequently, we also summarized the presence of three-digit industries and regressed that in our models. The results were largely unaffected.
77
CO-W ORKER NETW ORKS AND A GGLOMERA TION
capture the concentration of economic, social, political, and cultural functions, as well as infrastructure and pooling that could be assumed to be a function of size (Frenken, Van Oort, and Verburg 2007; Ellison, Glaeser, and Kerr 2010). On the other hand, size may also adversely influence productivity. Combes (2000), for example, argues that size may lead to pollution and congestion costs. Irrespective of the empirical outcome, size is expected to capture important features of agglomeration that are not measured through any other vari- ables. REGSIZE is defined by summing the number of employees in the region (excluding the industry in question to avoid double counting). Apart from specialization and size, which are two different proxies for concentration, the composition of employees is also likely to influence economic growth. We therefore control for the human capital levels in each region (HC). Similar to many other studies, this is defined as the share of employees with at least a bachelor´s degree compared to the total number of employees in the region.
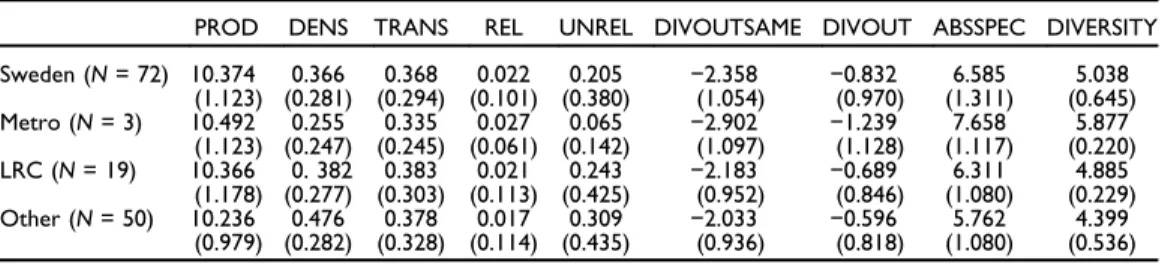
Table 3shows how network variables vary across the regional hierarchy. Industries in larger regions, on average, score lower on all network variables except REL. Hence, networks to related industries are more common in larger regions. These numbers also indicate that while larger regions on average have larger industry-clusters (ABSSPEC) and a more diverse industry structure (DIVERSITY), DENS is lower in the largest metropolitan regions (Stockholm, Gothenburg, and Malmö), and cross-industry interac- tions across a wide diversity of industries (UNREL) are more frequent in smaller regions.
Confirming the findings of Lengyel and Eriksson (2017), this implies that size and diversity as such cannot automatically be translated into high within- or between-industry interactions. However, while DENS on average is higher in smaller regions, TRANS is also higher. This might imply an increasing risk of cognitive lock-in that could explain differences in productivity between small and large regions (Juhász and Lengyel2017).
Finally, although industries in metropolitan regions are on average more productive than in other regions, the interregional differences are negligible. Detailed descriptions of all variables are found in Appendix 6 in the online supplementary file.
Moreover, the average size of plants (AVGSIZE) is included in the models, since previous studies have shown that productivity can be a function of the distribution of firms within a given industry (Acs, Morck, and Yeung1999) and because the size of the firms may influence the potential of interfirm co-worker networks. The latter aspect is because a high absolute specialization could be driven by the fact that one large firm dominates the region. Finally, an essential feature of productivity-inducing agglomera- tion externalities is the presence of input–output linkages in the region (Ellison, Glaeser, and Kerr 2010). Such local buyer–supplier networks may, for example, capture additional benefits in terms of the interindustry spillovers embodied in material flows between sectors (Rigby and Brown2015). Following the approach of Rigby and Brown (2015), we only assess the upward linkages because downward and upward linkages are too strongly correlated to be estimated in the same model (both were regressed independently in the model and yielded similar results). To assess the regional variation of upstream connections for each four-digit industry in each region, we used national input–output data to create the following upstream supplier-weighted location quotient based on the total value of shipments in each industry. Industries scoring high on this input–output indicator (IO) are located in regions with strong supplier linkages, which is expected to positively affect growth. All control variables are log transformed to reduce the impact of skewed distribution. As shown in Appendix 6 in the online supplementary file, where descriptive statistics and a correlation matrix are displayed, no serious issues related to multicollinearity are present, and this is also confirmed by subsequent variance inflation factor tests.
78
Results
Estimation Framework
Fixed effect (FE) panel regression models are applied to analyze the statistical relation between the created indicators and productivity in industry-regions. In simple form, the equation could be specified as
yi;t ¼β0Xi;t1þγ0Zi;t1þλiþεi;t (1) whereydenotes labor productivity per capita,tdenotes one-year intervals from 1995 to 2008, i denotes the industry-region, X stands for the set of explanatory variables, λi
denotes industry-region fixed effects,Zstands for a set of control variables of our base model described above, andεis the case- and time-specific error term. We restrict our models to the period 1995–2008 for two main reasons: first, because of the deep recession that hit the Swedish economy in the early 1990s and then the latest recession that hit Sweden in 2009; second, to be consistent with subsequent generalized methods of moments (GMM) estimations in the robustness checks.2The analysis is thus framed in a period of strong macroeconomic growth, although some industry-specific shocks have appeared (e.g., the bursting of the information and communication technology bubble in the early 2000s).
The rationale for using this type of model is that it allows us to explicitly control for unobserved heterogeneity across industry-regions such as local labor market conditions not captured by the controllers or by the definition of industries and functional regions, which in itself may help reduce the impact of endogeneity. This is highly relevant in the Swedish case, due to the great variety of local labor markets in terms of size, population, and economic structure. Moreover, owing to the within estimator that characterizes the fixed-effect model, it conditions how a change in, for example, network density influences a change in productivity over time. Thus, compared to a cross-sectional model (or a pooled ordinary least squares [OLS] model) where the between effect is emphasized (i.e., differences between cases), this approach empha- sizes the dynamic relationship between our explanatory variables and the dependent
Table 3 Main Variables along the Regional Hierarchy
PROD DENS TRANS REL UNREL DIVOUTSAME DIVOUT ABSSPEC DIVERSITY Sweden (N= 72) 10.374 0.366 0.368 0.022 0.205 −2.358 −0.832 6.585 5.038
(1.123) (0.281) (0.294) (0.101) (0.380) (1.054) (0.970) (1.311) (0.645) Metro (N= 3) 10.492 0.255 0.335 0.027 0.065 −2.902 −1.239 7.658 5.877
(1.123) (0.247) (0.245) (0.061) (0.142) (1.097) (1.128) (1.117) (0.220) LRC (N= 19) 10.366 0. 382 0.383 0.021 0.243 −2.183 −0.689 6.311 4.885
(1.178) (0.277) (0.303) (0.113) (0.425) (0.952) (0.846) (1.080) (0.229) Other (N= 50) 10.236 0.476 0.378 0.017 0.309 −2.033 −0.596 5.762 4.399
(0.979) (0.282) (0.328) (0.114) (0.435) (0.936) (0.818) (1.080) (0.536) Note: Mean values and standard deviations (in parentheses) of the network variables and further explanatory variables for all industries in Sweden, and in the metropolitan regions, large regional centers (LRC) and other small regions, respectively.
2 In additional GMM models, we introduced two lags of instruments, which limits the timescale to 1995–2008.
79
CO-W ORKER NETW ORKS AND A GGLOMERA TION
variable over time. The fixed-effect approach thus permits us to model changes in productivity in one regional agglomeration in relation to changes in network variables over time in that particular unit. A Hausman test comparing a random-effect model with the fixed effect model also confirms that the fixed-effect model is more efficient.3 We reduce the risk of reversed causality influencing the results by having all explana- tory variables measured the year before the dependent variable. All models contain a full set of year-fixed effects to control for time-related unobserved heterogeneity like business cycles and time-specific shocks, and cluster robust standard errors at the four- digit industry-level.
Network Effect on Productivity
To estimate how differences in network structure are translated into differences in productivity between industry-regions, we employ a stepwise estimation strategy (Table 4). First, we assess the impact of only the control variables in Model 1.
This is followed by the network variables (excluding the control variables) in Model 2. Model 3 then contains all network and control variables regressed jointly. Since the motivation for this article is to particularly highlight the role of co-worker networks in agglomerations, we then test different interaction effects at the regional scale in Model 4 to address the potential influence of specialization as hypothesized in H1b, H2b, and H3b. Although this estimation strategy may lead to omitted variable bias as theoretically relevant indicators are excluded from Models 1 and 2, this approach has the advantage of potentially revealing the effects of each set of variables on productivity and whether that is influenced by the other covariates.
Finally, we estimate employment growth in Model 5 to articulate that co-worker networks induce employment in regions through different mechanisms than are at work in the case of productivity. Before turning to the discussion of our results, it should be noted that all variables in Models 1–5 have been regressed individually as well to determine any impact of potential multicollinearity, but all signs and levels of significance were robust.
Starting with Model 1, we find that the control variables all show expected signs:
Absolute specialization, human capital, and dense local buyer–supplier linkages are all positively linked to productivity at the same time as some scale effects are present (Ellison, Glaeser, and Kerr2010; Boschma, Eriksson, and Lindgren2014; Kemeny and Storper 2015; Rigby and Brown 2015). While the negative estimate of regional size could reflect potential congestion effects (Combes2000), it is also partly driven by the fact that absolute industry concentration is in many cases confounded in the measure- ment of size. Industry diversity per se is not correlated with productivity, which could be expected given that productivity-inducing externalities are primarily channeled via incremental innovations in specialized agglomerations (Henderson 2003).
Because the findings on the network variables only, estimated in Model 2, are robust when regressed together with the control variables, we move directly to discuss the results of Model 3. Based on this, we can confirm H1a, which states that dense (as supposed to sparse) networks facilitate productivity by speeding up
3 The results when the between-case variation is also included are identical except for two notable cases:
TRANS and REL are strongly positive in the RE model (as in a pooled-OLS). This implies that high cohesiveness is beneficial, but when assessing this with a within estimator, the results show that increasing cohesiveness hampers growth. This also shows that having many and dense linkages to related industries is correlated to high productivity but that increasing linkages is not significantly correlated with growth.
80
information flow and knowledge sharing in the local industry but that too cohesive networks may lead to lock-in. In fact, the positive coefficient of DENS implies higher than average productivity growth in those industry-regions where the co- worker network becomes denser over time. Yet, the negative sign of TRANS indicates that new links harm productivity growth if they are closing triangles in the network. Given that network density could be argued to be a proxy for pooling that both enhances learning and matching (Duranton and Puga 2004), this points to the fact that productivity-enhancing knowledge might flow much easier in indus- tries sharing a pool of skilled labor (cf. Eriksson and Lindgren 2009). However, as indicated by the negative estimate on transitivity, this is mainly the case when weak ties are present, as too cohesive networks might cause an accumulation of redun- dant knowledge that impedes learning. Thus, this finding indicates that
Table 4 Productivity Growth Models
1 FE 2 FE 3 FE 4 FE 5 FE
PROD PROD PROD PROD EMP
DENS 0.312*** 0.282*** −0.450 0.051
(0.116) (0.060) (0.310) (0.261)
TRANS −0.070** −0.076*** 0.049 0.203**
(0.033) (0.026) (0.167) (0.103)
REL 0.193 0.153 1.888** 1.487
(0.138) (0.126) (0.790) (0.984)
UNREL 0.274*** 0.112* 0.293 0.232
(0.097) (0.065) (0.375) (0.200)
DIVOUTSAME 0.008 0.008 0.098** 0.066*
(0.009) (0.008) (0.046) (0.034)
DIVOUT 0.017 0.007 −0.008 0.053*
(0.018) (0.014) (0.043) (0.032)
ABSSPEC 0.094** 0.118** 0.061* 0.494***
(0.052) (0.047) (0.059) (0.047)
DIVERSITY −0.025 −0.036 −0.051 −0.051
(0.136) (0.129) (0.118) (0.057)
REGSIZE −0.010*** −0.009*** −0.009*** −0.003
(0.003) (0.003) (0.003) (0.002)
HC 0.052** 0.048** 0.045** 0.016
(0.020) (0.019) (0.019) (0.017)
IO 0.003*** 0.002*** 0.002*** 0.001***
(0.001) (0.001) (0.001) (0.001)
AVGSIZE 0.003*** 0.002*** 0.002*** 0.000
(0.001) (0.001) (0.001) (0.000)
DENS#ABSSPEC 0.123** −0.012
(0.056) (0.046)
TRANS#ABSSPEC −0.021 −0.034*
(0.029) (0.018)
REL#ABSSPEC −0.243** −0.205
(0.118) (0.151)
UNREL#ABSSPEC −0.029 −0.032
(0.059) (0.031)
DIVOUTSAME#ABSSPEC −0.013* −0.008
(0.007) (0.005)
DIVOUT#ABSSPEC 0.002 −0.008*
(0.008) (0.005)
Intercept 9.764*** 10.098*** 9.629*** 10.099*** 2.433***
(0.857) (0.067) (0.808) (0.843) (0.476)
Year FE Yes Yes Yes Yes Yes
R2(within) 0.211 0.159 0.225 0.233 0.432
R2(overall) 0.390 0.191 0.491 0.494 0.430
N 11,425 11,425 11,425 11,425 11,425
Note: Fixed effect (FE) estimations with cluster-robust standard errors at four-digit industry level within brackets.
Significant at 10 percent (*), 5 percent (**), and 1 percent (***)
81
CO-W ORKER NETW ORKS AND A GGLOMERA TION
overembeddedness in the regional knowledge base could be harmful to the devel- opment of an industry (Uzzi 1997; Aral 2016).4
The role of links to other industries in the region as formulated in H2ais reflected by our variables on the links to related (REL) and unrelated (UNREL) industries. The findings suggest that it is indeed beneficial for industries to build new connections to other industries in the region. This is, however, only the case concerning unrelated industries, while new links to related industries alone do not seem to be important.
These findings thus support the literature advocating the virtues of diversity (e.g., Feldman 1999), although not industry diversity (DIVERSITY) per se, but rather diversity of social ties. Hence, we cannot fully confirm H2a, which states that links to complementary industries should be more important.
Although our descriptive findings indicate that a substantive part of the co-worker linkages work across regions (circa 40 percent), Model 3 shows that neither the diversity of interregional linkages (DIVOUT) nor the diversity of interregional lin- kages to the same industry (DIVOUTSAME) have any statistical relationship with productivity. These nonsignificant estimates imply that we have to reject H3a on the assumed positive impact of nonlocal ties. Our results thereby, to some degree, contra- dict previous findings in the literature that highlight the role of both the magnitude and composition of interregional trade linkages (Boschma and Iammarino 2009), telecom- munication networks (Eagle, Macy, and Claxton2010; Holzbauer et al.2016), or labor flows (Boschma, Eriksson, and Lindgren 2009).
Before moving on to the next model, some key deviations between Models 1, 2, and 3 should be highlighted: When adding the control variables in Model 3, the coefficient for specialization grows in magnitude, while the size of the coefficients for the other con- trollers and the network variables decreases. This is particularly the case for DENS and UNREL, of which the latter also loses in significance. The negative impact of TRANS, however, grows in magnitude. All this points to the fact that the role of co-worker ties within regional industries, as well as between industries in the region, is contingent on the degree of industry specialization. Finally, it is worth noting that the explanatory power of the respective models ranges between 16 percent (Model 2) and 23 percent (Model 3), which, given the many observations at hand, is satisfying. In particular, it shows that the networks themselves explain about 16 percent of the total variation.
To formally assess the potential confounding role of specialization discussed in relation to H1b, H2b,and H3b, we then include a full set of interaction variables between specialization and the respective network indicators in Model 4. Some interesting features appear related to our hypotheses.
First, neither the main effect of density nor that of transitivity remains significant.
While both the size of the coefficient and the level of significance for specialization decrease, the interaction between specialization and density is positively significant.
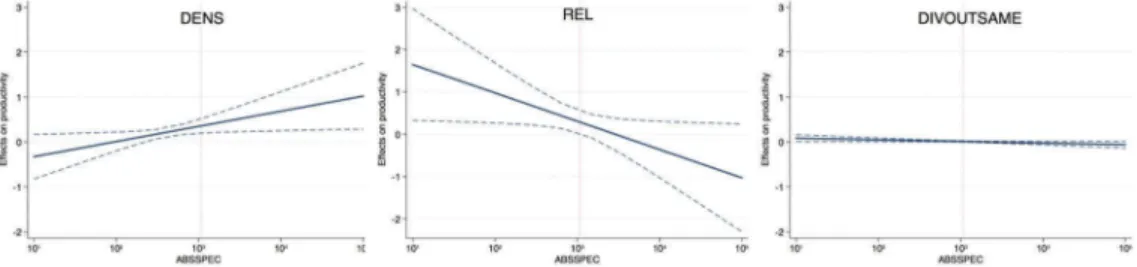
This latter finding implies that it is not density or specialization, respectively, alone that is important for productivity. Instead it is the combination thereof that matters. Thus, industry specializations that are also characterized by a high density of co-worker ties tend to be more productive, while transitivity does not increase the effect of absolute specialization. In all, this confirms H1b, which states that a certain level of cohesive- ness is needed to make use of a relatively larger stock of local knowledge (cf. Funk 2014). As depicted graphically inFigure 5, this is the case from roughly two standard
4 In an alternative specification, using the squared term of DENS instead of TRANS, we find a reversed U-shape association between co-worker network density and productivity growth. This further supports our result showing that a medium level of cohesion in interfirm network is optimal for growth.
82
deviations below the median value of specialization (vertical line), which includes about 95 percent of all observations. The remaining 5 percent are overrepresented in the metropolitan regions (62 percent compared to 22 percent in the total sample) and consist of ten different two-digit sectors, of which other business services (45 percent), veterinary clinics (22 percent), and sports centers (19 percent) are clearly overrepre- sented compared to the total sample.
Second, the main effect of connections to related industries in the region (REL) turns significantly positive, while the interaction between REL and specialization is negatively correlated with growth. Both the main effect of UNREL and the interaction are insignifi- cant. These findings indicate that local interindustry links to related industries do indeed matter for productivity, but mainly in industries that are not able to enjoy the same within- industry externalities. Hence, as shown in the cases of both vertical integration (Cainelli and Iacobucci 2012) and firm-level knowledge networks (Funk 2014), the degree of regional specialization influences the need for linkages extending beyond one’s own industry. Confirming H2b, we find that this is particularly the case for related industries in the region. As shown inFigure 5, the point where related linkages turn negative is about one standard deviation above the median value of specialization. This translates into about 16 percent of all observations. In contrast to density, this part of the sample is overrepre- sented in the smallest regions (67 percent compared to 30 percent in the total sample).
Given that related linkages are more frequent in larger regions (seeTable 3), this implies that strongly specialized sectors in smaller regions tend to be more isolated than their respective counterparts in larger regions. As discussed above, this often translates into higher density andtransitivity, which may cause negative lock-in effects. This notion is reflected in the greater number and variety of two-digit sectors (all but twelve sectors) among these observations, but in particular as the most frequent sectors represented in this group are health care (28 percent) and education (23 percent)—two sectors that in many smaller regions constitute a distinct segment of the local labor market.
Finally, as expected according to H3b, we do find a moderate, but significant, negative relation between ABSSPEC and DIVOUTSAME, while DIVOUTSAME turns moderately positively significant. However, as shown in Figure 5, this relation- ship with productivity is small compared to density and relatedness. Taken together, these findings imply that interregional pipelines per se do not matter as Bathelt, Malmberg, and Maskell (2004) suggest but that the effect thereof is dependent on the characteristics of the agglomeration. The interaction term suggests that strong regional industry concentrations are less dependent on having a wide number of linkages to the same industry in other regions, while the positive estimate of DIVOUTSAME indicates that it is more important for less specialized industries.
Hence, our findings support the notion of Grillitsch and Nilsson (2015) that nonlocal linkages could be regarded as compensatory for less specialized industries that need to find same-industry expertise in other locations, while being more of a complement to more specialized industries (cf. a similar discussion by Cainelli and Iacobucci2012on vertical integration).
Still, different types of mechanisms might drive different forms of growth, and we do not expect to find similar results on a different goal variable. Therefore, we also estimated a model using employment per industry-region as a dependent variable in Model 5. In short, the employment model also indicates the pervasiveness of industry specialization (larger industries tend to grow faster) but indicates a somewhat different pattern for DENS and TRANS. It is not density, but rather transitivity, that is of importance, particularly in weak specializations, since the interaction between special- ization and transitivity is negative. The results also suggest that while links to related
83