Social markers of a pandemic: modeling the
association between cultural norms and COVID-19 spread data
Máté Kapitány-Fövény 1,2✉ & Mihály Sulyok 3,4
While cross-national differences of the epidemic curves of COVID-19 become evident, social markers of such variability are still unexplored. In order to investigate how certain social norms may underlie the heterogeneity of the spread of infections, global social data (including cultural values, indices of prosperity, and government effectiveness) and covari- ates (such as climate zone, economic indicator, and healthcare access and quality) of early transmission dynamics of COVID-19 were collected. Model-based clustering and random forest regression analysis were applied to identify distinct groups of societies and explore predictors of COVID-19 doubling time. Clustering revealed four groups: (1) reserved; (2) drifting; (3) assertive; and (4) compliant societies. Compliant societies from dry climate zones showed the highest doubling times in spite of increased population densities. Most relevant predictors of doubling time were population density, freedom of assembly and association, and agency, underlining the importance of social factors in the hetereogeneity of COVID-19 transmission rates. Our cluster typology might contribute to the explanation of cross-national variability in early transmission dynamics of highly infectious diseases.
https://doi.org/10.1057/s41599-020-00590-z OPEN
1Faculty of Health Sciences, Semmelweis University, Vas utca 17, 1088 Budapest, Hungary.2NyírőGyula National Institute of Psychiatry and Addictions, Lehel utca 59, 1135 Budapest, Hungary.3Institute of Tropical Medicine, Eberhard Karls University, Wilhelmstraße 27, 72074 Tübingen, Germany.4Department of Pathology and Neuropathology, Eberhard Karls University of Tübingen Liebermeisterstraße 8, 72076 Tübingen, Germany.
✉email:m.gabrilovics@gmail.com
1234567890():,;
Introduction
T
o date, the novel coronavirus, SARS-CoV-2 caused more than a million confirmed infection (COVID-19) worldwide (Dong et al.,2020). As the pandemic spreads, considerable cross-national differences of the epidemic curves become evident.The scientific community strives to provide satisfactory models to capture the factors of such underlying variability. These initial models explore the impact of government’s response stringency (Fang et al.,2020), travel restrictions (Kucharski et al.,2020), or the mean duration of infectiousness (Anderson et al., 2020) on COVID-19 transmission rates. And while key aspects of the transmission dynamics of COVID-19 remain partially unclear from a scientific point of view, public opinion, beliefs and atti- tudes about and towards the pandemic are predominantly formed by mainstream media, press coverage, and governmental communication.
As per our current understanding, the most appropriate gov- ernmental response to the pandemic is ordering broader-scale social distancing and thus decreasing transmission rates, that provides the necessary time for health services to increase their capacity, and for laboratories to develop effective vaccines (Anderson et al., 2020). However, government response strin- gency is one thing, while population reaction to mitigation efforts is a horse of another color, that brings us to the key question of the present paper: what are the main social markers of COVID-19 spread rates? What kind of social norms form the outbreak’s national picture? Is it the individual’s willingness to provisionally disclaim his/her fundamental rights and freedoms in a time of essential restrictions? Or is it the discipline and compliance of the majority that matters? Does sociability, network density, or the norm of civic participation play a crucial role in reducing the required physical distancing? Or is it rather the accustomed freedom of assembly and association that makes it challenging to accommodate governmental regulations?
Former empirical findings related to the social and cultural background of certain pandemics (e.g. H1N1, zoonotic diseases, tuberculosis, or other airborne pathogens) indicated that low educational level, non-Caucasian ethnicity, overcrowding (Mayoral et al., 2013), living in a neighborhood with high material or total deprivation (Lowcock et al.,2012), individualistic values (Morand and Walther, 2018), poor socio-environmental conditions (Issarow et al., 2018) are usually associated with increased hospitalization, point-source epidemics, or the number of disease outbreaks due to virus infections. Yet, none of these studies assessed the potential connection between social capital, perceived importance of personal freedom and virus spread dynamics within a time-frame of extreme restrictions.
Therefore the aim of this study was to explore the association between social characteristics and the doubling rate of registered COVID-19 cases, while controlling for the potential confounding factors of climate zones, population size and density, government effectiveness and stringency, testing rates, healthcare access and quality, preventative interventions, GDP per capita, and travel and tourism contribution to GDP.
Methods
The guiding principles for data selection and inclusion were (1) relevance (i.e. being a worldwide study with nationally repre- sentative samples assessing social markers or a global indicator that is based on a consequent algorithm), (2) recency (i.e. data collection date as close in time to the COVID-19 outbreak as possible), and finally (3) repeatability and reproducability (i.e.
studies that repeat sampling most favorably on an annual basis, increasing the reproducability of our proposed model). In some cases—e.g. the inclusion of 2010–2014 World Value Survey
(WVY) (Inglehart et al.,2014) data, the 2015 Healthcare Access and Quality index (GBD 2015 Healthcare Access and Quality Collaborators,2017) or travel and tourism direct contribution to GDP in 2018 (World Travel & Tourism Council, 2019)—we decided that the relevance of the dataset overrides its potential deficit in recency or annual repetition.
Outcome measure: Incidence data and doubling times. Con- sidering COVID-19 incidence and doubling time, data was col- lected for a 71-day period running from 23 January 2020 to 27 March 2020 to encompass the initial phases of the outbreak.
Corresponding incidence data was obtained from the database (https://github.com/CSSEGISandData/COVID-19accessed on 28 March) of the Coronavirus COVID-19 Global Cases by the Center for Systems Science and Engineering (CSSE) at Johns Hopkins University (JHU) homepage, which is being updated daily based on WHO, CDC, ECDC, NHC, and DXY and local media reports (Dong et al.,2020). Doubling times were calculated from log-linear models of incidence. In China and South Korea, we included data only from the early increasing phase.
Covariates. Survey data reflecting social norms and cultural values were retrieved from the Legatum Institute’s 2019 Pros- perity Index (2020) measures (providing indicators of prosperity in 167 countries) and the WVS 6th wave dataset (Inglehart et al., 2014) (WVS studies the impact of changing values on social and political life of distinct societies: in wave 6 altogether 60 countries and more than 85,000 respondents participated). Since both the Prosperity Index (almost 300 country-level indicators) and the WVS dataset (almost 260 variables) contains a large number of items, we reduced the number of selected variables by focusing only on the following issues: (1) government effectiveness and the relationship between government and people (including trust and compliance or obedience); (2) the individual’s relationship with others (including social utility, proper behavior, and social capi- tal); and (3) the importance of personal freedom (including e.g.
agency or freedom of assembly and association). Table 1sum- marizes all covariates entered in our model, including data sources and variable descriptions. Due to high rates of missing values, Government Stringency Index (Hale et al.,2020), COVID- 19 tests per million people (Our World in Data,2020), and WVS data were only utilized for descriptive purposes.
Analytical methods. Model-based clustering was performed on the scaled data excluding missing variables (altogether for 87 countries). Variables with high number of missing values (namely tests performed per million, WVS items and Government Strin- gency Index) were omitted from the clustering such as the only categorical variable, the climate zone (Kottek et al.,2006; Rubel et al.,2017). We used the mclust package (Scrucca et al.,2016) to select the optimal model based on BIC for EM algorithm initi- alized by hierarchical clustering for parameterized Gaussian mixture models.
As a second step, we performed random forest regression analysis using the RandomForestSRC package with weighted mean- squared error as splitting rule (Ishwaran and Kogalur,2020) using the same observations. Continous variables were log transformed.
Nodesize and the number of variables randomly selected as candidates for splitting a node were selected to achieve the lowest out of bag error. The forest consisted of 100 trees. We applied swor (sampling without replacement) resampling to grow the trees and all variables were included. Minimal depth and permutation variable importance measures (VIMPs) were calculated (Ehrlinger, 2016; Ishwaran,2007). All calculations were performed with R 3.6.1
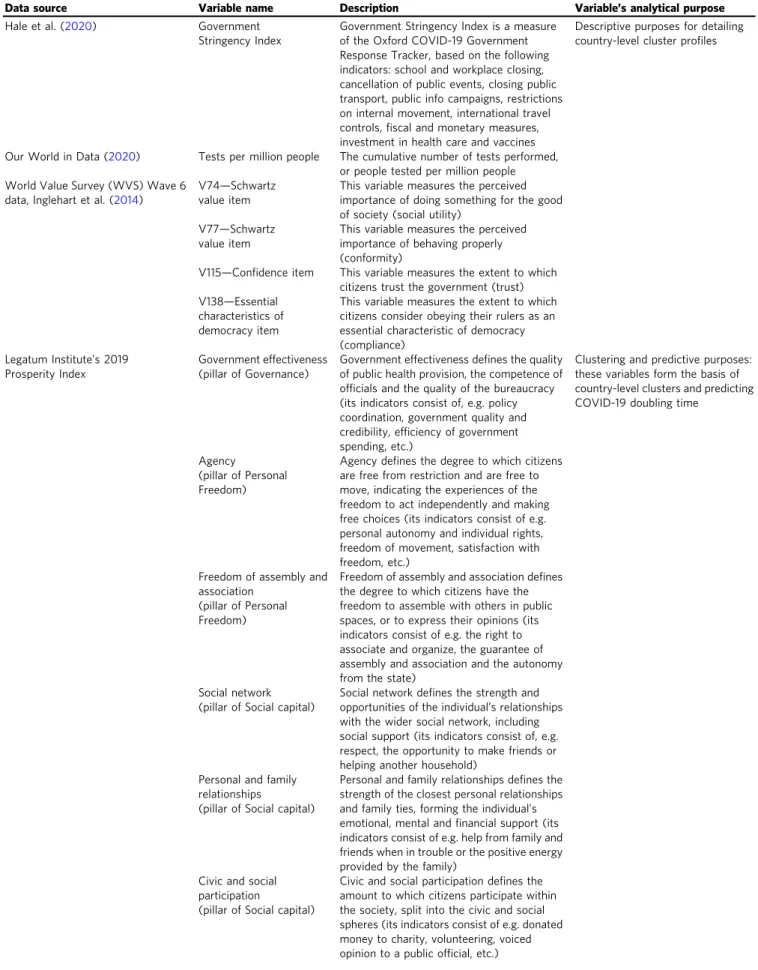
Table 1 Data sources, variable descriptions and variable’s purpose in the analytical process.
Data source Variable name Description Variable’s analytical purpose
Hale et al. (2020) Government
Stringency Index
Government Stringency Index is a measure of the Oxford COVID-19 Government Response Tracker, based on the following indicators: school and workplace closing, cancellation of public events, closing public transport, public info campaigns, restrictions on internal movement, international travel controls,fiscal and monetary measures, investment in health care and vaccines
Descriptive purposes for detailing country-level cluster profiles
Our World in Data (2020) Tests per million people The cumulative number of tests performed, or people tested per million people World Value Survey (WVS) Wave 6
data, Inglehart et al. (2014)
V74—Schwartz value item
This variable measures the perceived importance of doing something for the good of society (social utility)
V77—Schwartz value item
This variable measures the perceived importance of behaving properly (conformity)
V115—Confidence item This variable measures the extent to which citizens trust the government (trust) V138—Essential
characteristics of democracy item
This variable measures the extent to which citizens consider obeying their rulers as an essential characteristic of democracy (compliance)
Legatum Institute’s 2019 Prosperity Index
Government effectiveness (pillar of Governance)
Government effectiveness defines the quality of public health provision, the competence of officials and the quality of the bureaucracy (its indicators consist of, e.g. policy coordination, government quality and credibility, efficiency of government spending, etc.)
Clustering and predictive purposes:
these variables form the basis of country-level clusters and predicting COVID-19 doubling time
Agency
(pillar of Personal Freedom)
Agency defines the degree to which citizens are free from restriction and are free to move, indicating the experiences of the freedom to act independently and making free choices (its indicators consist of e.g.
personal autonomy and individual rights, freedom of movement, satisfaction with freedom, etc.)
Freedom of assembly and association
(pillar of Personal Freedom)
Freedom of assembly and association defines the degree to which citizens have the freedom to assemble with others in public spaces, or to express their opinions (its indicators consist of e.g. the right to associate and organize, the guarantee of assembly and association and the autonomy from the state)
Social network (pillar of Social capital)
Social network defines the strength and opportunities of the individual’s relationships with the wider social network, including social support (its indicators consist of, e.g.
respect, the opportunity to make friends or helping another household)
Personal and family relationships
(pillar of Social capital)
Personal and family relationships defines the strength of the closest personal relationships and family ties, forming the individual’s emotional, mental andfinancial support (its indicators consist of e.g. help from family and friends when in trouble or the positive energy provided by the family)
Civic and social participation
(pillar of Social capital)
Civic and social participation defines the amount to which citizens participate within the society, split into the civic and social spheres (its indicators consist of e.g. donated money to charity, volunteering, voiced opinion to a public official, etc.)
(R Core Team, 2019) with a custom script available as supplementary material together with detailed output.
Results
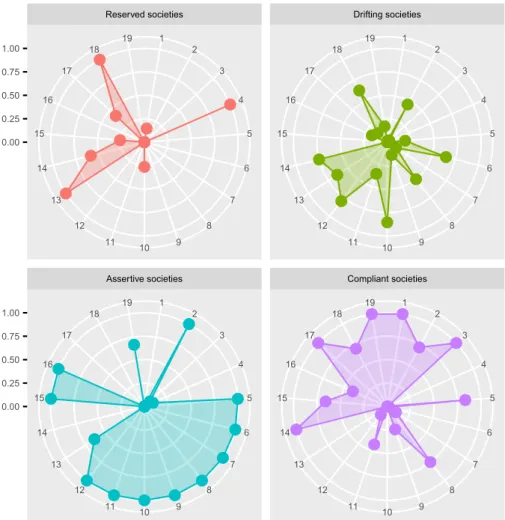
Clustering the observed countries. Clustering revealed four main clusters (Supplementary material presents each cluster with the list of corresponding countries):
● Cluster 1—Reserved societies: Cluster 1 consisted typically of high population countries with lower population densities, low government effectiveness, lower GDP per capita, and HAQ index and yet higher incidence doubling time. The tests performed per million inhabitants was relatively low, the government stringency index was higher than in Cluster 3,
but lower than in Clusters 2 and 4. There was a typical lower grade of agency, freedom of assembly and association, and family and personal relationships, as well as a typically dry, arid and semiarid climate. Countries of this cluster were for instance Iran, Pakistan, Egypt, Algeria, Kazakhstan, and Mexico. These societies seem to be characterized by social distancing and a relatively reduced need for personal autonomy, or the freedom of movement. Citizens of these societies showed less interest in doing something for the good of society, and found it less important to behave properly. On the other hand, they had higher confidence in their governments than the citizens of Clusters 2 and 3 countries, as well as they perceived obeying their rulers as an important feature of democracy.
Table 1 (continued)
Data source Variable name Description Variable’s analytical purpose
Preventative interventions (pillar of Health)
Preventative interventions defines the extent to which the health system prevents diseases and other medical complications from occurring (its indicators consist of, e.g. the existence of national screening programs, or diphteria, measles, hepatitis
immunization, etc.) Köppen-Geiger updated climate
zones by Kottek et al. (2006), using the downscaling algorithms of Rubel et al. (2017)
Class A—Tropical climates
Being the warmest of all, Class A climate zone includes geographic regions with tropical monsoon, rainforests, or savannas.
With constant high temperatures, year round averages are 18 °C (64.4 °F) or higher
Predictive purpose: this variable served as a covariate in predicting COVID-19 doubling time
Class B—Dry (Arid and Semiarid) climates
Class B climate zone includes regions with hot or cold deserts, or semiarid climates, characterized by evaporation and transpiration exceeding precipitation. The average annual temperature of low latitude climate is above 18 °C (64.4 °F), while in case of middle-latitude climate the average annual temperature is below 18 °C (64.4 °F) Class C—Temperate
(Mesothermal) climates
Class C climate zone includes regions with subtropical, mediterranean, and oceanic climates. In the spring/summer months, average monthly high temperature average of 10 °C (50 °F) or more is observed, while in the fall/winter months, average monthly low temperature is greater than−3 °C (27 °F) Class D—Continental
(Microthermal) climates
Class D climate zone includes regions with continental and subarctic climates. In the warmest months, average temperature above 10 °C (50 °F) is observed, while the coldest month average is below−3 °C (27 °F)
Global Burden of Disease (GBD) Study 2015 Healthcare Access and Quality Collaborators (2017)
Healthcare Access and Quality (HAQ) index 2015
HAQ index—a summary measure on a scale of 0–100—is based on national mortality rates from causes that should not be lethal in the presence of effective medical care
Clustering and predictive purposes:
these variable form the basis of country-level clusters and predicting COVID-19 doubling time
https://pkgstore.datahub.io/
(accessed 28 March 2020)
GDP per capita GDP is calculated as the sum of gross value added by the economy’s resident producers, product taxes, minus the subsidies that are not included in the products’value. GDP per capita is gross domestic product divided by midyear population
World Travel & Tourism Council 2019
Travel and tourism direct contribution to GDP in 2018
This index indicates the extent to which the travel and tourism industry directly contributed to gross domestic profit The GeoNames geographical
database:http://download.
geonames.org/(accessed 28 March 2020)
Population and population density
National indicators of population size and population per unit area
● Cluster 2—Drifting societies: Countries from Cluster 2 (e.g.
Czechia, Greece, Italy, Hungary, Slovenia, Slovakia, Peru, Estonia, Poland) had typically temperate climate, low population and population density, higher government effectiveness, moderate freedom of assembly and association, moderate agency as well as family and personal relationships, lower civic and social participation, lower GDP, and HAQ index. The tests performed per million inhabitants were lower than in Clusters 3 and 4 but higher than in Cluster 1. The government stringency index was high. In this group, the doubling time was lower. These societies are marked byfirm leadership, a tendency to refuse social responsibilities, and a preference of close relationships over expansive networking.
Citizens of these countries did notfind it really important to do something for the good of society, or to behave properly, while they showed decreased confidence in their government and reported decreased importance of obeying their rulers (the latter two WVS variables showed lower scores than in case of Clusters 1 and 4 countries).
● Cluster 3—Assertive societies: Cluster 3 countries, like Australia, USA, UK, Germany, Sweden, Spain, Switzerland, and France with temperate climate, higher governmental effectiveness, stronger social networks, more significant personal and family relations, freedom of assembly and association, and higher GDP per capita, high HAQ index, and lowest doubling times. The tests performed per million inhabitants was high, the government stringency index was the lowest of all clusters. These societies are characterized by a strong need for personal autonomy and independence, social participation, and expansive networking. It is important for these individuals to do something for the good of society, and also to behave properly (these WVS variables showed the highest median scores in this cluster). On the other hand, citizens of Cluster 3 countries reported lower confidence in their governments, and they did notfind obeying their rulers an important feature of democracy.
● Cluster 4—Compliant societies: Countries of Cluster 4 had typically dry climate, high population density, lower scores on social networks, personal and family relationships, and lower freedom of assembly and association. The HAQ score and GDP per capita was higher here, but not as high as in Cluster 3. The tests performed per million inhabitants was the highest among all clusters, such as the government stringency index.
Countries from this cluster were for instance South Korea, China, United Arab Emirates, Israel, India, and Singapore.
This group was associated with the highest doubling time (followed by Cluster 1). These societies might not propagate the importance of personal autonomy, the freedom to act or assemble. It is more important for these citizens to do something for the good of society and also to behave properly than in case of Clusters 1 and 2 countries. Cluster 4 countries showed the highest confidence in their government, and the second highest median scores of the perceived importance of obeying their rulers. Increased doubling time within these countries in spite of high population densities may also indicates regulatory compliance. The basic difference between Clusters 4 and 1 societies is that inhabitants of Cluster 4 countries show greater conformity not only towards their governments but towards other individuals as well (Fig.1and Table2)
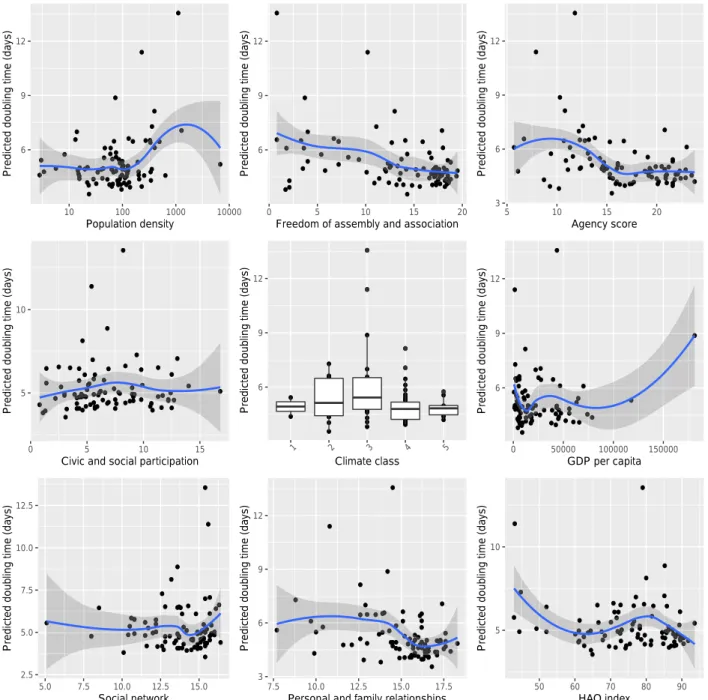
Predictors of doubling time. Random forest had an error rate of 0.25. Based on VIMP and minimal depth (MD) the most important predictors of doubling time were population density (MD: 2.07, VIMP: 0.0318), and freedom of assembly and
association (MD: 2.61, VIMP: 0.0146), followed by agency score (MD: 2.68, VIMP: 0.034). Climate class showed a high VIMP (0.03), however the highest MD also (3.73). Most covariates showed a complex nonlinear relationship with the predicted doubling time (Fig. 2). An overall positive association was detected with population density, GDP per capita, and climate class 3 (temperate climate), an overall negative association with freedom of assembly and association, and with agency score.
Discussion
Our results indicate that influencing the general public attitudes and response to COVID-19 (or other pandemics) should be a public health priority. Among the most relevant covariates, accustomed freedom of assembly and association and agency were found to be associated with increased COVID-19 trans- mission speed (these variables were more important predictors than GDP per capita, government effectiveness, preventative interventions, or the quality of and access to health care). In Clusters 2 and 3 countries (labeled as drifting and assertive societies), freedom to act, to assemble, to move is a more com- monly experienced or propagated human right than in Clusters 1 and 4 countries (labeled as reserved and compliant societies), therefore we might assume that people from these societiesfind it more demanding to accommodate strict governmental regula- tions, as well as the governments show lower stringency towards the citizens. Maintaining the need for human rights is an essential challenge during the pandemic, even if Clusters 2 and 3 societies show an elevated risk for accelerated transmission. Experiencing freedom of choice and freedom of act are basic democratic rights, yet they are as fragile as important in times of crisis, as indivi- duals are often prone to trade freedom for security and also to modify their preferences in order to adapt to undesirable cir- cumstances (Faden and Shebaya,2010), especially in the context of serious public health threats. It is thus each government’s responsibility not to take advantage of the current situation or exploit the population’s fear and anxiety as a foundation of increased governmental power. The current pandemic raises several questions concerning the balance between effectively combating the spread of coronavirus and protecting fundamental human rights. Amnesty International has just recently published (2020) recommendations for European states, urging them to select responses to COVID-19 that are in line with human right obligations. These recommendations—amongst other things—
include the right to privacy (i.e. increased digital surveillance is only acceptable in exceptional circumstances and in case the measures are legitimate, necessary, proportionate, and non-dis- criminatory); or pointing out that government responses limiting human rights (e.g. restricting freedom of movement and assem- bly, right to work, right to private and family life) must be led by legitimate public health goals that are based on scientific evidence.
Another important social factor is related to the public’s interpretation of the pandemic risk (e.g.“I am”at risk vs.“We are”at risk). As it was already mentioned before, individualistic values are often associated with an increase in the outbreaks of infectious diseases (Morand and Walther, 2018), assuming that individualistic cultures as opposed to collectivistic ones are more vulnerable to accelerated virus transmission, as citizens of col- lectivistic societies may better protect in-group members against pathogen transmission. This is in line with the pathogen pre- valence theory of Fincher et al. (2008), namely that collectivistic cultures are usually situated in the hotter regions of the world, where pathogens causing more severe medical conditions are more likely to occur, therefore collectivistic attitudes serve as a means of survival (such as the protection of in-group and the exclusion of out-group members). In terms of the current
research, former notions (i.e. connection between hotter climates and collectivistic cultures) can mainly be interpreted within Cluster 4 (and not Cluster 1) societies, with higher population densities. Several Cluster 4 countries (e.g. China, India, Japan, Singapore, or South Korea) are traditionally considered to be rather collectivistic than individualistic. Nonetheless, one should also keep in mind that the most cited operationalization effort regarding the valid measurement of collectivism–individualism (by Hofstede) dates back to the 1960s (Hofstede, 1980) and is based on non-probability samples. We therefore preferred to use social data derived from the Legatum Institute’s 2019 Prosperity Index or the WVS study instead of, e.g. Hofstede’s dimensions.
However, since the 6th wave of WVS collected data between 2010 and 2014, it would be worth reanalyzing our data when the WVS wave 7 dataset becomes available (July 2020).
These initialfindings may serve as a departing point for further research looking deeper into the social determinants of a pan- demic course and severity, and applying interdisciplinary models (e.g. a joint endeavor across health sciences, public health, and social sciences) in order to better understand the social con- struction of increased transmission rates for highly infectious diseases. The fact that personal right to assemble or associate with others and agency were stronger predictors of reduced doubling time than HAQ index, GDP per capita, or government effec- tiveness once again indicates the importance of the population
attitude and reaction to pandemic crisis. From a public health perspective it is of heightened relevance to explore both the ethical and psychological side of the freedom vs. security dilemma. Within the ethical framework proposed by Faden and Shebaya (2010), public health policies and regulations potentially restricting basic human rights (such as in case of severe infectious disease outbreaks) may be justified on the grounds of highlighting the overall social benefit of mitigation, promoting collective actions, ensuring fairness in the distribution of regulation bur- dens, or interfering with the liberty of an individual but only for the purpose of preventing harm to others (the harm principle). In times of any global crisis (such as the current COVID-19 pan- demic) increased paternalism (i.e. authorities take actions to protect the health and welfare of people against their will) might also be observed. However, paternalism can be“soft”(e.g. citizens suffer from immaturity, ignorance, or the holding of false beliefs) and “libertarian” (e.g. influencing citizens’ choice through per- suasion and not by using of force or compulsion) as well, and there can be considerable cross-cultural differences in the popu- lation’s tolerance for a certain level of paternalism, i.e. in coun- tries where shared-decision making or egalitarian approaches are adopted, strict paternalism may be more easily rejected, while in other regions of the world with different cultural standards, people might be more accepting towards a more paternalistic leadership (Abedini et al., 2015).
1 2
3 4
5
6
7 8 10 9
11 12 13 14 15
16 17
18 19
1 2
3 4
5
6
7 8 10 9
11 12 13 14 15
16 17
18 19
1 2
3 4
5
6
7 8 10 9
11 12 13 14 15
16 17
18 19
1 2
3 4
5
6
7 8 10 9
11 12 13 14 15
16 17
18 19
Assertive societies Compliant societies
Reserved societies Drifting societies
0.00 0.25 0.50 0.75 1.00
0.00 0.25 0.50 0.75 1.00
Fig. 1 Radial chart presenting rescaled median values of the variables by each cluster.Note: Numbers represent variables as follows: 1=Doubling time, 2=HAQ index, 3=Population density, 4=Population size, 5=GDP per capita, 6=Agency, 7=Social networks, 8=Preventative interventions, 9= Civic and social participation, 10=Freedom of assembly and association, 11=Government effectiveness, 12=Personal and family relationships, 13= Travel and tourism direct contribution to GDP, 14=Government Stringency Index, 15=Doing something for the good of society, 16=Behaving properly, 17=Confidence in the government, 18=Obeying rulers, 19=Tests performed per million inhabitants.
Currently one of the most important question that still remains unanswered is whether or not libertarian paternalism (e.g. manifested in government communication and regulatory strategies) is efficient enough in terms of ensuring social dis- tancing. In any ways, reducing negative psychological impact of quarantine might be a good public health starting point in helping the citizens to bear the frustration of limited freedom and thus keeping them motivated to maintain the expected distancing. Based on the insights of a recent rapid review (Brooks et al., 2020), main negative effects of quarantine includes post-traumatic stress symptoms, confusion and anger, depending on e.g. the duration of quarantine, infection fears, boredom, adequate or inadequate information,financial loss or stigma. Thus, some of the best practices to minimize the pathogenic outcomes of drastic regulation efforts consists of providing clear rationale for quarantine, ensuring sufficient supplies, or reminding the public about the potential social benefits of such extraordinary experiences. Keeping the public informed is particularly important as one of the most common psychological strategy to reduce anxiety is finding meaning or purpose in the pandemic. Several pandemic narratives and
interpretations can be observed, many of which are rather conspiracy beliefs than evidence supported opinions, presuming covert political or economical interests behind the origin or the scale of the pandemic, and mostly supposing that SARS-CoV-2 is a purposefully manipulated laboratory construct. And even though these theories are often rebutted by scientific evidence (Andersen et al.,2020), conspiracy beliefs and misinformations are still on the rise (Mian and Khan, 2020).
Concluding remarks
With infectious diseases (such as tick-borne, mosquito-borne, vector-borne and foodborne illnesses) inducing an emerging and recurring public health threat, the importance of reliable fore- casting models is emphasized by both the authors of this paper and others (Lutz et al., 2019). While this study is certainly not without any limitations (i.e. the potential obsolescence of WVS and HAQ data; the unconfirmed replicability of cluster assign- ments; or the limited number of observations), on the basis of our findings we advocate the relevance of social factors in such models, and thus encourage the scientific community to explore Table 2 Clustering countries with registered COVID-19 cases.
Cluster 1 Cluster 2 Cluster 3 Cluster 4
Governmental data Government effectiveness −−
8.80 [7.80, 9.70] +
12.30 [10.80, 14.25] ++
18.60 [17.90, 18.80] +
13.00 [11.25, 15.15]
Government stringency index +
83.5 [79.75, 86] ++
88 [76.25, 95] −
67 [57, 71] ++
95 [71.5, 97.5]
Tests performed per million
inhabitants −−
68.35 [10.03, 247.28] −
404.6 [312.5, 1136.3] +
1381 [543, 1980] ++
2033 [313.1, 5363.2]
Climate data Most dominant climate zone n(%)
Dry (Arid and Semiarid) 13/29 (44.8%)
Temperate (Mesothermal) 16/26 (61.5%)
Temperate (Mesothermal) 14/21 (66.7%)
Dry (Arid and Semiarid) 5/11 (45.5%)
Social data Population size +
33,848,242 [12,323,252, 80,471,869]
−
7,172,443 [3,427,257, 16,257,520]
−
9,828,655 [5,009,150, 33,679,000]
−
7,353,985 [3,745,101, 87,855,322]
Population density −
75.23 [46.68, 99.67] −
83.25 [42.37, 110.58] +
97.84 [15.83, 205.48] ++
354.07 [147.55, 564.00]
Agency −−
12.40 [10.80, 14.30] +
18.35 [16.35, 19.45] ++
21.60 [21.00, 22.40] −−
12.60 [11.00, 16.40]
Social networks −
13.60 [12.00, 15.10] −
13.80 [12.72, 15.10] ++
15.40 [14.50, 15.70] −
13.80 [11.70, 15.00]
Personal and family
relationships −−
13.90 [12.60, 15.40] +
16.05 [15.27, 16.50] ++
16.60 [16.20, 17.10] −
14.20 [12.70, 14.90]
Civic and social participation −
4.70 [3.00, 6.50] −
5.65 [4.35, 6.88] ++
11.30 [9.00, 12.40] −
6.40 [4.95, 7.55]
Freedom of assembly and
association −−
10.10 [4.00, 13.00] +
16.60 [13.67, 17.30] ++
18.20 [17.90, 18.50] −−
7.20 [3.65, 15.05]
Importance of doing something
for the good of society
−
2.4 [2.16, 2.57] −
2.22 [2.15–2.59] ++
2.91 [2.78–3.01] +
2.67 [2.39–2.9]
Importance of behaving
properly −
2.43 [2.32, 2.6] +
2.56 [2.32–2.71] ++
3.16 [2.87–3.31] +
2.72 [2.42–2.93]
Confidence in the government +
11.7 [7.6, 19.15] −
7.1 [3.9–11.2] −−
4.7 [2.78–5.58] +++
21.6 [5.7–32.9]
Obeying rulers as an essential characteristic of democracy +
6.64 [5.78, 6.99] −
5.9 [5.26–6.22] −−
4.66 [3.78–5] +
6.05 [5.12–6.68]
Economic and healthcare data
Healthcare Access and
Quality (HAQ) index −−
66.30 [61.00, 72.70] −
76.30 [71.55, 80.95] ++
88.20 [86.20, 89.60] +
82.00 [75.90, 85.65]
GDP per capita −−
4598.63
[3562.10, 8949.04]
−12,660.98
[7366.39, 16,387.37]
++45,481.10
[42,469.36, 55,987.65]
+39,752.72 [25,090.62, 53,387.39]
Travel and tourism direct contribution to GDP +
0.04 [0.03, 0.06] +
0.04 [0.03, 0.06] +
0.04 [0.02, 0.05] −
0.03 [0.03, 0.04]
Preventative interventions −
12.40 [11.00, 13.10] −
13.00 [12.33, 13.20] +
13.60 [13.50, 13.80] +
13.30 [12.95, 13.85]
COVID-19 data Doubling time in days +
5.18 [3.62, 7.82] −
4.30 [3.54, 4.91] −
4.22 [3.27, 5.15] ++
10.12 [5.84, 12.27]
Note:−and+represents negative or positive variation from median values, within one (−/+), two (−−/++), or three (+++) inter-quartile ranges. Median represented as+/−. Numerical values are represented in the median [IQR] format.
the sociology of current and future pandemics, or to examine the validity of our cluster typology in terms of the initial epidemic curves of other infectious diseases.
Data availability
Analyzed datasets are all freely available in the Dataverse repo- sitory:https://doi.org/10.7910/DVN/PRKEVU, the custom script and the detailed output is available as supplementary material.
Researchers are encouraged to reanalyze the datasets to examine the reproducibility and the validity of our proposed cluster model in case of the initial epidemics of further infectious diseases as well.
Received: 11 May 2020; Accepted: 25 August 2020;
References
Abedini NC, Danso-Bamfo S, Kolars JC et al. (2015) Cross-cultural perspectives on the patient-provider relationship: a qualitative study exploring reflections from Ghanaian medical students following a clinical rotation in the United States. BMC Med Educ 15:161.https://doi.org/10.1186/s12909-015-0444-9 Amnesty International (2020) Europe at a crossroads: DOs and DON’Ts for
authorities when responding to the COVID-19 pandemic. https://www.
amnesty.org/download/Documents/EUR0120792020ENGLISH.PDF. Acces- sed 6 Apr 2020
Anderson RM, Heesterbeek H, Klinkenberg D, Hollingsworth TD (2020) How will country-based mitigation measures influence the course of the COVID-19 epidemic? Lancet 395:931–934. https://doi.org/10.1016/S0140-6736(20) 30567-5
Andersen KG, Rambaut A, Lipkin WI et al. (2020) The proximal origin of SARS- CoV-2. Nat Med.https://doi.org/10.1038/s41591-020-0820-9
Brooks SK, Webster RK, Smith LE et al. (2020) The psychological impact of quarantine and how to reduce it: rapid review of the evidence. Lancet 395:912–920.https://doi.org/10.1016/S0140-6736(20)30460-8
Fig. 2 Variable dependence plot of different covariates.Each predicted point is an individual observation, dependent on the full combination of all covariates (Ehrlinger,2016).
Dong E, Du H, Gardner L (2020) An interactive web-based dashboard to track COVID-19 in real time. Lancet Infect Dis. https://doi.org/10.1016/S1473- 3099(20)30120-1
Ehrlinger J (2016) ggRandomForests: visually exploring random forests. 2016, R package version 2.0.1.https://CRAN.R-project.org/package=ggRandomForests Accessed 28 Mar 2020
Faden R, Shebaya S (2010) Public health ethics. Stanford Encyclopedia of Philo- sophy. 2010.https://plato.stanford.edu/entries/publichealth-ethics/. Accessed 6 Apr 2020
Fang Y, Nie Y, Penny M (2020) Transmission dynamics of the COVID-19 outbreak and effectiveness of government interventions: a data-driven analysis. J Med Virol.https://doi.org/10.1002/jmv.25750
Fincher CL, Thornhill R, Murray DR, Schaller M (2008) Pathogen prevalence predicts human cross-cultural variability in individualism/collectivism. Proc Biol Sci 275:1279–1285.https://doi.org/10.1098/rspb.2008.0094
GBD 2015 Healthcare Access and Quality Collaborators (2017) Healthcare Access and Quality Index based on mortality from causes amenable to personal health care in 195 countries and territories, 1990–2015: a novel analysis from the Global Burden of Disease Study 2015. Lancet 390:231–266.https://doi.
org/10.1016/S0140-6736(17)30818-8
Hale T, Petherick A, Phillips T, Webster S (2020) Variation in government responses to COVID-19—BSG-WP-2020/031. https://www.bsg.ox.ac.uk/
sites/default/files/2020-03/BSG-WP-2020-031-v3.0.pdf. Accessed 28 Mar 2020
Hofstede G (1980) Culture’s consequences: International differences in work- related values. Sage, Beverly Hills
Inglehart RC, Haerpfer A, Moreno C. et al. (eds) (2014) World values survey:
round six—country-pooled datafile version. JD Systems Institute, Madrid Ishwaran H (2007) Variable importance in binary regression trees and forests.
Electron J Stat 1:519–537.https://doi.org/10.1214/07-EJS039
Ishwaran H, Kogalur U (2020) Fast unified random forests for survival, regression, and classification (RF-SRC). R package version 2.9.3.https://cran.r-project.
org/package=randomForestSRC. Accessed 28 Mar 2020
Issarow CM, Mulder N, Wood R (2018) Environmental and social factors impacting on epidemic and endemic tuberculosis: a modelling analysis. R Soc Open Sci 5:170726.https://doi.org/10.1098/rsos.170726
Kottek M, Grieser J, Beck C, Rudolf B, Rubel F (2006) World Map of the Köppen–Geiger climate classification updated. Meteorol Z 15:259–263.
https://doi.org/10.1127/0941-2948/2006/0130
Kucharski AJ, Russell TW, Diamond C et al. (2020) Early dynamics of transmission and control of COVID-19: a mathematical modelling study. Lancet Infect Dis.https://doi.org/10.1016/S1473-3099(20)30144-4
Legatum Institute (2020) The Legatum Prosperity Index 2019—a tool for trans- formation. https://www.prosperity.com/download_file/view_inline/3690 Accessed 20 Mar 2020
Lowcock EC, Rosella LC, Foisy J, McGeer A, Crowcroft N (2012) The social determinants of health and pandemic H1N1 2009 influenza severity. Am J Public Health 102:e51–e58.https://doi.org/10.2105/AJPH.2012.300814 Lutz CS, Huynh MP, Schroeder M et al. (2019) Applying infectious disease fore-
casting to public health: a path forward using influenza forecasting examples.
BMC Public Health 19:1659.https://doi.org/10.1186/s12889-019-7966-8 Mayoral JM, Alonso J, Garín O et al. (2013) Social factors related to the clinical
severity of influenza cases in Spain during the A (H1N1) 2009 virus pan- demic. BMC Public Health 13:118.https://doi.org/10.1186/1471-2458-13-118
Mian A, Khan S (2020) Coronavirus: the spread of misinformation. BMC Med 18:89.https://doi.org/10.1186/s12916-020-01556-3
Morand S, Walther BA (2018) Individualistic values are related to an increase in the outbreaks of infectious diseases and zoonotic diseases. Sci Rep 8:3866.
https://doi.org/10.1038/s41598-018-22014-4
Our World in Data (2020) Tests per million people.https://ourworldindata.org/
covid-testing. Accessed 28 Mar 2020
R Core Team (2019) R. A language and environment for statistical computing. R Foundation for Statistical Computing, Vienna
Rubel F, Brugger K, Haslinger K, Auer I (2017) The climate of the European Alps:
shift of very high resolution Köppen–Geiger climate zones 1800–2100.
Meteorol Z 26:115–125.https://doi.org/10.1127/metz/2016/0816
Scrucca L, Fop M, Murphy T, Raftery AE (2016) mclust 5: clustering, classification and density estimation using Gaussianfinite mixture models. R J 8:205–233 World Travel & Tourism Council (2019) Travel and tourism direct contribution to
GDP in 2018.https://tool.wttc.org/. Accessed 28 Mar 2020
Acknowledgements
Máté Kapitány-Fövény acknowledges the support by the János Bolyai Research Scho- larship of the Hungarian Academy of Sciences and the support by the ÚNKP-19 New National Excellence Program of the Hungarian Ministry for Innovation and Technology.
Competing interests
The authors declare no competing interests.
Additional information
Supplementary informationis available for this paper athttps://doi.org/10.1057/s41599- 020-00590-z.
Correspondenceand requests for materials should be addressed to M.K.-F.
Reprints and permission informationis available athttp://www.nature.com/reprints Publisher’s noteSpringer Nature remains neutral with regard to jurisdictional claims in published maps and institutional affiliations.
Open Access This article is licensed under a Creative Commons Attribution 4.0 International License, which permits use, sharing, adaptation, distribution and reproduction in any medium or format, as long as you give appropriate credit to the original author(s) and the source, provide a link to the Creative Commons license, and indicate if changes were made. The images or other third party material in this article are included in the article’s Creative Commons license, unless indicated otherwise in a credit line to the material. If material is not included in the article’s Creative Commons license and your intended use is not permitted by statutory regulation or exceeds the permitted use, you will need to obtain permission directly from the copyright holder. To view a copy of this license, visithttp://creativecommons.org/
licenses/by/4.0/.
© The Author(s) 2020