SYSTEMATIC REVIEW published: 19 November 2019 doi: 10.3389/fphys.2019.01408
Frontiers in Physiology | www.frontiersin.org 1 November 2019 | Volume 10 | Article 1408
Edited by:
Stephen J. Pandol, Cedars-Sinai Medical Center, United States Reviewed by:
Gabriel Samasca, Iuliu Ha¸tieganu University of Medicine and Pharmacy, Romania Giuseppe Losurdo, University of Bari Medical School, Italy
*Correspondence:
Péter Hegyi hegyi2009@gmail.com
†These authors have contributed equally to this work
Specialty section:
This article was submitted to Gastrointestinal Sciences, a section of the journal Frontiers in Physiology Received:19 April 2019 Accepted:31 October 2019 Published:19 November 2019 Citation:
Szakács Z, Gede N, Gyöngyi Z, Solymár M, Csupor D, Er ˝oss B, Vincze Á, Mikó A, Vasas A, Szapáry L, Dobszai D, Balikó V, Hágendorn R, Hegyi P and Bajor J (2019) A Call for Research on the Prognostic Role of Follow-Up Histology in Celiac Disease:
A Systematic Review.
Front. Physiol. 10:1408.
doi: 10.3389/fphys.2019.01408
A Call for Research on the Prognostic Role of Follow-Up Histology in Celiac Disease: A Systematic Review
Zsolt Szakács1,2, Noémi Gede1, Zoltán Gyöngyi3, Margit Solymár1, Dezs ˝o Csupor4, Bálint Er ˝oss1,2, Áron Vincze5, Alexandra Mikó1, Andrea Vasas3, László Szapáry1,6, Dalma Dobszai1, Viktória Balikó1, Roland Hágendorn5, Péter Hegyi1,2*†and Judit Bajor5†
1Institute for Translational Medicine, Medical School, University of Pécs, Pécs, Hungary,2Szentágothai Research Centre, Medical School, University of Pécs, Pécs, Hungary,3Department of Public Health Medicine, Medical School, University of Pécs, Pécs, Hungary,4Department of Pharmacognosy, University of Szeged, Szeged, Hungary,5Division of
Gastroenterology, First Department of Medicine, Medical School, University of Pécs, Pécs, Hungary,6Department of Interventional Cardiology, Heart Institute, University of Pécs, Pécs, Hungary
Background:Convincing evidence is lacking on the benefit of follow-up biopsy in celiac disease. Regardless, achieving mucosal recovery (MR) has remained a desirable goal of therapy. We aimed to conduct a systematic review to determine whether MR is a protective factor and persisting villous atrophy (PVA) has negative consequences on long-term outcomes of celiac disease.
Methods: Seven databases were searched for articles discussing celiac patients subjected to a gluten-free diet who had a follow-up biopsy, and clinical and laboratory characteristics were reported by follow-up histology (MR vs. PVA). Outcomes included clinical symptoms, mortality, malignant tumors, nutritional parameters, and metabolic bone disease. Comparative and descriptive studies were included. Since data proved to be ineligible for meta-analysis, the evidence was synthesized in a systematic review.
Results: Altogether, 31 studies were eligible for systematic review. Persisting symptoms were more frequently associated with PVA than with MR, although a lot of symptom-free patients had PVA and a lot of symptomatic patients achieved MR. PVA might be a risk factor of lymphomas, but mortality and the overall rate of malignant tumors seemed independent of follow-up histology. Patients with PVA tended to develop metabolic bone disease more often, although fracture risk remained similar in the groups except in hip fractures of which PVA was a risk factor. Reports on nutritional markers are only anecdotal.
Conclusions: The limited evidence calls for high-quality prospective cohort studies to be arranged to clarify the exact role of follow-up histology in celiac disease.
Keywords: celiac disease, mucosal recovery, persistent villous atrophy, follow-up biopsies, gluten-free diet
Szakács et al. Follow-Up Histology in Celiac Disease
INTRODUCTION
Celiac disease (CeD) is a systemic disorder with an increasing worldwide prevalence of∼1% (Di Sabatino and Corazza, 2009;
Catassi et al., 2014). In CeD, the immune-mediated destruction of small intestinal villous architecture is triggered by dietary gluten (Reilly et al., 2017).
Rationale of the Study
Although the value of intestinal biopsy at diagnosis is beyond dispute (Bai et al., 2013; Rubio-Tapia et al., 2013; Ludvigsson et al., 2014), the role of follow-up biopsy is a matter of controversy (Pekki et al., 2017). While the restitution of intestinal villi is expected on a strict gluten-free diet, the mucosa fails to restore entirely in a considerable fraction of patients (Szakacs et al., 2017). Recent guidelines recommend a follow- up biopsy if signs and symptoms persist or relapse despite strict adherence to a gluten-free diet (Bai et al., 2013; Rubio- Tapia et al., 2013; Ludvigsson et al., 2014). However, reports proposed that neither the resolution of symptoms (Bardella et al., 2007; Biagi et al., 2014; Fang et al., 2017; Mahadev et al., 2017) nor a strict dietary adherence (Szakacs et al., 2017) guarantees mucosal recovery (MR). One might expect that CeD patients with persistent villous atrophy (PVA) experience a less favorable disease course than those achieving MR (Haines et al., 2008), although convincing evidence is lacking. Yet, achieving MR has remained a desirable goal in CeD. The importance of the topic roots in the burden imposed by the endoscopic procedures and duodenal histological sampling as well as in the subsequent clinical decisions made upon follow- up histology.
Objective of the Study
With this systematic review, we aimed to be the first who systematically collect all available evidence on the impact of follow-up histology (MR vs.
PVA) on disease characteristics and clinical course of CeD.
Research Question
Are CeD patients who have not achieved MR exposed to adverse clinical outcomes more frequently than those patients who have achieved MR?
METHODS Study Design
This systematic review was reported in accordance with the Preferred Reporting Items for Systematic reviews and Meta- Analyses 2009 (Moher et al., 2009).
Abbreviations:SF-36, 36-Item Short Form Health Survey; CeD, celiac disease;
GSRS, Gastrointestinal Symptom Rating Scale; HR, hazard ratio; IBS, irritable bowel syndrome; MR, mucosal recovery; NS, non-significant; OR, odds ratio;
PGWB, Psychological General Well-Being Index; PVA, persistent villous atrophy.
Participants and Exposure
Participants of this systematic review include CeD patients subjected to a gluten-free diet. The exposure of interest is the follow-up duodenal histology assessed as either MR or PVA.
Systematic Review Protocol
The study protocol was registered a priori on PROSPERO under CRD42017069815.
Search Strategy
We performed a systematic literature search in MEDLINE (via PubMed), Embase, Cochrane Controlled Register of Trials (CENTRAL), Web of Science, Scopus, WHO Global Index Medicus, and ClinicalTrials.gov from inception up to 14th September 2019 for relevant articles. Free-text terms and Medical Subject Headings were combined into a query, as follows: celiac AND (“mucosal recovery” OR
“mucosal healing” OR “mucosal atrophy” OR “intestinal atrophy” OR “duodenal atrophy” OR “villous atrophy” OR
“persistent mucosal damage” OR “follow-up biopsy” OR “follow- up duodenal biopsy” OR “follow-up intestinal biopsy” OR
“follow-up small intestinal biopsy” OR “follow-up histology”
OR “repeated biopsy” OR “repeated histology” OR “control biopsy” OR “control histology”). No filters were imposed upon the search.
Relevant cited articles were explored by reviewing the reference lists of included papers. Citing articles were identified with Google Scholar.
Data Sources, Study Selection, and Data Extraction
Eligibility Criteria
Eligible papers discussed CeD patients subjected to a gluten-free diet with an available record of duodenal follow-up histology, and reported on disease and patients characteristics by follow- up histology. Analytical and descriptive full-text articles or conference abstracts but not case studies were included without language restriction to reduce publication bias.
In our previous meta-analysis, we experienced a substantial variance in the definition of MR across studies (Szakacs et al., 2017). In this systematic review, we defined MR as the resolution of villous atrophy at follow-up biopsy assessed as “non-atrophic”
histology based on crypt height:villous depth ratio, Marsh grades 0-2, Marsh-Oberhuber grades 0-2, or Corazza-Villanacci grade A; while PVA was defined as “atrophic” histology, Marsh grade 3, Marsh-Oberhuber grade 3, or Corazza-Villanacci grade B1- B2 (Marsh, 1992; Oberhuber et al., 1999; Corazza and Villanacci, 2005).
Disease and patients characteristics included signs and symptoms, vitamin and mineral levels, anemia, body mass index, metabolic bone disease, malignant tumors and other co-morbid conditions, and long-term mortality.
Selection and Data Collection
Records were combined in a reference manager software (EndNote X7.4, Clarivate Analytics, Philadelphia, PA, the USA) to remove duplicates and overlapping database content. Then,
Frontiers in Physiology | www.frontiersin.org 2 November 2019 | Volume 10 | Article 1408
Szakács et al. Follow-Up Histology in Celiac Disease
the standard three-step selection was performed by title, abstract and full-texts. Each step was carried out by two investigators in duplicate. Discrepancies were resolved by third-party arbitration.
K-statistics was used to measure the agreement between the investigators after each step.
Numeric and text data were extracted by two investigators onto a pre-defined Excel sheet, discrepancies were resolved by consensus. Although we contacted the authors of original studies for further raw data via email, we discarded these data from the systematic review when we realized that the material is ineligible for meta-analysis due to several reasons (as detailed later).
Design of the Studies Included and Quality Assessment
First, the design of the included papers was identified. Then, quality indicators were chosen based on the Quality in Prognostic Studies tool (Hayden et al., 2006), as follows:
• way of recruitment,
• diagnosis of CeD (only biopsy-verified cases or not),
• the recency of diagnosis (newly diagnosed patients or treated patients were included),
• representativeness of study population to the general CeD population (based on the inclusion and exclusion criteria of the individual studies),
• timing of follow-up biopsy (taken prospectively after enrolment or earlier),
• time elapsed between the diagnosis of CeD and the follow- up biopsy, and that between the follow-up biopsy and the measurement of outcomes,
• definition of PVA (histological classification),
• biopsy sampling site,
• timing of outcome assessment (prospectively after enrolment or earlier),
• definitions of outcomes (with cut-off values if applicable),
• blinding,
• adherence to a gluten-free diet (strict or not), and
• statistical considerations (the analysis directly compared the clinical characteristics by MR and PVA or not and the analysis was adjusted for reasonable confounding factors or not).
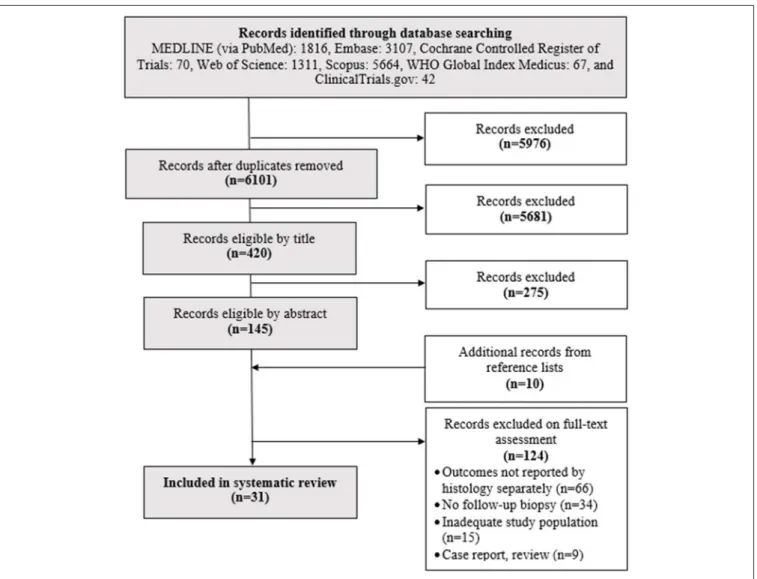
FIGURE 1 |Flowchart of the search and selection process.
Frontiers in Physiology | www.frontiersin.org 3 November 2019 | Volume 10 | Article 1408
Szakács et al. Follow-Up Histology in Celiac Disease
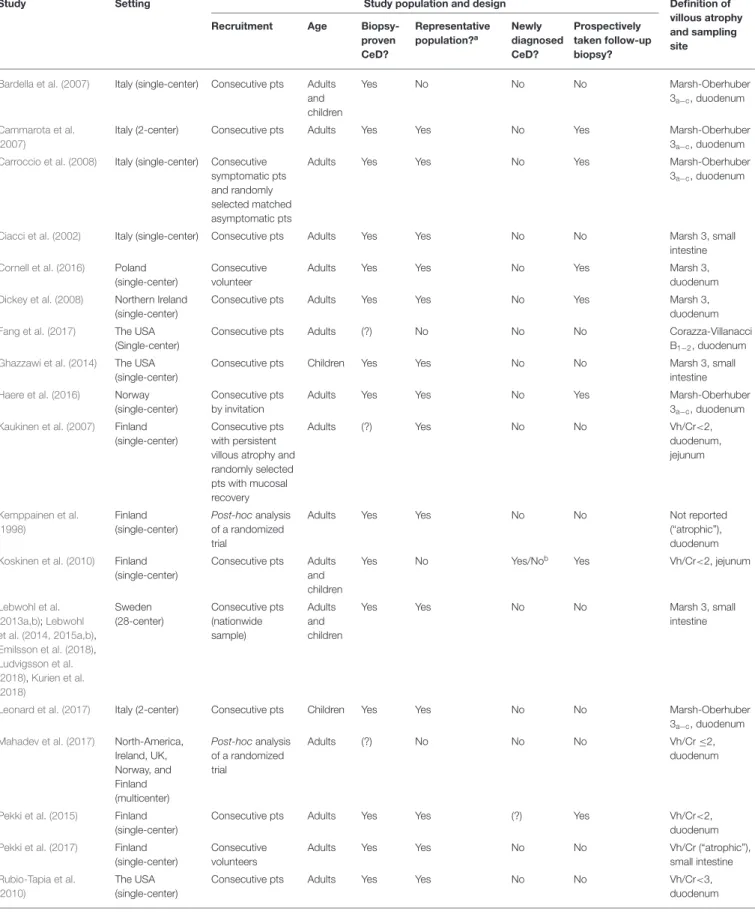
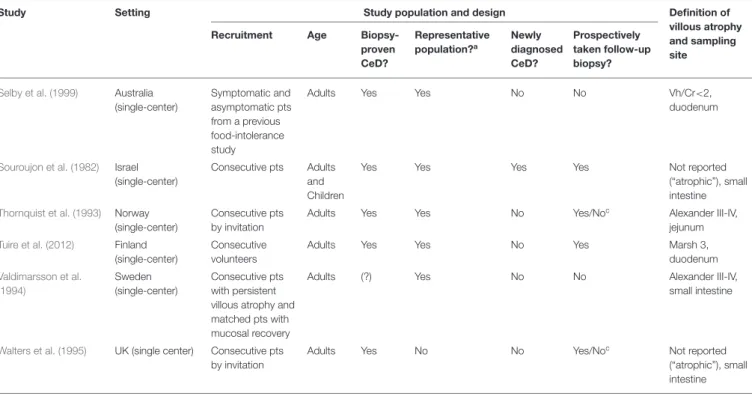
TABLE 1 |Characteristics of the studies included.
Study Setting Study population and design Definition of
villous atrophy and sampling site
Recruitment Age Biopsy-
proven CeD?
Representative population?a
Newly diagnosed CeD?
Prospectively taken follow-up biopsy?
Bardella et al. (2007) Italy (single-center) Consecutive pts Adults and children
Yes No No No Marsh-Oberhuber
3a−c, duodenum
Cammarota et al.
(2007)
Italy (2-center) Consecutive pts Adults Yes Yes No Yes Marsh-Oberhuber
3a−c, duodenum Carroccio et al. (2008) Italy (single-center) Consecutive
symptomatic pts and randomly selected matched asymptomatic pts
Adults Yes Yes No Yes Marsh-Oberhuber
3a−c, duodenum
Ciacci et al. (2002) Italy (single-center) Consecutive pts Adults Yes Yes No No Marsh 3, small
intestine
Cornell et al. (2016) Poland
(single-center)
Consecutive volunteer
Adults Yes Yes No Yes Marsh 3,
duodenum Dickey et al. (2008) Northern Ireland
(single-center)
Consecutive pts Adults Yes Yes No Yes Marsh 3,
duodenum
Fang et al. (2017) The USA
(Single-center)
Consecutive pts Adults (?) No No No Corazza-Villanacci
B1−2, duodenum
Ghazzawi et al. (2014) The USA
(single-center)
Consecutive pts Children Yes Yes No No Marsh 3, small
intestine
Haere et al. (2016) Norway
(single-center)
Consecutive pts by invitation
Adults Yes Yes No Yes Marsh-Oberhuber
3a−c, duodenum Kaukinen et al. (2007) Finland
(single-center)
Consecutive pts with persistent villous atrophy and randomly selected pts with mucosal recovery
Adults (?) Yes No No Vh/Cr<2,
duodenum, jejunum
Kemppainen et al.
(1998)
Finland (single-center)
Post-hocanalysis of a randomized trial
Adults Yes Yes No No Not reported
(“atrophic”), duodenum Koskinen et al. (2010) Finland
(single-center)
Consecutive pts Adults and children
Yes No Yes/Nob Yes Vh/Cr<2, jejunum
Lebwohl et al.
(2013a,b);Lebwohl et al. (2014, 2015a,b), Emilsson et al. (2018), Ludvigsson et al.
(2018),Kurien et al.
(2018)
Sweden (28-center)
Consecutive pts (nationwide sample)
Adults and children
Yes Yes No No Marsh 3, small
intestine
Leonard et al. (2017) Italy (2-center) Consecutive pts Children Yes Yes No No Marsh-Oberhuber
3a−c, duodenum Mahadev et al. (2017) North-America,
Ireland, UK, Norway, and Finland (multicenter)
Post-hocanalysis of a randomized trial
Adults (?) No No No Vh/Cr≤2,
duodenum
Pekki et al. (2015) Finland
(single-center)
Consecutive pts Adults Yes Yes (?) Yes Vh/Cr<2,
duodenum
Pekki et al. (2017) Finland
(single-center)
Consecutive volunteers
Adults Yes Yes No No Vh/Cr (“atrophic”),
small intestine Rubio-Tapia et al.
(2010)
The USA (single-center)
Consecutive pts Adults Yes Yes No No Vh/Cr<3,
duodenum
(Continued)
Frontiers in Physiology | www.frontiersin.org 4 November 2019 | Volume 10 | Article 1408
Szakács et al. Follow-Up Histology in Celiac Disease
TABLE 1 |Continued
Study Setting Study population and design Definition of
villous atrophy and sampling site
Recruitment Age Biopsy-
proven CeD?
Representative population?a
Newly diagnosed CeD?
Prospectively taken follow-up biopsy?
Selby et al. (1999) Australia
(single-center)
Symptomatic and asymptomatic pts from a previous food-intolerance study
Adults Yes Yes No No Vh/Cr<2,
duodenum
Souroujon et al. (1982) Israel (single-center)
Consecutive pts Adults and Children
Yes Yes Yes Yes Not reported
(“atrophic”), small intestine Thornquist et al. (1993) Norway
(single-center)
Consecutive pts by invitation
Adults Yes Yes No Yes/Noc Alexander III-IV,
jejunum
Tuire et al. (2012) Finland
(single-center)
Consecutive volunteers
Adults Yes Yes No Yes Marsh 3,
duodenum Valdimarsson et al.
(1994)
Sweden (single-center)
Consecutive pts with persistent villous atrophy and matched pts with mucosal recovery
Adults (?) Yes No No Alexander III-IV,
small intestine
Walters et al. (1995) UK (single center) Consecutive pts by invitation
Adults Yes No No Yes/Noc Not reported
(“atrophic”), small intestine
aStudy population is considered representative to the average CeD population if the study avoided inappropriate exclusions.
bThe study observed a group of newly diagnosed CeD patients for the short-term and a group of followed-up patients for the long-term.
cNot all patients were newly diagnosed.
(?) indicates uncertainty. CeD, celiac disease; pts, patients; Vh/Cr, villous height/crypt depth ratio.
RESULTS
Study Selection and Characteristics
After careful search and selection (Figure 1), 31 papers were included in the systematic review (Souroujon et al., 1982;
Thornquist et al., 1993; Valdimarsson et al., 1994; Walters et al., 1995; Kemppainen et al., 1998; Selby et al., 1999; Ciacci et al., 2002; Bardella et al., 2007; Cammarota et al., 2007;
Kaukinen et al., 2007; Carroccio et al., 2008; Dickey et al., 2008; Koskinen et al., 2010; Rubio-Tapia et al., 2010; Tuire et al., 2012; Lebwohl et al., 2013a,b, 2014, 2015a,b; Ghazzawi et al., 2014; Pekki et al., 2015, 2017; Cornell et al., 2016;
Haere et al., 2016; Fang et al., 2017; Leonard et al., 2017;
Mahadev et al., 2017; Emilsson et al., 2018; Kurien et al., 2018;
Ludvigsson et al., 2018) (Table 1). Cohen’sκrepresenting inter- reviewer agreement was 0.72 (substantial), 0.79 (substantial), and 0.92 (almost perfect) for selection by title, abstract, and full-text; respectively.
Out of the 31 papers, eight retrieved data on different outcomes from the Swedish CeD registry; therefore, study populations partially overlap (Lebwohl et al., 2013a,b, 2014, 2015a,b; Emilsson et al., 2018; Kurien et al., 2018; Ludvigsson et al., 2018).
Highlights of the Last Five Years
In this subchapter, we summarize the findings of the studies which investigated the prognostic role of follow-up histology
and were published after January 2015 (Lebwohl et al., 2013a, 2015a; Pekki et al., 2015, 2017; Haere et al., 2016; Fang et al., 2017; Mahadev et al., 2017; Emilsson et al., 2018; Kurien et al., 2018; Ludvigsson et al., 2018). Eight studies were conducted in Scandinavia, one in the USA, and there was another multicenter study from Europe and North-America. Evidence from univariate analysis suggested a borderline association of PVA with persisting symptoms (OR = 1.656 with CI: 0.949–
2.889;p=0.076 favoring mucosal recovery) (Fang et al., 2017), which was not confirmed by co-variate-adjusted analysis of the baseline cohort of patients of a multicenter randomized trial on symptomatic CeD patients (Mahadev et al., 2017). Conclusions from three Scandinavian studies on symptom and well-being scores corroborated these findings (Pekki et al., 2015, 2017;
Haere et al., 2016). PVA might be associated with lower lumbar T-score measured at 1 year after diagnosis, although neither the risk of osteoporosis at 5 years after diagnosis nor that of fractures at 2 years after diagnosis was higher in this group (Pekki et al., 2015, 2017). Decreased vitamin D and calcium levels might contribute to the impaired bone mineral density (Fang et al., 2017). Regarding other nutrients and minerals, zinc deficiency should be highlighted (39 vs. 14% in patients with PVA and MR, respectively; p = 0.0005). The effect of PVA did not manifest itself regarding erythropoiesis: three studies reported similar hemoglobin levels and rate of anemia in patients with PVA and MR (Pekki et al., 2015; Fang et al., 2017; Mahadev et al., 2017). Rate of malignant tumors and
Frontiers in Physiology | www.frontiersin.org 5 November 2019 | Volume 10 | Article 1408
Szakács et al. Follow-Up Histology in Celiac Disease
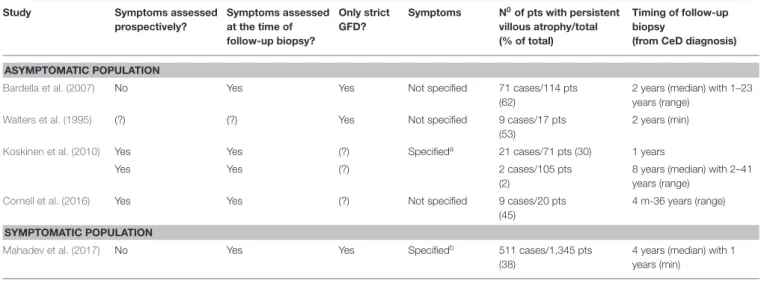
TABLE 2 |Persistent villous atrophy in studies including only symptomatic or asymptomatic celiac patients.
Study Symptoms assessed
prospectively?
Symptoms assessed at the time of follow-up biopsy?
Only strict GFD?
Symptoms N0of pts with persistent villous atrophy/total (% of total)
Timing of follow-up biopsy
(from CeD diagnosis)
ASYMPTOMATIC POPULATION
Bardella et al. (2007) No Yes Yes Not specified 71 cases/114 pts
(62)
2 years (median) with 1–23 years (range)
Walters et al. (1995) (?) (?) Yes Not specified 9 cases/17 pts
(53)
2 years (min)
Koskinen et al. (2010) Yes Yes (?) Specifieda 21 cases/71 pts (30) 1 years
Yes Yes (?) 2 cases/105 pts
(2)
8 years (median) with 2–41 years (range)
Cornell et al. (2016) Yes Yes (?) Not specified 9 cases/20 pts
(45)
4 m-36 years (range)
SYMPTOMATIC POPULATION
Mahadev et al. (2017) No Yes Yes Specifiedb 511 cases/1,345 pts
(38)
4 years (median) with 1 years (min)
aSymptoms included abdominal complaints, malabsorption, and extraintestinal symptoms.
bSymptoms include bloating, tiredness, abdominal pain, diarrhea, nausea, constipation, heartburn, and headache. (?) indicates uncertainty. CeD, celiac disease; GFD, gluten-free diet;
m, month; min, minimum; pts, patients.
that of lymphomas were not significantly different in histology groups in two studies 5 and 8 years after diagnosis (Pekki et al., 2015, 2017). Similar neutral associations were found on the rate of cardiovascular diseases (Lebwohl et al., 2015a; Mahadev et al., 2017), serious infections including sepsis, streptococcal, pneumococcal, influenza, herpes zoster, andClostridium difficile infections (Emilsson et al., 2018), and adverse pregnancy outcomes (Lebwohl et al., 2015b). MR seemed to be a protective factor against respiratory and dermatological diseases (Pekki et al., 2017). In contrast, anxiety and depression co-occurred more frequently with MR (Ludvigsson et al., 2018) as did epilepsy (Kurien et al., 2018). With respect to overall mortality, a higher rate was reported with PVA on 8-years follow-up (14 vs. 9%) but the difference was not statistically significant (p=0.259).
Narrative Review
In this subchapter, we summarize all available evidence published on the effect of MR and PVA on the outcomes of CeD.
Symptoms, Symptom Scores and Quality of Life In asymptomatic patients, PVA rates ranged from 2 to 62%
(Walters et al., 1995; Bardella et al., 2007; Koskinen et al., 2010;
Cornell et al., 2016). In symptomatic patients, PVA rate was 38%
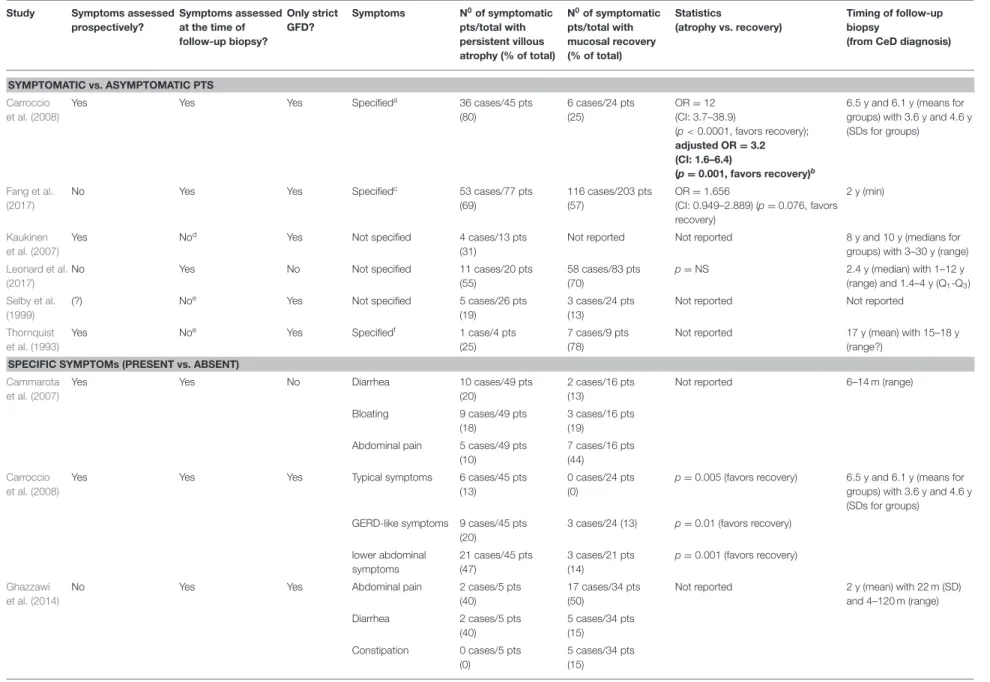
(Mahadev et al., 2017) (Table 2). Six studies reported symptoms as dichotomies (symptomatic vs. asymptomatic) (Thornquist et al., 1993; Selby et al., 1999; Kaukinen et al., 2007; Carroccio et al., 2008; Fang et al., 2017; Leonard et al., 2017). In univariate analysis, the percentage points of symptomatic patients with PVA and MR were 55 vs. 70% (p = NS) (Leonard et al., 2017), 69 vs. 57% (p = 0.076) (Fang et al., 2017), and 80 vs. 25% (p < 0.0001) (Carroccio et al., 2008), respectively (Table 3). Only one study adjusted for reasonable co-variates where the adjusted OR was 3.2, 95% CI: 1.6–6.4 (p = 0.001), indicating that patients with PVA tended to be symptomatic
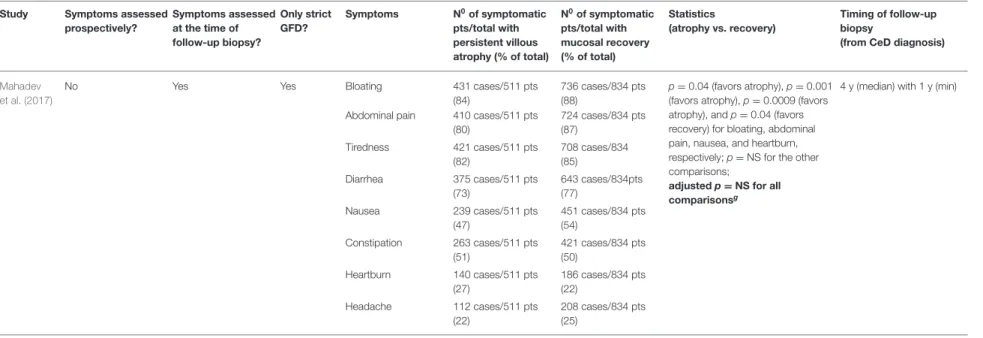
more often (Carroccio et al., 2008). Regarding the individual symptoms, only one study adjusted for co-variates where none of the symptoms in focus, that is, diarrhea, bloating, abdominal pain, nausea, tiredness, constipation, heartburn and headache, was significantly associated with PVA (Mahadev et al., 2017) (Table 3).
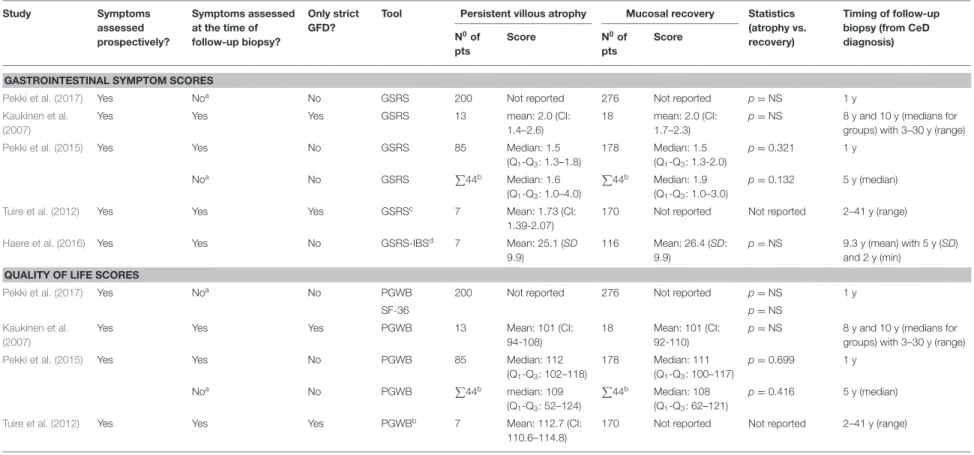
Five studies (Kaukinen et al., 2007; Tuire et al., 2012; Pekki et al., 2015, 2017; Haere et al., 2016) reported gastrointestinal symptom scores measured with the Gastrointestinal Symptom Rating Scale (GSRS) or its irritable bowel syndrome-adapted version (GSRS-IBS). Four of which performed statistical analysis and reported no association between histology and the scores consistently (Kaukinen et al., 2007; Pekki et al., 2015, 2017;
Haere et al., 2016) (Table 4). Results were similar in quality of life measured with the Psychological General Well-Being Index (PGWB) and/or the 36-Item Short Form Health Survey (SF-36) (Kaukinen et al., 2007; Tuire et al., 2012; Pekki et al., 2015, 2017) (Table 4).
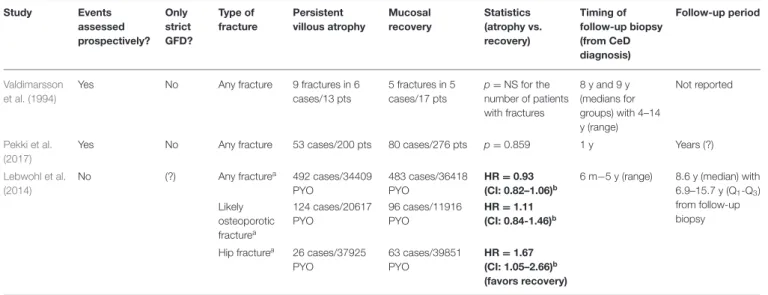
Metabolic Bone Disease and Bone Fractures
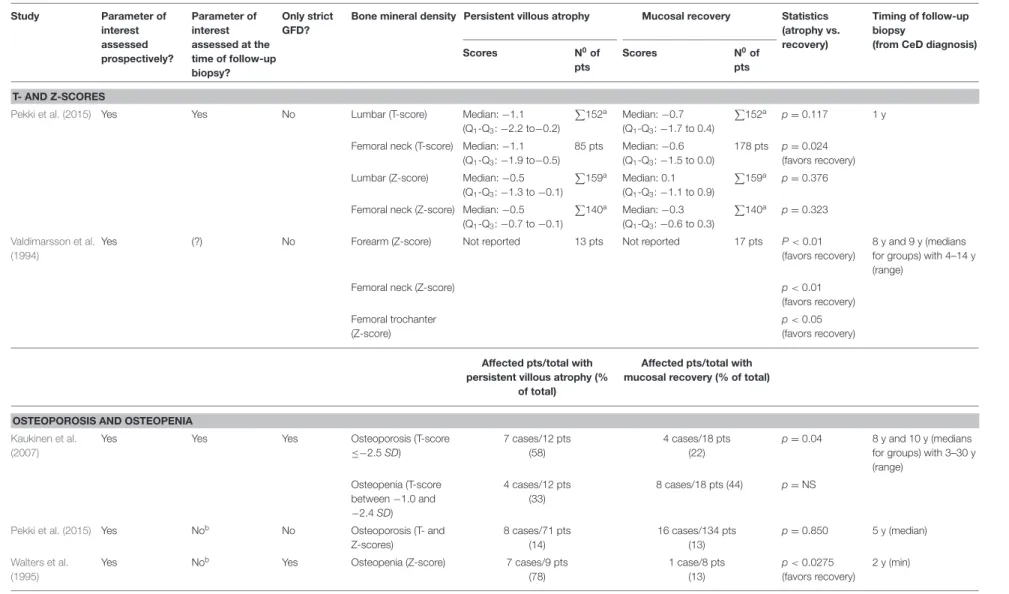
Four studies assessed bone mineral density in univariate analysis (Valdimarsson et al., 1994; Walters et al., 1995; Kaukinen et al., 2007; Pekki et al., 2015) (Table 5). Patients with PVA tended to have lower forearm, femoral and trochanter Z-scores (Valdimarsson et al., 1994); and lower femoral T-score with similar femoral Z- and lumbar T- and Z-scores than those with MR (Pekki et al., 2015). One study showed a reduced bone mineral density with PVA (OR = 24.5, p < 0.0275 favoring MR) (Walters et al., 1995). Two studies investigated the risk of osteoporosis in the long-term and reported conflicting results: a case-control study reported an increased frequency of osteoporosis with PVA (Kaukinen et al., 2007) but a cohort study failed to confirm (Pekki et al., 2015).
Three studies (Valdimarsson et al., 1994; Lebwohl et al., 2014;
Pekki et al., 2017) reported no association between fractures and
Frontiers in Physiology | www.frontiersin.org 6 November 2019 | Volume 10 | Article 1408
Szakácsetal.Follow-UpHistologyinCeliacDisease
TABLE 3 |Presence of symptoms in celiac patients with persistent villous atrophy and mucosal recovery.
Study Symptoms assessed prospectively?
Symptoms assessed at the time of follow-up biopsy?
Only strict GFD?
Symptoms N0of symptomatic pts/total with persistent villous atrophy (% of total)
N0of symptomatic pts/total with mucosal recovery (% of total)
Statistics
(atrophy vs. recovery)
Timing of follow-up biopsy
(from CeD diagnosis)
SYMPTOMATIC vs. ASYMPTOMATIC PTS Carroccio
et al. (2008)
Yes Yes Yes Specifieda 36 cases/45 pts
(80)
6 cases/24 pts (25)
OR=12 (CI: 3.7–38.9)
(p<0.0001, favors recovery);
adjusted OR=3.2 (CI: 1.6–6.4)
(p=0.001, favors recovery)b
6.5 y and 6.1 y (means for groups) with 3.6 y and 4.6 y (SDs for groups)
Fang et al.
(2017)
No Yes Yes Specifiedc 53 cases/77 pts
(69)
116 cases/203 pts (57)
OR=1.656
(CI: 0.949–2.889) (p=0.076, favors recovery)
2 y (min)
Kaukinen et al. (2007)
Yes Nod Yes Not specified 4 cases/13 pts
(31)
Not reported Not reported 8 y and 10 y (medians for
groups) with 3–30 y (range) Leonard et al.
(2017)
No Yes No Not specified 11 cases/20 pts
(55)
58 cases/83 pts (70)
p=NS 2.4 y (median) with 1–12 y
(range) and 1.4–4 y (Q1-Q3) Selby et al.
(1999)
(?) Noe Yes Not specified 5 cases/26 pts
(19)
3 cases/24 pts (13)
Not reported Not reported
Thornquist et al. (1993)
Yes Noe Yes Specifiedf 1 case/4 pts
(25)
7 cases/9 pts (78)
Not reported 17 y (mean) with 15–18 y
(range?) SPECIFIC SYMPTOMs (PRESENT vs. ABSENT)
Cammarota et al. (2007)
Yes Yes No Diarrhea 10 cases/49 pts
(20)
2 cases/16 pts (13)
Not reported 6–14 m (range)
Bloating 9 cases/49 pts
(18)
3 cases/16 pts (19) Abdominal pain 5 cases/49 pts
(10)
7 cases/16 pts (44) Carroccio
et al. (2008)
Yes Yes Yes Typical symptoms 6 cases/45 pts
(13)
0 cases/24 pts (0)
p=0.005 (favors recovery) 6.5 y and 6.1 y (means for groups) with 3.6 y and 4.6 y (SDs for groups)
GERD-like symptoms 9 cases/45 pts (20)
3 cases/24 (13) p=0.01 (favors recovery) lower abdominal
symptoms
21 cases/45 pts (47)
3 cases/21 pts (14)
p=0.001 (favors recovery) Ghazzawi
et al. (2014)
No Yes Yes Abdominal pain 2 cases/5 pts
(40)
17 cases/34 pts (50)
Not reported 2 y (mean) with 22 m (SD)
and 4–120 m (range)
Diarrhea 2 cases/5 pts
(40)
5 cases/34 pts (15) Constipation 0 cases/5 pts
(0)
5 cases/34 pts (15)
(Continued)
FrontiersinPhysiology|www.frontiersin.org7November2019|Volume10|Article1408
Szakácsetal.Follow-UpHistologyinCeliacDisease
TABLE 3 |Continued
Study Symptoms assessed prospectively?
Symptoms assessed at the time of follow-up biopsy?
Only strict GFD?
Symptoms N0of symptomatic pts/total with persistent villous atrophy (% of total)
N0of symptomatic pts/total with mucosal recovery (% of total)
Statistics
(atrophy vs. recovery)
Timing of follow-up biopsy
(from CeD diagnosis)
Mahadev et al. (2017)
No Yes Yes Bloating 431 cases/511 pts
(84)
736 cases/834 pts (88)
p=0.04 (favors atrophy),p=0.001 (favors atrophy),p=0.0009 (favors atrophy), andp=0.04 (favors recovery) for bloating, abdominal pain, nausea, and heartburn, respectively;p=NS for the other comparisons;
adjustedp=NS for all comparisonsg
4 y (median) with 1 y (min) Abdominal pain 410 cases/511 pts
(80)
724 cases/834 pts (87)
Tiredness 421 cases/511 pts
(82)
708 cases/834 (85)
Diarrhea 375 cases/511 pts
(73)
643 cases/834pts (77)
Nausea 239 cases/511 pts
(47)
451 cases/834 pts (54)
Constipation 263 cases/511 pts (51)
421 cases/834 pts (50)
Heartburn 140 cases/511 pts
(27)
186 cases/834 pts (22)
Headache 112 cases/511 pts
(22)
208 cases/834 pts (25)
Multivariate analyses are highlighted with bold.aSymptoms included typical (chronic diarrhea, weight loss, anemia), GERD-like, and lower abdominal symptoms (abdominal pain, constipation).bAnalysis was adjusted for age, gender, duration of GFD, diagnostic histological severity.cSymptoms included abdominal pain, bloating, nausea, fatigue, diarrhea, bloody stool, steatorrhea, and weight loss.dSymptoms were assessed 4–5 years after the follow-up biopsy.
eSymptoms were evaluated after follow-up biopsy (interval undetermined).fSymptoms included gastrointestinal and malabsorptive symptoms, such as diarrhea, borborygmi, abdominal pain, fatty stool, and anemia.gThe analysis was adjusted for age, gender, body mass index, duration of GFD, medications, and laboratory tests. (?) indicates uncertainty. CeD, celiac disease; CI, confidence interval; GERD, gastroesophageal reflux disease; GFD, gluten-free diet;
m, month; min, minimum; OR, odds ratio; pts, patients; NS, non-significant; SD, standard deviations; Q1-Q3, 25 and 75% quartiles; y, year.
FrontiersinPhysiology|www.frontiersin.org8November2019|Volume10|Article1408
Szakácsetal.Follow-UpHistologyinCeliacDisease
TABLE 4 |Symptom scores and quality of life indices in celiac patients with persistent villous atrophy and mucosal recovery.
Study Symptoms
assessed prospectively?
Symptoms assessed at the time of follow-up biopsy?
Only strict GFD?
Tool Persistent villous atrophy Mucosal recovery Statistics (atrophy vs.
recovery)
Timing of follow-up biopsy (from CeD diagnosis) N0of
pts
Score N0of
pts
Score
GASTROINTESTINAL SYMPTOM SCORES
Pekki et al. (2017) Yes Noa No GSRS 200 Not reported 276 Not reported p=NS 1 y
Kaukinen et al.
(2007)
Yes Yes Yes GSRS 13 mean: 2.0 (CI:
1.4–2.6)
18 mean: 2.0 (CI:
1.7–2.3)
p=NS 8 y and 10 y (medians for groups) with 3–30 y (range)
Pekki et al. (2015) Yes Yes No GSRS 85 Median: 1.5
(Q1-Q3: 1.3–1.8)
178 Median: 1.5 (Q1-Q3: 1.3-2.0)
p=0.321 1 y
Noa No GSRS P
44b Median: 1.6 (Q1-Q3: 1.0–4.0)
P44b Median: 1.9 (Q1-Q3: 1.0–3.0)
p=0.132 5 y (median)
Tuire et al. (2012) Yes Yes Yes GSRSc 7 Mean: 1.73 (CI:
1.39-2.07)
170 Not reported Not reported 2–41 y (range)
Haere et al. (2016) Yes Yes No GSRS-IBSd 7 Mean: 25.1 (SD
9.9)
116 Mean: 26.4 (SD:
9.9)
p=NS 9.3 y (mean) with 5 y (SD) and 2 y (min)
QUALITY OF LIFE SCORES
Pekki et al. (2017) Yes Noa No PGWB 200 Not reported 276 Not reported p=NS 1 y
SF-36 p=NS
Kaukinen et al.
(2007)
Yes Yes Yes PGWB 13 Mean: 101 (CI:
94-108)
18 Mean: 101 (CI:
92-110)
p=NS 8 y and 10 y (medians for groups) with 3–30 y (range)
Pekki et al. (2015) Yes Yes No PGWB 85 Median: 112
(Q1-Q3: 102–118)
178 Median: 111
(Q1-Q3: 100–117)
p=0.699 1 y
Noa No PGWB P
44b median: 109 (Q1-Q3: 52–124)
P44b Median: 108 (Q1-Q3: 62–121)
p=0.416 5 y (median)
Tuire et al. (2012) Yes Yes Yes PGWBb 7 Mean: 112.7 (CI:
110.6–114.8)
170 Not reported Not reported 2–41 y (range)
aScores were assessed years after the follow-up biopsy.bThe number of patients were not reported for atrophic and recovery groups separately.cSubdimensions of GSRS were reported within the original article in detail.dA 3-day modified version of the original tool was used. CeD, celiac disease; CI, confidence interval; GFD, gluten-free diet; GSRS, Gastrointestinal Symptom Rating Scale; GSRS-IBS: Gastrointestinal Symptom Rating Scale for Irritable Bowel Syndrome; min, minimum; NS, non-significant; PGWB, Psychological General Well-Being; pts, patients; SF-36, Short Form Health Survey-36; Q1-Q3, 25% and 75% quartiles; SD: standard deviation.
FrontiersinPhysiology|www.frontiersin.org9November2019|Volume10|Article1408
Szakácsetal.Follow-UpHistologyinCeliacDisease
TABLE 5 |Bone mineral density in celiac patients with persistent villous atrophy and mucosal recovery.
Study Parameter of
interest assessed prospectively?
Parameter of interest assessed at the time of follow-up biopsy?
Only strict GFD?
Bone mineral density Persistent villous atrophy Mucosal recovery Statistics (atrophy vs.
recovery)
Timing of follow-up biopsy
(from CeD diagnosis)
Scores N0of
pts
Scores N0of
pts T- AND Z-SCORES
Pekki et al. (2015) Yes Yes No Lumbar (T-score) Median:−1.1
(Q1-Q3:−2.2 to−0.2)
P152a Median:−0.7 (Q1-Q3:−1.7 to 0.4)
P152a p=0.117 1 y
Femoral neck (T-score) Median:−1.1 (Q1-Q3:−1.9 to−0.5)
85 pts Median:−0.6 (Q1-Q3:−1.5 to 0.0)
178 pts p=0.024 (favors recovery) Lumbar (Z-score) Median:−0.5
(Q1-Q3:−1.3 to−0.1)
P159a Median: 0.1 (Q1-Q3:−1.1 to 0.9)
P159a p=0.376
Femoral neck (Z-score) Median:−0.5 (Q1-Q3:−0.7 to−0.1)
P140a Median:−0.3 (Q1-Q3:−0.6 to 0.3)
P140a p=0.323
Valdimarsson et al.
(1994)
Yes (?) No Forearm (Z-score) Not reported 13 pts Not reported 17 pts P<0.01
(favors recovery)
8 y and 9 y (medians for groups) with 4–14 y (range)
Femoral neck (Z-score) p<0.01
(favors recovery) Femoral trochanter
(Z-score)
p<0.05 (favors recovery) Affected pts/total with
persistent villous atrophy (%
of total)
Affected pts/total with mucosal recovery (% of total)
OSTEOPOROSIS AND OSTEOPENIA Kaukinen et al.
(2007)
Yes Yes Yes Osteoporosis (T-score
≤−2.5SD)
7 cases/12 pts (58)
4 cases/18 pts (22)
p=0.04 8 y and 10 y (medians for groups) with 3–30 y (range)
Osteopenia (T-score between−1.0 and
−2.4SD)
4 cases/12 pts (33)
8 cases/18 pts (44) p=NS
Pekki et al. (2015) Yes Nob No Osteoporosis (T- and
Z-scores)
8 cases/71 pts (14)
16 cases/134 pts (13)
p=0.850 5 y (median) Walters et al.
(1995)
Yes Nob Yes Osteopenia (Z-score) 7 cases/9 pts
(78)
1 case/8 pts (13)
p<0.0275 (favors recovery)
2 y (min)
All measurements were performed with dual-energy X-ray absorptiometry except in forearm bone mineral density in the study ofValdimarsson et al. (1994)which used single-photon absorptiometry.aThe number of patients were not reported for atrophic and recovery groups separately.bParameter was assessed years after follow-up biopsy. (?) indicates uncertainty. GFD, gluten-free diet; m, month; min, minimum; NS, non-significant; pts, patients Q1-Q3, 25% and 75% quartiles; SD, standard deviation; y, year.
FrontiersinPhysiology|www.frontiersin.org10November2019|Volume10|Article1408
Szakács et al. Follow-Up Histology in Celiac Disease
TABLE 6 |Fractures in celiac patients with persistent villous atrophy and mucosal recovery.
Study Events
assessed prospectively?
Only strict GFD?
Type of fracture
Persistent villous atrophy
Mucosal recovery
Statistics (atrophy vs.
recovery)
Timing of follow-up biopsy (from CeD diagnosis)
Follow-up period
Valdimarsson et al. (1994)
Yes No Any fracture 9 fractures in 6
cases/13 pts
5 fractures in 5 cases/17 pts
p=NS for the number of patients with fractures
8 y and 9 y (medians for groups) with 4–14 y (range)
Not reported
Pekki et al.
(2017)
Yes No Any fracture 53 cases/200 pts 80 cases/276 pts p=0.859 1 y Years (?)
Lebwohl et al.
(2014)
No (?) Any fracturea 492 cases/34409
PYO
483 cases/36418 PYO
HR=0.93 (CI: 0.82–1.06)b
6 m−5 y (range) 8.6 y (median) with 6.9–15.7 y (Q1-Q3) from follow-up biopsy Likely
osteoporotic fracturea
124 cases/20617 PYO
96 cases/11916 PYO
HR=1.11 (CI: 0.84-1.46)b
Hip fracturea 26 cases/37925 PYO
63 cases/39851 PYO
HR=1.67 (CI: 1.05–2.66)b (favors recovery)
Multivariate analyses are highlighted with bold.aDetailed data are available in the original article.bThe analysis was adjusted for age, gender, duration of celiac disease, calendar period, and educational attainment. (?) indicates uncertainty. CI, confidence interval; GFD, gluten-free diet; HR, hazard ratio (reference group: mucosal recovery); NS, non-significant; PYO, person-years observation; Q1-Q3: 25 and 75% quartiles.
follow-up histology, except in the frequency of hip fractures being seemingly increased after a 5-years follow-up with PVA (adjusted HR=2.18, CI: 1.17–4.05) (Lebwohl et al., 2014) (Table 6).
Micro- and Macronutrients
Table 7summarizes the laboratory findings.
The association of water-soluble vitamins and follow-up histology is understudied. We found the numerical values of vitamins B2and B6levels or their laboratory indicators in patients with MR and PVA but the studies did not perform statistical comparison (Dickey et al., 2008). Regarding vitamins B12and B9 (folic acid) levels, studies found no difference between groups by histology (Pekki et al., 2015; Fang et al., 2017). No reports are available on other water-soluble vitamins.
Reports on fat-soluble vitamins are scarce. Only numerical data are available on vitamin A without statistical comparison made by the authors (Valdimarsson et al., 1994). Patients with PVA tended to have lower 25-hydroxyvitamin D level [and total calcium (Fang et al., 2017)], though serum parathyroid hormone (Valdimarsson et al., 1994; Pekki et al., 2015), ionized calcium (Valdimarsson et al., 1994; Pekki et al., 2015) and alkaline phosphatase (Valdimarsson et al., 1994) seemed similar in patients with MR and PVA.
Zinc but not copper deficiency may be associated with PVA (39 vs. 14% for zinc deficiency with PVA and MR, respectively, p=0.0005) (Fang et al., 2017).
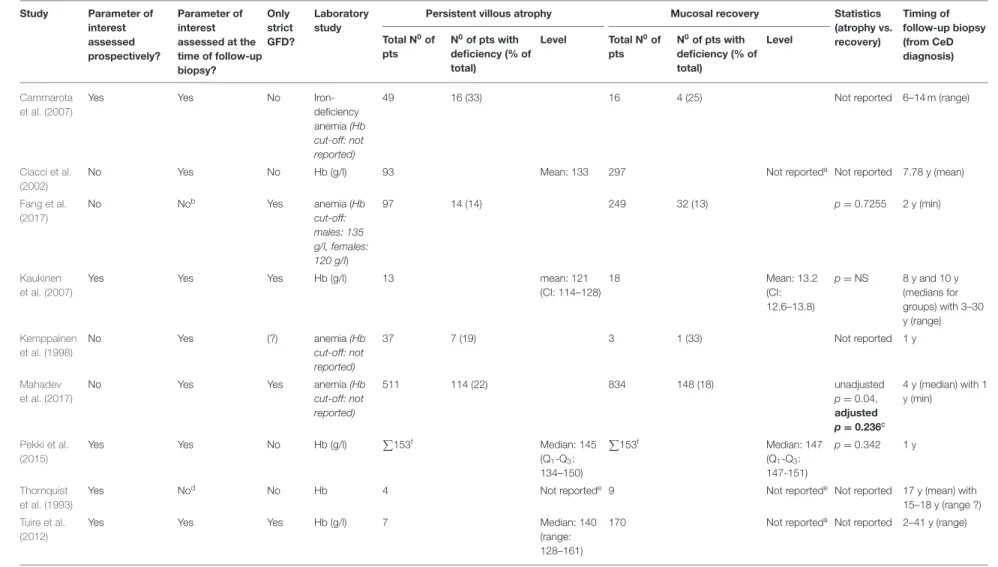
Anemia
Nine studies reported on hemoglobin, four studies in dichotomies (aaemic vs. non-anemic) and five as continuous data (Thornquist et al., 1993; Kemppainen et al., 1998; Ciacci et al., 2002; Cammarota et al., 2007; Kaukinen et al., 2007; Tuire et al., 2012; Pekki et al., 2015; Fang et al., 2017; Mahadev et al., 2017), of which four reported statistical comparisons (Kaukinen
et al., 2007; Pekki et al., 2015; Fang et al., 2017; Mahadev et al., 2017) (Table 8). Hemoglobin levels proved to be not statistically different in two studies (Kaukinen et al., 2007; Pekki et al., 2015).
Another two studies examined the frequency of anemia (Fang et al., 2017; Mahadev et al., 2017), of which one found it more frequent with PVA (22 vs. 18%,p=0.04) (Mahadev et al., 2017).
However, the association was not confirmed after adjusting for co-variates (p=0.236).
Body Mass Index
Of the six studies reporting body mass index, three provided statistical evidence on having no significant difference between groups while the other three reported numerical values without analysis (Valdimarsson et al., 1994; Kaukinen et al., 2007; Dickey et al., 2008; Tuire et al., 2012; Pekki et al., 2015; Cornell et al., 2016) (Table 9).
Malignant Tumors and Other Co-morbid Conditions Four studies reported the overall rate of malignant tumors during follow-up (Kaukinen et al., 2007; Tuire et al., 2012; Pekki et al., 2015, 2017), two of which performed univariate analysis where event rates were 4.5 vs. 5.1% (p=0.762) and 11.3 vs. 6% (p= 0.116) with PVA vs. MR, respectively (Pekki et al., 2015, 2017) (Table 10).
Incidence of lymphomas was 1.4 vs. 1.6% (p= 0.968) with PVA vs. MR in univariate analysis (Pekki et al., 2015). In a registry analysis, PVA had an adjusted HR of 2.26 (CI: 1.18–4.34) for the overall rate of lymphomas, being true for the subgroup of non- Hodgkin lymphomas but not for the subset of T-cell lymphomas (Lebwohl et al., 2013b) (Table 10).
Sporadic records concerned other co-morbid conditions.
Cardiovascular diseases including heart failure and atrial fibrillation (Lebwohl et al., 2015a), hypertension (Mahadev et al., 2017), serious infections (including sepsis, streptococcal,
Frontiers in Physiology | www.frontiersin.org 11 November 2019 | Volume 10 | Article 1408