REGULAR ARTICLE
Validation of the United Kingdom copy-number alteration classi fi er in 3239 children with B-cell precursor ALL
Lina Hamadeh,1,* Amir Enshaei,1,* Claire Schwab,1Cristina N. Alonso,2Andishe Attarbaschi,3Gisela Barbany,4Monique L. den Boer,5 Judith M. Boer,5Marcin Braun,6Luciano Dalla Pozza,7Sarah Elitzur,8Mariana Emerenciano,9Larisa Fechina,10,11Maria Sara Felice,2 Eva Fronkova,12,13Ir ´en Haltrich,14Mats M. Heyman,15Keizo Horibe,16Toshihiko Imamura,17Marta Jeison,18G ´abor Kov ´acs,14
Roland P. Kuiper,5Wojciech Mlynarski,19Karin Nebral,20Ingegerd Ivanov ¨Ofverholm,4Agata Pastorczak,19Rob Pieters,5,21Henriett Piko,22 Maria S. Pombo-de-Oliveira,23Patricia Rubio,2Sabine Strehl,20Jan Stary,13Rosemary Sutton,24Jan Trka,12,13Grigory Tsaur,10,11 Nicola Venn,24Ajay Vora,25Mio Yano,17Christine J. Harrison,1and Anthony V. Moorman,1on behalf of the International BFM Study Group
1Wolfson Childhood Cancer Research Centre, Northern Institute for Cancer Research, Newcastle University, Newcastle, United Kingdom;2Hematology-Oncology Department, Hospital de Pediatr´ıa“Prof. Dr. J. P. Garrahan,”Buenos Aires, Argentina;3Department of Pediatric Hematology and Oncology, St. Anna Children’s Hospital, Medical University of Vienna, Vienna, Austria;4Department of Molecular Medicine and Surgery, Clinical Genetics Section, Center for Molecular Medicine, Karolinska Institutet, Stockholm, Sweden;5Princess M ´axima Center for Pediatric Oncology, Utrecht, The Netherlands;6Department of Pathology, Medical University of Lodz, Lodz, Poland;7Cancer Center for Children, Sydney Childrens Hospital Network, Westmead, NSW, Australia;8Pediatric Hematology Oncology, Schneider Children’s Medical Center, Sackler Faculty of Medicine, Tel Aviv University, Tel Aviv, Israel;9Division of Clinical Research, Research Centre, Instituto Nacional de Cancer, Rio de Janeiro, Brazil;ˆ 10Regional Children’s Hospital 1, Ekaterinburg, Russia;11Research Institute of Medical Cell Technologies, Ekaterinburg, Russia;12Childhood Leukaemia Investigation, Prague, Czech Republic;
13Department of Paediatric Haematology/Oncology, 2nd Faculty of Medicine, Charles University and University Hospital Motol, Prague, Czech Republic;142nd Department of Paediatrics, Semmelweis University, Budapest, Hungary;15Department of Women’s and Children’s Health, Karolinska Institutet, Stockholm, Sweden;16Clinical Research Center, National Hospital Organization Nagoya Medical Center, Nagoya, Japan;17Department of Pediatrics, Kyoto Prefectural University of Medicine, Kyoto, Japan;18Cancer Cytogenetic Laboratory, Schneider Children’s Medical Center of Israel, Petah Tikva, Israel;19Department of Pediatrics, Oncology and Hematology, Medical University of Lodz, Lodz, Poland;20Children’s Cancer Research Institute, St. Anna Kinderkrebsforschung, Vienna, Austria;21Dutch Childhood Oncology Group, Utrecht, The Netherlands;
221st Department of Medicine, Semmelweis University, Budapest, Hungary;23Pediatric Haematology-Oncology Program, Research Centre, Instituto Nacional de Cˆancer, Rio de Janeiro, Brazil;24Children’s Cancer Institute, Lowy Cancer Research Centre, University of New South Wales, Sydney, NSW, Australia; and25Department of Haematology, Great Ormond Street Hospital, London, United Kingdom
Key Points
•The UKALL-CNA classifier is a validated and robust prognostic tool that can be deployed in a variety of clinical trial settings.
•The UKALL-CNA classifier can be used to refine risk stratifica- tion for patients with intermediate-risk cytogenetics.
Genetic abnormalities provide vital diagnostic and prognostic information in pediatric acute lymphoblastic leukemia (ALL) and are increasingly used to assign patients to risk groups.
We recently proposed a novel classifier based on the copy-number alteration (CNA) profile of the 8 most commonly deleted genes in B-cell precursor ALL. This classifier defined 3 CNA subgroups in consecutive UK trials and was able to discriminate patients with intermediate- risk cytogenetics. In this study, we sought to validate the United Kingdom ALL (UKALL)–CNA classifier and reevaluate the interaction with cytogenetic risk groups using individual patient data from 3239 cases collected from 12 groups within the International BFM Study Group. The classifier was validated and defined 3 risk groups with distinct event-free survival (EFS) rates: good (88%), intermediate (76%), and poor (68%) (P,.001). There was no evidence of heterogeneity, even within trials that used minimal residual disease to guide therapy. By integrating CNA and cytogenetic data, we replicated our original key observation that patients with intermediate-risk cytogenetics can be stratified into 2 prognostic subgroups.
Group A had an EFS rate of 86% (similar to patients with good-risk cytogenetics), while group B patients had a significantly inferior rate (73%,P,.001). Finally, we revised the overall genetic classification by defining 4 risk groups with distinct EFS rates: very good (91%), good (81%), intermediate (73%), and poor (54%),P,.001. In conclusion, the UKALL-CNA classifier is a robust prognostic tool that can be deployed in different trial settings and used to refine established cytogenetic risk groups.
Submitted 5 September 2018; accepted 6 December 2018. DOI 10.1182/
bloodadvances.2018025718.
*L.H. and A.E. contributed equally to this study.
The full-text version of this article contains a data supplement.
© 2019 by The American Society of Hematology
Introduction
Acute lymphoblastic leukemia (ALL) is the most common type of cancer in childhood. Survival rates in high-income countries have improved from 10% in the 1960s to 90% in 2015.1Although similar improvements have been achieved in middle-income countries, the absolute survival rates are lower (;75%).2Treatment stratification according to biological features and response has played an important role in the improvement of survival rates. Despite these improvements relapse remains the major clinical challenge in ALL.
Therefore, it is crucial to develop novel risk-stratification algorithms to help ensure that each patient receives the appropriate type and intensity of treatment to further increase survival rates and reduce long-term side effects.
Chromosomal abnormalities are the hallmark of ALL and have been widely used as prognostic markers. For example, in B-cell precursor ALL (BCP-ALL), patients with high hyperdiploidy (51-65 chromosomes) or ETV6-RUNX1 have a favorable outcome,3 while patients with BCR-ABL1, KMT2A (MLL) rearrangements, TCF3-HLF, intrachromosomal amplification of chromosome 21 (iAMP21), near haploidy (,30 chromosomes), or low hypodiploidy (30-39 chromosomes) are associated with unfavorable outcomes and require intensive treatment.4The remaining patients, including TCF3-PBX1, are usually classified as intermediate risk, and those without an established chromosomal abnormality are referred to as B-other ALL.3
Recent genome-wide analysis has shown that mutations and, especially, copy-number alterations (CNAs) of genes involved in B-cell differentiation, cell cycle regulation, transcription, prolifera- tion, and cell survival are common in BCP-ALL.5,6The most fre- quently altered loci areEBF1, IKZF1,PAX5, CDKN2A/B, ETV6, BTG1,RB1, and PAR1 (for detection of P2RY8-CRLF2). The outcomes associated with these CNAs have been extensively studied, and prognostic markers have been described among them. For example,IKZF1 deletion,P2RY8-CRLF2fusion, and PAX5amplification have been linked to poor outcomes in some studies.7-14 However, there is evidence that the prognostic effect of secondary abnormalities is context dependent and can be modulated by the presence of other genetic abnormalities.
For example, the prognostic effect of IKZF1 deletions appears worse when combined with BTG1 deletions or as a part of the newly described IKZF1plusprofile.15,16Notably,IKZF1deletions do not adversely affect the good outcome associated with ERG deletions.17 Therefore, it is important to analyze the effect of different combinations of deletions and integrate them with other risk factors.
In our previous study, we used CNA data generated from consecutive childhood treatment trials, UKALL97/99 and UKALL2003, to define and validate a risk classifier (United Kingdom ALL [UKALL]–CNA).18 This classifier, which is based on the copy-number status of the 8 most commonly deleted regions in BCP-ALL, defined 3 CNA risk groups. Here, we further validate the classifier using a total 3239 patients collected from 12 clinical study groups who are all members of the International BFM (Berlin-Frankfurt-Munster) Study Group (iBFM). We confirm the robustness of this classifier and demonstrate how it interacts with cytogenetic and minimal residual disease (MRD) risk groups. Finally, we propose a revised integrated cytogenetic and CNA risk classification.
Methods
Patients
Patients eligible for this study were children and adolescents aged 1 to 19 years diagnosed with BCP-ALL before the end of 2014, treated on a clinical trial, and tested by multiplex ligation–dependent probe amplification (MLPA) using the SALSA P335 kit. All participat- ing centers obtained local ethical committee approval and written informed consent in accordance with the Declaration of Helsinki.
The demographic, clinical, genetic, and outcome data of the 3557 patients included were treated on 16 clinical trials collected from 12 study groups (supplemental Table 1). A total of 318 patients, who did not meet the inclusion criteria or had incomplete data, were excluded. Thus, 3239 patients, here after referred to as the iBFM cohort, were available for analysis. The number of patients, their recruitment period, follow-up time, and outcome varied among the study groups (supplemental Figure 1A-D).
Classification of cases
Genetic abnormalities were characterized by one or more of the following tests: cytogenetic analysis, fluorescence in situ hybridization, reverse transcription polymerase chain reaction, single- nucleotide polymorphisms, array or comparative genomic hybrid- ization array. There was some variation in the distribution of cases by cytogenetic risk group (supplemental Figure 1E), which was driven by heterogeneous screening strategies. The high frequency of B-other ALL in Brazil, Poland, JACLS ALL-02, and Russia is likely due to the fact that not all cases were tested for all chromosomal abnormalities.
The copy-number status of EBF1, IKZF1, PAX5, CDKN2A/B, ETV6,BTG1,RB1, and PAR1 was determined using the SALSA MLPA kit P335 (MRC Holland, Amsterdam, The Netherlands) according to the manufacturer’s instructions. Each of these regions was coded, by the contributing study groups, as per the original study (see supplemental Methods)
We classified each patient in this cohort into 3 mutually exclusive risk groups based on the cytogenetic results (Figure 1A)3 and 3 mutually exclusive risk groups according to the UKALL-CNA classifier (Figure 1B),18 and we integrated the UKALL-CNA classifier with cytogenetic risk groups to generate a 2-tier genetic risk (Figure 1C).18
Statistical methods
As in the original study, we used event-free survival (EFS) as the primary end point, defining it as the time from the start of treatment to relapse, second tumor, or death, censoring at last contact and quoting 5-year rates. Secondary end points, relapse rate and overall survival, were considered but have not been presented, because there was no discordance between the rates. Only a small number of patients failed to achieve a complete remission (n551) or had a second tumor (n527). Survival rates were calculated and com- pared using Kaplan-Meier methods, log-rank tests, and univariate Cox regression models. Stratified Cox models were used to incorporate the effect of treatment risk group. Other comparisons were performed using x2 or Fisher’s exact test as appropriate.
Forest plots were drawn to depict the heterogeneity (ie, variation) in the effect between the study groups. Heterogeneity was tested using Higgins’s I2measure of inconsistency.19Statistically significant heterogeneity was defined as I2 $50% and a mild
heterogeneity as between 25% and 50%. All tests were conducted at the 5% significance level. All analyses were performed using Intercooled Stata (StataCorp 2015 Stata Statistical Software Release 14; StataCorp, College Station, TX) and R version 3.4.3 (http://www.R-project.org).
Results
Direct validation of the UKALL-CNA classifier and genetic risk classification
Based on the copy-number status of the 8 defined loci, 106 unique CNA profiles were observed in the iBFM cohort. The most frequent CNA profile was“no deletions”and was observed in 40% of the cases. Among the remaining CNA profiles, 93 were observed in
,1% of cases each, whereas only 5 profiles were present in$4%
of cases. These 5 CNA profiles were the isolated deletion of CDKN2A/B(11%),ETV6(7%),IKZF1(4%), orPAX5(4%) and the concurrent deletion ofPAX5andCDKN2A/B(5%) (supplemental Figure 2). There was a total of 29 new CNA profiles that had not been observed in the original UK study.18However, these profiles were only observed in 45 cases and in total comprised,0.1% of cases. As per the original algorithm, cases with these profiles were assigned to the CNA-IR group.18
Overall, the majority of patients (58%) had a CNA-GR profile, with 33% and 9% of cases harboring a CNA-IR and CNA-PR profile, respectively (Figure 1B). The distribution of CNA risk groups varied between the study groups and was driven by the difference in frequency of regions specific alterations (supplemental Figure 1F).
• High hyperdiploidy
• ETV6-RUNX1 CYTO-GR
CYTO-IR
CYTO-PR
Cytogenetic Risk
• TCF3-PBX1
• B-other
• BCR-ABL
• KMT2A
• TCF3-HLF
• iAMP21
• Near haploidy/Low hyperdiploidy
A
• No deletion in any of the regions
• Isolated deletion of ETV6, PAX5, or BTG1
• ETV6 deletion with single deletion of BTG1, CDKN2A/B or PAX5
• All other CNA profiles CNA-GR
CNA-IR
CNA-PR
UKALL-CNA Risk
• Isolated IKZF1, PAR1, or RB1 deletion
• Deletion of IKZF1/PAX5/CDKN2A/B
B
CNA-GR GEN-GR GEN-GR GEN-PR
CNA-IR GEN-GR GEN-PR GEN-PR
CNA-PR GEN-GR GEN-PR GEN-PR
CYTO-GR CYTO-IR CYTO-PR
UKALL-CNA Risk
Cytogenetic Risk
C
Figure 1.Definition of the cytogenetic, copy number alteration and integrated classifications used in this study.
Definition of the classifiers used in the current study: cytogenetic (A), UKALL-CNA (B), and original genetic risk (C). CYTO, cytogenetic; GEN, genetics; GR, good risk; IR, intermediate risk;
PR, poor risk.
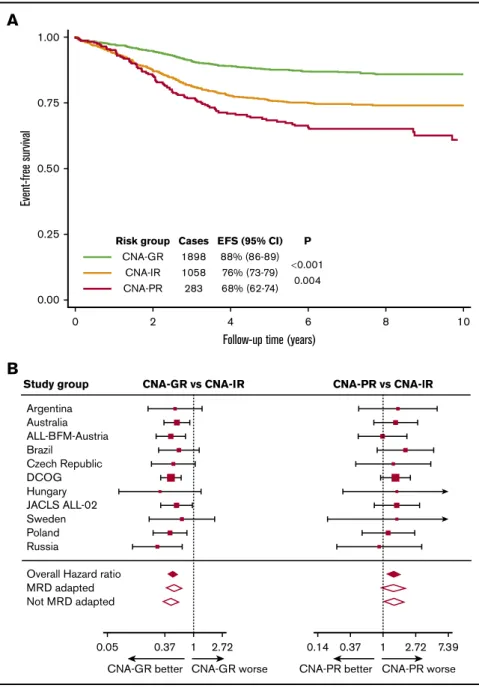
However, within each study group, the CNA-GR profile was the most prevalent (range, 50% to 72%), followed by CNA-IR (range, 22% to 40%) and finally CNA-PR (range, 5% to 10%) (supplemental Figure 1G). The UKALL-CNA classifier defined patients with distinct EFS (Figure 2A). Patients with a CNA-GR profile had a 50% reduced risk of an event compared with patients with a CNA-IR profile (Table 1), whereas patients with a CNA-PR profile had a 40% increased risk of an event compared with CNA-IR patients (Table 1). There was no evidence of heterogeneity across the 12 study groups for either comparison (both I250) (Figure 2B).
MRD is also an important risk factor in pediatric ALL, and studies have demonstrated the benefit of using MRD to determine treatment intensity.20-22 Moreover, the prognostic effect of other CNA and gene expression profiles, IKZF1plusandBCR-ABL1-like,
have been shown to be modulated by MRD.23,24 Therefore, we reexamined the prognostic effect of the UKALL-CNA classifier stratifying by protocol type (ie, whether or not treatment was altered on the basis of MRD; MRD adapted vs non–MRD adapted) (supplemental Table 1). Even among the 1753 patients treated on MRD-adapted protocols, the UKALL-CNA classifier defined sub- groups that were prognostic (supplemental Figure 3A). However, the difference between CNA-IR and CNA-PR was not significant (P5.08). As expected the UKALL-CNA classifier was highly prog- nostic among the remaining 1486 patients treated on protocols that did not alter treatment on the basis of MRD (supplemental Figure 3B). The hazard ratios for CNA-GR vs CNA-IR and CNA-PR vs CNA-IR did not differ according to the type of protocol (ie, MRD adapted or not) (Table 1; Figure 2B). In addition, there was no evidence of heterogeneity between different MRD-adapted 1.00
0.75
0.50
Event-free survival
0.25
0.00
0 2
Risk group Cases EFS (95% CI) P CNA-GR 1898 88% (86-89)
0.001 CNA-IR 1058 76% (73-79) CNA-PR 283 68% (62-74) 0.004
4 6 8 10
Follow-up time (years)
A
Argentina
Study group CNA-GR vs CNA-IR CNA-PR vs CNA-lR
Australia ALL-BFM-Austria Brazil
Czech Republic DCOG Hungary JACLS ALL-02 Sweden Poland Russia
Overall Hazard ratio MRD adapted Not MRD adapted
0.05 0.37 1 2.72
CNA-GR better CNA-GR worse
0.14 0.37 1 2.72 7.39 CNA-PR better CNA-PR worse
B
Figure 2.Outcome of 3239 patients in the iBFM cohort stratified by the UKALL-CNA classifier.(A-B) Kaplan-Meier survival curves (A) and forest plots depicting the hazard ratio and 95% CI from univariate Cox regression models comparing the EFS for CNA-GR or CNA-PR against CNA-IR (B). Patients in the Israeli National Study were excluded from the forest plot, as no event occurred in the CNA-GR or CNA-IR groups.
DCOG, Dutch Childhood Oncology Group.
protocols or between the remaining protocols (I250%) (Figure 2B).
Furthermore, stratifying by treatment risk group did not materially alter the hazard ratios comparing the different subgroups (Table 1).
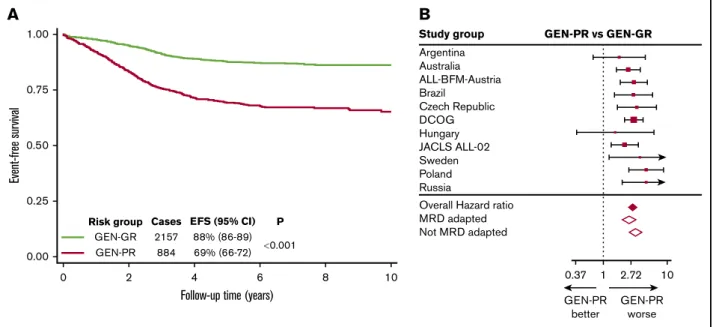
In our previous study,18we integrated the newly defined CNA sub- groups with classical cytogenetic risk groups (Figure 1C) to derive 2 genetic risk groups: GEN-GR and GEN-PR. Replicating this definition on the iBFM cohort produced 2 subgroups comprising 71% and 29% cases, respectively. For most study groups, the distribution of genetic risk groups was similar, except for Brazil, the Israeli National study, and JACLS ALL-02 (supplemental Figure 1).
This variation was driven by incomplete screening strategies. Within this cohort, GEN-GR patients had a significantly higher EFS rate than GEN-PR patients (88% [86-89] vs 69% [66-72],P,.001) (Figure 3A). GEN-PR patients were almost 3 times more likely to suffer an event compared with GEN-GR patients (hazard ratio, 2.92; 95% CI, 2.46-3.47; P,.001). There was no evidence of heterogeneity across the 12 study groups (I250). However, mild heterogeneity in the hazard ratios was found between MRD- adapted and non–MRD-adapted trials (I2540%) (Figure 3B).
Prognostic effect of the UKALL-CNA classifier within cytogenetic risk groups
We classified all patients in the iBFM cohort according to the UK-defined cytogenetic risk groups.3 Overall, the 3 risk groups comprised 48% (CYTO-GR), 46% (CYTO-IR), and 6%
(CYTO–high risk [HR]) of patients. The distribution of these risk groups varied across the 12 study groups (supplemental Figure 1E), reflecting the different definition of cytogenetic risk used by the study groups according to their screening strategies. The majority of CYTO-GR patients had a CNA-GR profile (69%), while the remaining patients were assigned to either CNA-IR (26%) or CNA-PR (5%). In
contrast, 50% CYTO-IR patients had a CNA-GR profile, while patients in the remaining half were either CNA-IR (39%) or CNA-PR (11%). Only 44% of CYTO-HR patients had a CNA-GR profile, while 38% and 18% of the patients had CNA-IR and CNA-PR profiles, respectively (supplemental Figure 4).
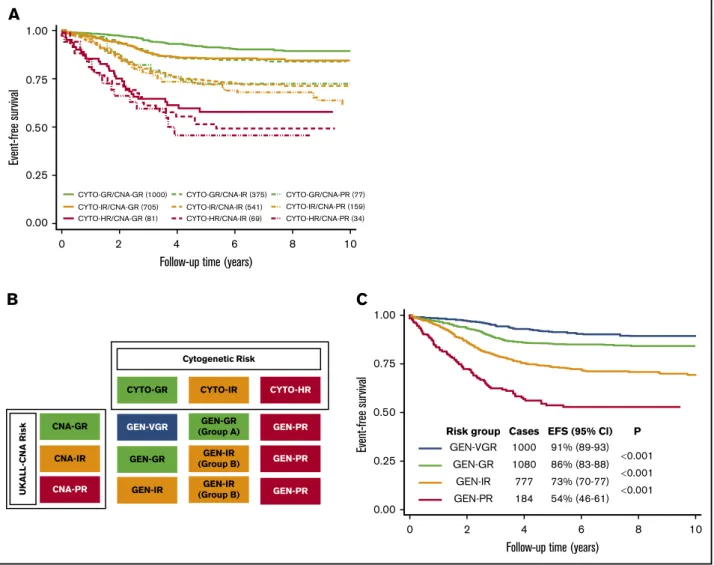
Within the CYTO-GR group, the 3 CNA risk groups were associated with significantly different EFS rates of 91% (89-93) vs 85% (81-89) vs 73% (60-82) (P,.001) for CNA-GR vs CNA-IR vs CNA-PR, respectively (Figure 4A). CYTO-GR/CNA-GR patients had a 42% reduced risk of an event compared with those with the CYTO-GR/CNA-IR (hazard ratio, 0.58; 95% CI, 0.42-0.81;
P5.002). The CYTO-GR/CNA-PR patients had an 85% increased risk of an event compared with CYTO-GR/CNA-IR patients (hazard ratio, 1.85; 95% CI, 1.10-3.11; P 5 .02. Further subgroup analysis revealed the same effect when ETV6-RUNX1 and high hyperdiploidy patients were considered separately (supplemental Figure 5). There was no evidence of heterogeneity across the 12 study groups for either the positive effect of CNA-GR or the negative effect of CNA-PR within CYTO-GR patients (both I250).
However, when we analyzed these effects by protocol type (MRD and non–MRD driven), we did observe significant (I2572%) and mild (I2545%) heterogeneity, respectively (supplemental Table 2).
The beneficial effect of a CNA-GR profile was restricted to those CYTO-GR patients treated on protocols that did not change therapy on the basis of MRD. In contrast, the adverse effect of a CNA-PR profile appeared to be limited to patients treated on MRD-adapted protocols.
Among CYTO-IR patients, the EFS rates across the 3 CNA risk groups was 86% (83-88), 74% (70-78), and 72% (64-79) for CNA- GR, CNA-IR, and CNA-PR, respectively (Figure 4A). There was no statistically significant difference between CYTO-IR/CNA-IR and
Table 1.Cox regression models comparing the risk of an event between different genetic ungroups defined by the UKALL-CNA and revised genetic classifiers
Classifier
Overall MRD adapted Non–MRD adapted
Hazard ratio 95% CI P Hazard ratio 95% CI P Hazard ratio 95% CI P
Univariate models UKALL-CNA
CNA-GR vs CNA-IR 0.48 0.40-0.57 ,.001 0.51 0.39-0.66 ,.001 0.45 0.35-0.58 ,.001
CNA-PR vs CNA-IR 1.43 1.12-1.82 .004 1.39 0.96-2.01 .08 1.42 1.03-1.96 .03
Genetic risk
GEN-GR vs GEN-VGR 1.68 1.29-2.19 ,.001 1.33 0.93-1.91 .12 2.19 1.46-3.29 ,.001
GEN-IR vs GEN-GR 2.05 1.65-2.53 ,.001 2.03 1.46-2.82 ,.001 2.03 1.53-2.69 ,.001
GEN-PR vs GEN-IR 1.95 1.51-2.53 ,.001 1.83 1.23-2.72 .003 2.13 1.51-3.01 ,.001
Models stratified by treatment risk group UKALL-CNA
CNA-GR vs CNA-IR 0.53 0.44-0.64 ,.001 0.53 0.41-0.70 ,.001 0.52 0.41-0.67 ,.001
CNA-PR vs CNA-IR 1.31 1.02-1.66 .03 1.27 0.87-1.84 .22 1.33 0.97-1.83 .08
Genetic risk
GEN-GR vs GEN-VGR 1.62 1.24-2.12 ,.001 1.30 0.90-1.89 .16 2.06 1.37-3.09 .001
GEN-IR vs GEN-GR 1.86 1.50-2.31 ,.001 1.89 1.36-2.65 ,.001 1.82 1.37-2.42 ,.001
GEN-PR vs GEN-IR 1.36 1.02-1.81 .04 1.46 0.94-2.26 .09 1.36 0.94-1.99 .11
CI, confidence interval; VGR, very good risk.
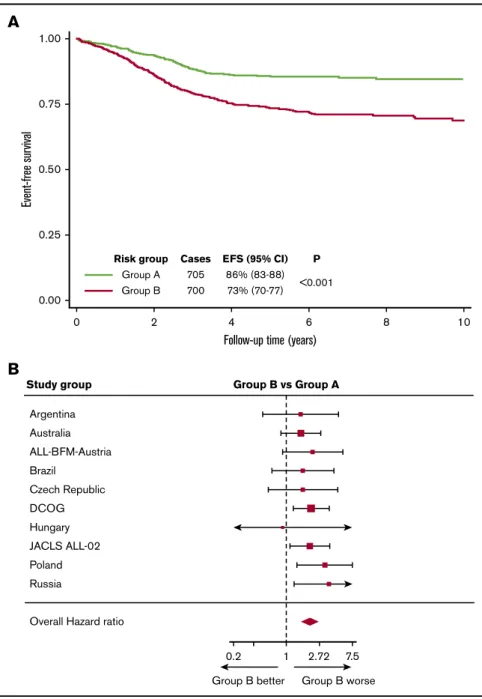
CYTO-IR/CNA-PR (P5.28). In our previous study, we combined CYTO-IR/CNA-IR and CYTO-IR/CNA-PR patients (group B) and compared their outcome to CYTO-IR/CNA-GR (group A).18 Replicating this analysis in the iBFM cohort revealed that group B patients had a significantly inferior EFS at 5 years (P , .001, Figure 5A) and were twice as likely to have an adverse event as group A patients (hazard ratio, 2.09; 95% CI, 1.62-2.69;P,.001).
No evidence of heterogeneity was observed across the 12 study groups or across the 2 main protocol types (MRD adapted and non–MRD adapted) (Figure 5B).
There was no evidence of outcome heterogeneity by CNA profile among patients with HR cytogenetics (ie, CYTO-HR) (58% [46-68]
vs 52% [38-63] vs 46% [27-63],P5.55, CNA-GR vs CNA-IR vs CNA-PR, respectively) (Figure 4A).
A revised genetic risk classification for BCP-ALL Visual inspection of the EFS curves of the 9 subgroups, which resulted from integrating the UKALL-CNA and cytogenetic subgroups (Figure 4A), revealed the presence of 4 discrete ge- netic risk groups: GEN-VGR, GEN-GR, GEN-IR, and GEN-PR (Figure 4B). These groups comprised 33%, 36%, 26% and 6% cases, respectively, and had significantly different outcomes (Figure 4C). Patients in the GEN-VGR group, which comprised patients with both GR cytogenetics and GR CNA features, had an excellent EFS rate, which was significantly better than the EFS of the remaining patients in the CYTO-GR group and the patients in the CYTO-IR/CNA-IR group (GEN-GR). Thus, patients in the re- vised GEN-GR group had a 68% higher risk of an event compared with those patients in GEN-VGR group (Table 1). In contrast, patients categorized in the GEN-IR group (composed mainly of CYTO-IR patients who have a CNA-GR/IR profiles [91%] and CYTO-GR patients who have CNA-PR profiles [9%]) had an EFS rate of 73% (70% to 77%). This meant that GEN-IR patients were twice as likely to suffer an event compared with GEN-GR patients
(Table 1). Patients in the GEN-PR group, comprised solely of those patients with HR cytogenetics, were almost twice as likely to have an event than GEN-IR patients (Table 1). Overall, there was little evidence for heterogeneity across the participating study groups (supplemental Table 4). However, there was mild heterogeneity for the GEN-PR vs GEN-IR comparison (I2537%), but this was likely driven by small numbers. When we assessed heterogeneity by protocol type (MRD adapted or non–MRD adapted), we noted that the difference between the GEN-VGR and GEN-GR groups was only seen for patients treated on protocols that were non–MRD adapted (Table 1). This revised genetic classification was validated in the original UK trial data- sets (supplemental Figure 6; supplemental Table 3). Consistent with the heterogeneity observed in the iBFM cohort, there was no difference between the GEN-VGR and GEN-GR subgroups in UKALL2003 (supplemental Figure 6B), which used MRD to adapt therapy, compared with UKALL97/99 (supplemental Figure 6A), which did not use MRD. Overall, adjusting for the effect of treatment did not alter the prognostic impact of the revised genetic classifi- cation (Table 1).
Discussion
The primary objective of this validation study was to assess whether our previously defined UKALL-CNA classifier18 was prognostic in non-UK treatment protocols. The results of our analysis clearly demonstrated that the UKALL-CNA profile was indeed prognostic across a range of treatment protocols used by 12 different study groups (supplemental Figure 1). The hazard ratios, which measure the relative risk of an event among the 3 CNA risk groups, derived from the iBFM cohort were remarkably similar to those derived from the 2 original cohorts. The hazard ratios for CNA-GR vs CNA-IR in ALL97 and UKALL2003 were 0.48 (95% CI, 0.40-0.57;P,.001) and 0.50 (95% CI, 0.40-0.64;P,.001), respectively. In addition, the hazard ratios for CNA-PR vs CNA-IR were 1.43 (95% CI, 1.12-1.82;
1.00
0.75
0.50
0.25
0.00
0 2 4
Follow-up time (years)
Event-free survival
6 8 10
0.001 P GEN-GR
Risk group
GEN-PR
EFS (95% CI) 88% (86-89) 69% (66-72) Cases
2157 884
A
Argentina Australia ALL-BFM-Austria Brazil
Czech Republic DCOG Hungary JACLS ALL-02 Sweden Poland Russia
Study group GEN-PR vs GEN-GR
Overall Hazard ratio MRD adapted Not MRD adapted
0.37 GEN-PR
better
GEN-PR worse 1 2.72 10
B
Figure 3.Outcome of 3239 patients in the iBFM cohort stratified by the original genetic risk group.(A-B) Kaplan-Meier survival curves (A) and forest plot (B) depicting the hazard ratio and 95% confidence interval from univariate Cox regression models comparing the EFS for GEN-PR vs GEN-GR. Patients in the Israeli National Study were excluded from the forest plot, as no event occurred in the GEN-GR group.
P = .004) and 1.44 (95% CI, 1.04-1.99; P = .03), respectively.
Moreover, we demonstrated that the UKALL-CNA classifier provides relevant prognostic information within both MRD-adapted and non–MRD-adapted protocols (supplemental Figure 3). Pediatric ALL protocols do not vary greatly in the core chemotherapeutic drugs used or in the proportion of patients that receive a stem cell transplant. However, they do differ in terms of risk stratification, drug dosing, and scheduling. The study groups involved in this meta- analysis span a wide range of countries across 4 continents and 18-year treatment period. Despite this extensive variation, the prognostic relevance of the UKALL-CNA classifier was consistent across different protocols and treatment risk groups (Table 1).
Therefore, we conclude that the UKALL-CNA classifier is a robust tool for defining prognostic risk groups in pediatric BCP-ALL.
In addition to validating the UKALL-CNA classifier as a standalone tool, we also investigated how it integrated with our published cytogenetic risk groups.3In our previous study, we showed that the UKALL-CNA classifier did not add prognostic information to the CYTO-GR or CYTO-HR groups. The results of this much
larger meta-analysis confirmed that patients in the CYTO-HR group had a poor outcome irrespective of CNAs. However, in contrast to the original study, we found significant outcome heterogeneity by CNA profile among CYTO-GR patients (supple- mental Table 2). The explanations for such a difference include treatment period, screening strategies, and patient numbers.
However, given that the differences between CNA-GR and CNA- IR were confined to non–MRD-adapted protocols, which were generally from earlier time periods, it suggested that the difference might have been caused by the iBFM cohort spanning a longer treatment period compared with the original study (.20 vs,15 years). We also observed a significantly inferior outcome for CYTO-GR/CNA-PR patients compared with CYTO-GR/CNA-IR patients (supplemental Table 2). Interestingly, this prognostic effect was stronger among patients treated on MRD-adapted protocols, supporting the notion that integrating MRD and ge- netics improves risk prediction.24
We also validated the prognostic utility of the 2-tier genetic classi- fication proposed in the UK study18(Figure 3). The large number of
B
Cytogenetic Risk
CYTO-GR
CNA-GR
UKALL-CNA Risk
CNA-IR
CNA-PR GEN-IR GEN-GR GEN-VGR
CYTO-IR
GEN-GR (Group A)
GEN-IR (Group B)
GEN-IR (Group B)
CYTO-HR
GEN-PR
GEN-PR
GEN-PR
C
GEN-VGR 1000
0.001
0.001
0.001 P EFS (95% Cl) Cases
Risk group
91% (89-93) 86% (83-88) 73% (70-77) 54% (46-61) 1080
777 184 GEN-GR
GEN-IR GEN-PR 1.00
0.75
0.50
0.25
0.00
0 2 4 6
Follow-up time (years)
8 10
Event-free survival
1.00
A
0.75
0.50
0.25
0.00 0
CYTO-GR/CNA-GR (1000) CYTO-GR/CNA-IR (375) CYTO-GR/CNA-PR (77) CYTO-IR/CNA-PR (159) CYTO-HR/CNA-PR (34) CYTO-IR/CNA-IR (541)
CYTO-HR/CNA-IR (69) CYTO-IR/CNA-GR (705)
CYTO-HR/CNA-GR (81)
2 4
Follow-up time (years)
Event-free survival
6 8 10
Figure 4.Integration of cytogenetic and CNA subgroups using the 3239 patients in the iBFM cohort reveals a new genetic risk classification.(A) EFS of the 9 subgroups derived from cross-tabulating the 3 cytogenetic and 3 CNA risk groups. (B) Visualized inspection of these curves reveals 4 overall genetic risk groups. (C) EFS of the revised genetic risk groups, which are significantly different from one another.
patients collected enabled us to integrate cytogenetics with the UKALL-CNA classifier in more depth, which defined 4 genetic risk groups (Figure 4). The original GEN-GR group could be split into VGR, GR, and IR groups, while the original GEN-PR group can be divided into an IR and PR groups. There was little heterogeneity across these revised risk groups by study group (supplemen- tal Table 4). The mild heterogeneity observed for the GEN-PR vs GEN-IR comparison could be explained by the incomplete screening for HR cytogenetic abnormalities in some study groups and also by treatment differences, which are more pronounced for HR patients. There was significant heterogeneity comparing the outcome of GEN-VGR vs GEN-GR patients by protocol type, such that the improved outcome for GEN-VGR patients was not observed in MRD-adapted protocols, including UKALL2003 (supplemental Figure 6). This finding is consistent with our observation
that within the CYTO-GR group, only CNA-GR patients treated on a non–MRD-adapted protocol have a superior outcome to CYTO-GR/CNA-IR patients (supplemental Table 2).
Our study has a number of strengths but also some limitations.
The major strengths are the number of cases collected and breadth of contributing studies, including protocols that used MRD to adapt treatment intensity. These 2 factors enabled us to validate the UKALL-CNA classifier across a heterogeneous collec- tion of protocols to confirm that its prognostic impact is robust.
However, as we collected data from so many study groups, we were not able to collect and analyze the raw MLPA data. It is conceiv- able that there was variation in the calling of deletions between countries. Although there was variation in the frequency of deletions across the 12 study groups (supplemental Figure 1) as well as between the iBFM cohort and the original discovery cohort (supplemental Argentina
Study group Group B vs Group A
Australia ALL-BFM-Austria Brazil
Czech Republic DCOG Hungary JACLS ALL-02 Poland Russia
Overall Hazard ratio
0.2 1 2.72 7.5
Group B better Group B worse
B A
1.00
0.75
0.50
Event-free survival
0.25
0.00
0 2
Risk group Cases EFS (95% CI) P Group A 705 86% (83-88)
<0.001 Group B 700 73% (70-77)
4 6 8 10
Follow-up time (years)
Figure 5.Outcome of 1405 patients in the iBFM cohort with IR cytogenetics classified according to their CNA profile.(A-B) Kaplan-Meier survival curves (A) and forest plot (B) depicting the hazard ratio and 95% confidence interval from univariate Cox regression models comparing the EFS for group B (CYTO-IR/CNA-IR and CYTO-IR/CNA-PR) vs group A (CYTO-IR/CNA-GR). Patients in the Israeli National and Sweden studies were excluded from the forest plot, as no event occurred in group B.
Table 3), it was not large, and there was no evidence of systematic miscalling. Each study group followed the manufacturer’s guidelines, called deletions according to the definition in the original study, and mostly had experience of.100 MLPA tests. Discussions with the contributing authors revealed only one significant area of variation between groups, which was the calling of single probe loss. In line with our original study, we did not consider single probe loss as a deletion. However, this is an important question that must be addressed when prospectively calling the CNA profile in future studies. The main limitation of this meta-analysis was the reliance on cytogenetic data derived from different testing strategies. Screening for key prognostic chromosomal abnormalities, particularly those associated with HR disease (eg, iAMP21), was not systemically performed across study groups, which is in contrast to the original UK study. Importantly, this did not affect the primary objective of validating the UKALL-CNA classifier. We were careful to only include patients in the B-other/CYTO-IR subgroups who had tested negative for the most prevalent chromosomal abnormalities, so the number of misclassified cases is likely to be small. We recognize that exclusion of cases that had not been fully tested generated relatively large B-other subgroups. However, because none of our analyses were sensitive to the relative size of the 3 cytogenetic risk groups, this did not impact the validity of our results. Although we did not have individual patient MRD data, we validated the classifiers by examining their effect in MRD adapted and non- adapted trials separately as well as by stratifying by treatment risk group. Both the UKALL-CNA and genetic classifiers were re- markably stable highlighting the added benefit in MRD driven protocols. The reduction in hazard ratio observed when we compared GEN-PR and GEN-IR patients adjusting for treatment (Table 1) is likely to be driven by HR patients receiving specific interventions (eg, transplant).
The validation of the UKALL-CNA classifier confirms its wide- spread clinical utility. Even though it is based on the 8 most prevalent CNAs, it is conceivable that additional CNAs or profiles could define additional information. Indeed the German and Italian study groups have recently published a CNA profile termed IKZF1plus.16Patients are classified as IKZF1plusif they harbor an IKZF1 deletion plus a deletion involving CDKN2A/B,PAX5, or PAR1, unless they have a concurrent ERG deletion. The fre- quency of IKZF1plusis;6% among BCP-ALL patients, and it is associated with a poor outcome in MRD-positive patients. Both profiles highlight the prognostic importance of CNA in predicting outcome in pediatric ALL. Moreover, there is a great deal of similarity between the definition of IKZF1plus and the profiles classified into the UKALL-CNA-PR group. While IKZF1plus de- fines a small group of PR patients and is MRD dependent, the UKALL-CNA classifier applies to all patients and defines 3 risk groups that are prognostic even in MRD-adapted protocols.
One of the major advantages of the UKALL-CNA classifier is the ability to subdivide the CYTO-IR cohort into subgroups with sig- nificantly different outcomes (Figure 5). Importantly, and confirming the findings of our original study, CYTO-IR/CNA-GR patients have an outcome very similar to that of CYTO-GR patients. We have recently shown that patients with both GR genetics and rapid disease clearance have a very low risk of relapse.8,24 These observations raise the possibility of defining a very large subset of patients, which could be considered for treatment deescalation to avoid future long-term toxicity.
In conclusion, we have validated the prognostic impact of the UKALL-CNA classifier using a cohort of 3239 patients treated on 16 trials including MRD-adapted protocols. This study adds to the body of evidence that supports the prognostic effect of secondary abnormalities in ALL. The integration of CNA and cytogenetic risk group proves the context-dependent nature of this effect and enables the definition of clinically relevant genetic risk groups. We propose that these data support the use of the UKALL-CNA classifier in future risk-stratification algorithms.
Acknowledgments
The authors thank the following people for assistance in producing and collating data: Caroline Barbieri, Thayana C. Barbosa, Pauline Dalzell, Jorge A. Digiorge, Alexander Druy, Eugenia T. Granado, Glenn Marshall, Tallita Meciany, and Anthea Ng.
This study was supported by Bloodwise (A.V.M. and C.J.H.), the Bloodwise Childhood Cell Bank (A.V.M. and C.J.H.), the Anniversary Fund of the Oesterreichische Nationalbank (OeNB 14133) (K.N.), Brazilian National Council for Scientific and Technological Develop- ment (CNPq) (PQ-2017#305529/2017-0) and Fundacao Carlos Chagas Filho de Amparo a Pesquisa do Estado do Rio de Janeiro (E_26/201.539/2014 and E_26/203.214/2017) (M.E.), Polish Ministry of Science and Higher Education“Diamond Grant”(DI2012017042) (M.B.), National Center of Research and Development (NCBiR project LIDER 031/635/l-5/13/NCBR/2014) (A.P.) (NCBiR project STRATEGMED3/304586/5/2017 PersonALL (W.M.), Grants for Clinical Cancer Research from the Ministry of Health, Labour and Welfare of Japan (H14-Koka (Gan)-031, H15-Koka (Gan)-024, H16- GanRinsho-004, H17-GanRinsho-004), Ministry of Health of the Czech Republic (grant 16-32568A) and Ministry of Education, Youth and Sports of the Czech Republic (NPU I LO1604) (E.F. and J.T.), the Israel Cancer Association (S.E. and M.J.), the Netherlands Organisation for Scientific Research, the Dutch Cancer Society, the Kika Foundation and the Pediatric Oncology Foundation Rotterdam, the National Health and Medical Research Council Australia and Cancer Council NSW (R.S. and L.D.P.), and CNPq#301594/2015-5 (M.S.P.-d.-O.)
Authorship
Contribution: A.V.M. and A.E. conceived and designed the study;
L.H., A.E., C.S., G.B., M.L.d.B., J.M.B., M.B., S.E., M.E., L.F., M.S.F., E.F., K.H., T.I., M.J., R.P.K., W.M., K.N., I.I. ¨O., I.H.,H.P., P.R., S.S., R.S., J.T., G.T., N.V., M.Y., A.V., and A.V.M collected and assembled the data; L.H., A.E., and A.V.M. analyzed and interpreted the data;
C.J.H. and A.V.M. provided financial and administrative support;
C.N.A., A.A., L.D.P., M.M.H., I.H., G.K., A.P., R.P., M.S.P.-d.-O., J.S., and A.V. provisioned the study materials and patients; L.H., A.V.M., and A.E. wrote the manuscript; and all authors approved the final manuscript.
Conflict-of-interest disclosure: The authors declare no compet- ing financial interests.
A complete list of the members of the International BFM Study Group appears in the supplemental appendix.
ORCID profiles: M.B., 0000-0003-3804-7042; M.E., 0000-0003- 2337-8420; M.S.P.-d.-O., 0000-0002-1507-004X; S.S., 0000-0002- 0179-0628; A.V.M., 0000-0002-9781-6107.
Correspondence: Anthony V. Moorman, Leukaemia Research Cytogenetics Group, Wolfson Childhood Cancer Research Centre, Northern Institute for Cancer Research, Newcastle
University, Level 6, Herschel Building, Brewery Ln, Newcastle upon Tyne NE1 7RU, United Kingdom; e-mail: anthony.moorman@
newcastle.ac.uk.
References
1. Pui CH, Yang JJ, Hunger SP, et al. Childhood acute lymphoblastic leukemia: progress through collaboration.J Clin Oncol. 2015;33(27):2938-2948.
2. Bonaventure A, Harewood R, Stiller CA, et al; CONCORD Working Group. Worldwide comparison of survival from childhood leukaemia for 1995-2009, by subtype, age, and sex (CONCORD-2): a population-based study of individual data for 89 828 children from 198 registries in 53 countries.Lancet Haematol. 2017;4(5):e202-e217.
3. Moorman AV, Ensor HM, Richards SM, et al. Prognostic effect of chromosomal abnormalities in childhood B-cell precursor acute lymphoblastic leukaemia: results from the UK Medical Research Council ALL97/99 randomised trial.Lancet Oncol. 2010;11(5):429-438.
4. Moorman AV. The clinical relevance of chromosomal and genomic abnormalities in B-cell precursor acute lymphoblastic leukaemia.Blood Rev. 2012;
26(3):123-135.
5. Mullighan CG, Goorha S, Radtke I, et al. Genome-wide analysis of genetic alterations in acute lymphoblastic leukaemia.Nature. 2007;446(7137):
758-764.
6. Kuiper RP, Schoenmakers EF, van Reijmersdal SV, et al. High-resolution genomic profiling of childhood ALL reveals novel recurrent genetic lesions affecting pathways involved in lymphocyte differentiation and cell cycle progression.Leukemia. 2007;21(6):1258-1266.
7. van der Veer A, Waanders E, Pieters R, et al. Independent prognostic value of BCR-ABL1-like signature and IKZF1 deletion, but not high CRLF2 expression, in children with B-cell precursor ALL.Blood. 2013;122(15):2622-2629.
8. Sutton R, Venn NC, Law T, et al. A risk score including microdeletions improves relapse prediction for standard and medium risk precursor B-cell acute lymphoblastic leukaemia in children.Br J Haematol. 2018;180(4):550-562.
9. D ¨orge P, Meissner B, Zimmermann M, et al. IKZF1 deletion is an independent predictor of outcome in pediatric acute lymphoblastic leukemia treated according to the ALL-BFM 2000 protocol.Haematologica. 2013;98(3):428-432.
10. Kuiper RP, Waanders E, van der Velden VH, et al. IKZF1 deletions predict relapse in uniformly treated pediatric precursor B-ALL.Leukemia. 2010;24(7):
1258-1264.
11. Clappier E, Grardel N, Bakkus M, et al; European Organisation for Research and Treatment of Cancer, Children’s Leukemia Group (EORTC-CLG). IKZF1 deletion is an independent prognostic marker in childhood B-cell precursor acute lymphoblastic leukemia, and distinguishes patients benefiting from pulses during maintenance therapy: results of the EORTC Children’s Leukemia Group study 58951.Leukemia. 2015;29(11):2154-2161.
12. Palmi C, Vendramini E, Silvestri D, et al. Poor prognosis for P2RY8-CRLF2 fusion but not for CRLF2 over-expression in children with intermediate risk B-cell precursor acute lymphoblastic leukemia.Leukemia. 2012;26(10):2245-2253.
13. Cario G, Zimmermann M, Romey R, et al. Presence of the P2RY8-CRLF2 rearrangement is associated with a poor prognosis in non-high-risk precursor B-cell acute lymphoblastic leukemia in children treated according to the ALL-BFM 2000 protocol.Blood. 2010;115(26):5393-5397.
14. Schwab C, Nebral K, Chilton L, et al. Intragenic amplification ofPAX5: a novel subgroup in B-cell precursor acute lymphoblastic leukemia?Blood Adv.
2017;1(19):1473-1477.
15. Scheijen B, Boer JM, Marke R, et al. Tumor suppressors BTG1 and IKZF1 cooperate during mouse leukemia development and increase relapse risk in B-cell precursor acute lymphoblastic leukemia patients.Haematologica. 2017;102(3):541-551.
16. Stanulla M, Dagdan E, Zaliova M, et al; International BFM Study Group. IKZF1plusdefines a new minimal residual disease-dependent very-poor prognostic profile in pediatric B-Cell precursor acute lymphoblastic leukemia.J Clin Oncol. 2018;36(12):1240-1249.
17. Clappier E, Auclerc MF, Rapion J, et al. An intragenic ERG deletion is a marker of an oncogenic subtype of B-cell precursor acute lymphoblastic leukemia with a favorable outcome despite frequent IKZF1 deletions.Leukemia. 2014;28(1):70-77.
18. Moorman AV, Enshaei A, Schwab C, et al. A novel integrated cytogenetic and genomic classification refines risk stratification in pediatric acute lymphoblastic leukemia.Blood. 2014;124(9):1434-1444.
19. Higgins JP, Thompson SG. Quantifying heterogeneity in a meta-analysis.Stat Med. 2002;21(11):1539-1558.
20. Vora A, Goulden N, Mitchell C, et al. Augmented post-remission therapy for a minimal residual disease-defined high-risk subgroup of children and young people with clinical standard-risk and intermediate-risk acute lymphoblastic leukaemia (UKALL 2003): a randomised controlled trial.Lancet Oncol. 2014;
15(8):809-818.
21. Vora A, Goulden N, Wade R, et al. Treatment reduction for children and young adults with low-risk acute lymphoblastic leukaemia defined by minimal residual disease (UKALL 2003): a randomised controlled trial.Lancet Oncol. 2013;14(3):199-209.
22. Marshall GM, Dalla Pozza L, Sutton R, et al. High-risk childhood acute lymphoblastic leukemia in first remission treated with novel intensive chemotherapy and allogeneic transplantation.Leukemia. 2013;27(7):1497-1503.
23. Roberts KG, Pei D, Campana D, et al. Outcomes of children with BCR-ABL1–like acute lymphoblastic leukemia treated with risk-directed therapy based on the levels of minimal residual disease.J Clin Oncol. 2014;32(27):3012-3020.
24. O’Connor D, Enshaei A, Bartram J, et al. Genotype-specific minimal residual disease interpretation improves stratification in pediatric acute lymphoblastic leukemia.J Clin Oncol. 2018;36(1):34-43.