ERPs differentiate the sensitivity to statistical probabilities and the learning of sequential structures during procedural learning
Andrea Kóbor a, Ádám Takács b, Zsófia Kardos a,c, Karolina Janacsek d,b, Kata Horváth e,b,d, Valéria Csépe a,c, Dezso Nemeth d,b
a: Brain Imaging Centre, Research Centre for Natural Sciences, Hungarian Academy of Sciences, Magyar tudósok körútja 2, H–1117, Budapest, Hungary
b: Institute of Psychology, Eötvös Loránd University, Izabella utca 46, H–1064, Budapest, Hungary
c: Department of Cognitive Science, Budapest University of Technology and Economics, Egry József utca 1, H-1111, Budapest, Hungary
d: MTA-ELTE NAP B Brain, Memory and Language Research Group, Institute of Cognitive Neuroscience and Psychology, Research Centre for Natural Sciences, Hungarian Academy of Sciences, Magyar tudósok körútja 2, H–1117, Budapest, Hungary
e: Doctoral School of Psychology, Eötvös Loránd University, Izabella utca 46, H–1064, Budapest, Hungary
Author Note
Correspondence and requests for material should be addressed to Dezso Nemeth, Institute of Psychology, Eötvös Loránd University, Izabella utca 46., H–1064, Budapest, Hungary. Telephone: +36703189107. E-mail: nemeth@nemethlab.com.
Manuscript of the article that appeared in:
Biological Psychology 2018; Vol. 135: 180–193 DOI: 10.1016/j.biopsycho.2018.04.001
Abstract
Procedural learningfacilitates the efficient processing of complex environmental stimuli and contributes to the acquisition of automatic behaviors. Although earlier findings suggest different temporal trajectories of the multiple learning processes within procedural learning, this has not been clarified at the level of neurocognitive correlates. Therefore, we investigated whether two prominent learning processes – statistical learning and sequence learning – can be distinguished using event-related brain potentials (ERPs) within the same experimental setting. Healthy young adults (N = 40) performed the Alternating Serial Reaction Time task while RTs and ERPs were measured time-locked to the onset of the task’s stimuli. Both RT and N2 effects reflected the rapid acquisition of statistical probabilities. At the same time, these effects reflected the gradual learning of sequential structures. The amplitude change of the P3 reflected only gradual sequence learning. The P1 component was sensitive to both learning processes, which did not change as the task progressed. Our results altogether indicate that statistical learning and sequence learning develop differently at the level of both ERPs and overt responses. These findings could provide insight to the dynamic change of multiple parallel learning processes that occur during procedural memory formation.
Keywords: N2, P1, P3, procedural learning, sequence learning, statistical learning
Introduction
Procedural learning enables us to extract complex probabilistic regularities embedded in the environment. It underlies various perceptual, cognitive, and motor processes in the human brain (Armstrong, Frost, & Christiansen, 2017; Aslin, 2017; Fiser & Aslin, 2002; Saffran, Aslin, & Newport, 1996; Turk-Browne, Scholl, Johnson, & Chun, 2010). Therefore, through extensive practice, procedural learning contributes to the acquisition of automatic behaviors, such as skills and habits (Hallgato, Gyori-Dani, Pekar, Janacsek, & Nemeth, 2013; Kaufman et al., 2010; Romano, Howard, & Howard, 2010; Ullman, 2004). Learning of probabilistic regularities requires the orchestrated work of multiple parallel learning processes (Bays, Turk- Browne, & Seitz, 2016; Daltrozzo & Conway, 2014; Siegelman, Bogaerts, Christiansen, &
Frost, 2017; Thiessen, Kronstein, & Hufnagle, 2013). Among these processes, the differential contribution of statistical and sequence learning to overall procedural learning performance has recently been measured with overt behavioral responses in skill learning tasks (Nemeth, Janacsek, & Fiser, 2013; Simor et al., 2017). However, to date, the temporal dynamics of their neurocognitive correlates resulting in brain responses measured over the human scalp have not yet been clarified. Therefore, in the present study, we investigated whether statistical learning and the learning of sequential structures can be distinguished using event-related brain potentials (ERPs) during the acquisition of complex probabilistic regularities in a modified perceptual-motor procedural learning task.
From a broader perspective, statistical learning can be defined as a multi-faceted individual ability to pick up transitional as well as distributional statistics from the sensory environment, when contingencies are non-adjacent and extracted across time (Siegelman et al., 2017). The present study narrows down the concept of statistical learning by regarding it as only one of the processes that facilitate the acquisition of the underlying structure
characterizing a certain temporal sequence of stimuli. From a sequence of stimuli, different
types of input structures could be acquired, such as fixed sequences, statistical patterns, and hierarchical structures (Conway & Christiansen, 2001; Daltrozzo & Conway, 2014). In our approach, the representations of one or more of these input structures could be encoded and manipulated not only by statistical learning in the narrow sense but also by another process that we term as sequence learning. Particularly, we distinguish statistical and sequence learning by the acquisition of different types of input structures as follows.
In the present experimental design, statistical learning refers to the acquisition of shorter-range relations among visual stimuli that are primarily based on frequency or probability (i.e., differentiating between more frequent and less frequent stimulus chunks [e.g., pairs or triplets of stimuli]). In contrast, sequence learning refers to the acquisition of a series consisting of usually 5-12 stimuli (longer-range relations) that repeatedly occur in the same order (Conway & Christiansen, 2001). The order can be presented without embedded noise (without random elements), which results in deterministic or fixed sequences, or with some embedded noise, which results in probabilistic sequences (J. H. Howard, Jr. & Howard, 1997). The present experimental design used the latter, probabilistic sequences. From a theoretical perspective, however, it is important to note that at the level of transitional
probabilities, statistical and sequence learning could be considered as similar (see later in the Introduction).
Outside the laboratory, in most of the day-to-day situations, both forms of learning might work in parallel. For instance, learning the phonotactical constraints within words of a given language involves detecting and using transitional statistics, i.e., statistical learning. At the same time, when understanding a sentence, humans use the predictive nature of
hierarchically organized phrases (Conway & Christiansen, 2001) and that of the semantic context. This involves the operation of sequence learning over longer-range ordered relations, such as regularly occurring linguistic and semantic patterns.
Current findings on procedural learning indicate not only that statistical and sequence learning follow different developmental trajectories (Nemeth, Janacsek, & Fiser, 2013) but also that while sequence learning is a gradual process, transitional statistics are acquired rapidly and their representations remain stable, irrespective of further training (Simor et al., 2017). It was also shown that slow oscillatory activity in the delta and theta frequency ranges during daytime sleep were predictive of further improvements in sequence learning but not in statistical learning. In addition, the two learning processes were associated with different spindle parameters (Simor et al., 2017). Attempts to separate parallel learning processes in the procedural learning domain have been successful using functional magnetic resonance
imaging (Rose, Haider, Salari, & Büchel, 2011; Rose, Haider, Weiller, & Büchel, 2002).
While the implicit learning of a hidden sequential structure was related to the activation of the ventral perirhinal cortex, the explicit learning of fixed stimulus-response associations within the same task was related to the activation of the basal ganglia (Rose et al., 2002). The
implicit learning of statistical contingencies between perceptual features activated the bilateral hippocampus, while that of the motor contingencies activated the basal ganglia and the motor cortex but not the hippocampus (Rose et al., 2011). Nevertheless, by what means the
neurocognitive correlates of the extraction of different statistics embedded in the same information stream change over a time scale with higher resolution remains unclear.
Previous ERP studies on temporal statistical-sequence learning, although without separating multiple learning processes and defining this concept in a wider sense than the present paper, predominantly focused on differentiating the implicit and explicit elements of this learning form. These studies used variants of the serial reaction time (SRT) task
combined with the features of the oddball paradigm. Namely, repeating deterministic sequences were presented, and the sequence was randomly violated by replacing one of its elements with a deviant stimulus (Eimer, Goschke, Schlaghecken, & Stürmer, 1996;
Ferdinand, Mecklinger, & Kray, 2008; Rüsseler, Hennighausen, Münte, & Rösler, 2003;
Rüsseler & Rösler, 2000; Schlaghecken, Stürmer, & Eimer, 2000). Otherwise, random and regular sequences were generated (Fu, Bin, Dienes, Fu, & Gao, 2013; Verleger, Seitz,
Yordanova, & Kolev, 2015) or second-order conditional sequences were combined to produce standard and deviant sequence chunks (Fu et al., 2013). Thus, the applied SRT tasks did not allow to separately measure the ERP correlates of learning statistical probabilities and sequential structures.
Furthermore, previous SRT studies mainly measured the N2 and P3 components elicited by different stimulus types. The N2 component has been found to peak between 200 and 450 ms after stimulus onset over the frontocentral electrode sites. Although
subcomponents of the N2 can be differentiated, their distinctiveness varies across paradigms and studies (Kopp, Rist, & Mattler, 1996). Earlier SRT studies have focused on the deviance- related N2, which could reflect the mismatch between the predicted and the actual event (Folstein & van Petten, 2008). The N2 has usually been followed by the more parietally distributed P3 component, which has typically peaked between 300 and 500 ms post-stimulus, so that it could have reflected the conscious processing of action-related stimuli and the formation of decisions (Ullsperger, Fischer, Nigbur, & Endrass, 2014) among its many functions (Polich, 2007).
The sensitivity and specificity of the N2 and P3 components to sequence learning were not entirely consistent in the previous SRT studies, focusing primarily on associations
between these ERP components and the acquired explicit knowledge about the sequence.
While some studies found that the N2 was enhanced for deviant stimuli irrespective of the explicitness of acquisition (Eimer et al., 1996; Ferdinand et al., 2008; Fu et al., 2013), others found that the N2 effect was related only to the presence of explicit knowledge (Rüsseler et al., 2003; Rüsseler & Rösler, 2000; Schlaghecken et al., 2000). Meanwhile, it was also shown
that although the N2 effect was observable both in the implicit and explicit groups, this effect was larger or developed faster in the explicit group (Eimer et al., 1996; Ferdinand et al., 2008). In contrast, another study found that an N2-like frontocentral negativity was larger for the random than for the regular sequence only in the group showing fast sequence-specific learning without explicit knowledge (Verleger et al., 2015). Therefore, it could be assumed that the N2 reflects a culmination of implicit and explicit processes during sequence learning, and its amplitude change might vary as a function of the applied experimental design.
Regarding the later emerging P3, it was shown to be a marker of explicit knowledge in several SRT studies (Ferdinand et al., 2008; Fu et al., 2013; Rüsseler et al., 2003; Rüsseler & Rösler, 2000; Schlaghecken et al., 2000; Verleger et al., 2015).
Beyond the implicit and explicit elements of the SRT task, ERP correlates of predictive processes in statistical-sequence learning were more directly investigated using variants of the oddball paradigm (Daltrozzo & Conway, 2014). In the visual domain, in addition to the standard (frequent) stimuli, different deviants were presented: predictors and targets. Participants were required to respond to the targets, which, unknown to them, were predicted by high, low, and zero probability according to the type of the preceding deviant stimulus. It was shown that after learning the transitional probabilities between predictor- target pairs, the high-probability predictors elicited the largest P3 component (Daltrozzo et al., 2017; Jost, Conway, Purdy, & Hendricks, 2011; Jost, Conway, Purdy, Walk, & Hendricks, 2015). Similarly, predictable target motion elicited a larger P3 than unpredictable target motion, which effect was lacking for standard stimuli (Baldwin & Kutas, 1997). Indicators of statistical-sequence learning were also shown in deterministic visual sequences, where the amplitude of the P3 for a predictive S1 stimulus increased over the task, while it decreased for the upcoming S2 predicted by the S1 (Rose, Verleger, & Wascher, 2001).
Relatedly, in different modalities, studies on contextual processing used short sequences of standard stimuli (informative context) that predicted a target stimulus and random sequences (non-informative context) that preceded random targets. These studies found a P3 amplitude increase for the last stimulus of the predictive sequence vs. random sequence and a “context positivity” (a variant of the N2 component) for predicted vs. random targets (for a review, see Fogelson, 2015). In the 200-250 ms time window, an N2 amplitude attenuation was observed for predicted vs. random targets, indicating that the processing of predicted targets required less attentional resources (e.g., Fogelson, Peled, Marmor,
Fernandez-del-Olmo, & Klein, 2014). Importantly, in most of these studies, the predictive sequence was explicitly shown to participants and they were asked to pay attention to this sequence; however, although in a lesser extent, the P3 amplitude modulation was also observed in the implicit version of the task (Fogelson & Fernandez-del-Olmo, 2013).
The P3 component has also been in the focus of interest in studies investigating the role of implicit and explicit knowledge and the enhancing effect of explicit training on auditory statistical learning (Batterink, Reber, Neville, & Paller, 2015; Batterink, Reber, &
Paller, 2015). After being exposed to a continuous stream of repeating nonsense words, participants responded to target syllables occurring in a similar speech stream. Although the P3 amplitude scaled with the predictability of the target syllable indicating a rapid and incremental statistical learning process, those receiving explicit pretraining on the nonsense words showed anticipatory and more effortful processing for predictable targets.
While ERP evidence from the “motor end” of the perceptual-motor chain is also available on statistical-sequence learning (Eimer et al., 1996; Rose et al., 2001; Rüsseler &
Rösler, 2000), amplitude changes in components related to the different stages of perceptual processing and attentional selection have rarely been considered (but see Beaulieu, Bourassa, Brisson, Jolicoeur, & De Beaumont, 2014). However, it is reasonable to test at which
processing stage the effect of detecting statistical contingencies occurs (cf. Fogelson, 2015).
Several studies indicated that the P1 component – a visually evoked positive-going brain potential peaking between approx. 70-130 ms after stimulus onset with a maximum amplitude over the occipital electrodes sites – was modulated by spatial attention (Luck, Heinze,
Mangun, & Hillyard, 1990; Luck et al., 1994; Martinez et al., 1999). Considering visual prediction tasks manipulating the transient occlusion of moving objects, spatial expectations increased the P1 amplitude, and additional P1 amplitude enhancement was observed for combined spatial and temporal expectations (Doherty, Rao, Mesulam, & Nobre, 2005). When strong and weak temporal expectations were generated, the P1 amplitude was enhanced for valid, rhythmic events compared to neutral, arrhythmic events (Rohenkohl & Nobre, 2011).
Accordingly, we propose that implicit and/or explicit exposure to different statistical contingencies could alter selective attention and thereby modulate the early stage of visual stimulus processing during statistical and sequence learning.
To the best of our knowledge, no studies have tracked the temporal dynamics of learning statistical probabilities (frequency information) as well as sequential structures (order information) within the same experimental design to date using ERPs. Accordingly, we aimed to investigate the behavioral and ERP correlates of these learning processes in a modified version of the SRT task. The Alternating Serial Reaction Time (ASRT) task is a unique tool to investigate statistical and sequence learning within the same experiment (J. H. Howard, Jr. &
Howard, 1997). In this perceptual-motor four-choice RT task, participants are asked to respond to visual stimuli appearing on a screen. There is an alternating sequential regularity between non-adjacent trials that results in some chunks of stimuli being more frequent than others (see Fig. 1) and enables us to measure the acquisition of both order and frequency information. Particularly, when acquiring frequency information (statistical learning), a 2nd order probabilistic sequence should be learned, in which there are always one probable
continuation and some less probable continuations for the first two elements of a given three- element stimulus chunk (Szegedi-Hallgató et al., 2017). When acquiring order information (sequence learning), the 2nd order transitional probability is equal to one; namely, consecutive elements in the sequence could be predicted with 100% certainty from the previous sequence element. The learning trajectories can be tracked by how different behavioral indices, such as RT and accuracy, change over the course of the task (D. V. Howard et al., 2004).While statistical learning develops fast (already within one training session), sequential knowledge in this task develops more slowly if participants are not given explicit cues (i.e., it requires about 4-5 days of practice, see J. H. Howard, Jr. & Howard, 1997). Therefore, we decided to use a cued version of the task that speeds up learning (Nemeth, Janacsek, & Fiser, 2013;
Simor et al., 2017) and thus enables us to simultaneously measure RTs and ERPs associated with statistical and sequence learning within one training session.
Based on previous findings, we hypothesize that at the behavioral level, statistical and sequence learning could be distinguished in the cued ASRT task (J. H. Howard, Jr. &
Howard, 1997; Nemeth, Janacsek, & Fiser, 2013). While sequence learning would be a gradual process, statistical learning would be a rapid one (Simor et al., 2017). Crucially, we also expect differentiation between the two learning processes at the level of ERPs (Simor et al., 2017). Although previous studies are inconclusive about the sensitivity of the N2 and P3 components to the implicitly and explicitly learned chunks of a given sequence, we assume N2 modulation for statistical learning and N2 and P3 modulations for sequence learning, because the latter process is influenced by explicit cuing (Fu et al., 2013). We assume similar P1 modulations in both learning processes as the encoding of frequency and order information could evoke expectations about the forthcoming stimulus and influence attentional processes (Doherty et al., 2005). Although statistical and sequence learning could develop along a different trajectory at the behavioral level, this might not be true at the neurocognitive level,
since previous findings indicate that statistical-sequence learning effects could dissociate between RTs and ERPs (Eimer et al., 1996). Thus, the shape of the learning-related temporal trajectories in ERPs has yet to be explored in the present study.
Material and methods Participants
Forty-one healthy young adults took part in the experiment. One of them was excluded because of technical reasons. Therefore, 40 participants remained in the final sample (25 females). They were between 19 and 25 years (MAge = 21.4 years, SD = 1.6 years). They were undergraduate students from Budapest, Hungary (MYears of education = 14.7 years, SD = 1.5 years). Handedness was measured by the Edinburgh Handedness Inventory (Oldfield, 1971);
the Laterality Quotient (LQ) of the sample varied between -33.3 and 100 (-100 means complete left-handedness, 100 means complete right-handedness; MLQ = 68.5, SD = 28.1).
Participants had normal or corrected-to-normal vision, none of them reported a history of any neurological and/or psychiatric condition, and none of them was taking any psychoactive medication. They performed in the normal range on standard neuropsychological tests (Wisconsin Card Sorting Task [WCST; percentage of perseverative errors]: M = 12.06%, SD
= 4.22%; Digit span task: M = 5.98, SD = 1.00; Counting span task: M = 3.57, SD = 0.75;
Verbal fluency task [total number of correct items in phonemic and semantic subtasks]: M = 56.93, SD = 10.64). All participants provided written informed consent before enrolment and received payment (ca. 10 Euros) or course credit for taking part in the experiment. The study was approved by the United Ethical Review Committee for Research in Psychology (EPKEB) in Hungary and was conducted in accordance with the Declaration of Helsinki.
Stimuli, task, and procedure
Procedural learning of probabilistic regularities was measured with a cued version of the Alternating Serial Reaction Time (ASRT) task (Nemeth, Janacsek, & Fiser, 2013), which was modified to make the task suitable to reliably measure EEG and calculate ERPs. In this task, an arrow stimulus appears at the center of the screen. Participants are instructed to press a key as quickly and accurately as possible that corresponds to the spatial direction (up, down, left, or right) of the actual arrow on a Cedrus RB-530 response pad (Cedrus Corporation, San Pedro, CA).
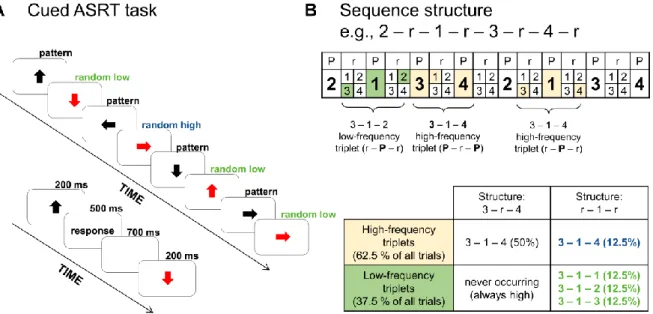
The presentation of arrow stimuli follows an eight-element sequence, within which predefined/pattern (P) and random (r) elements alternate with each other (e.g., 2 – r – 1 – r – 3 – r – 4 – r; where numbers denote the four predefined spatial directions [1 = left, 2 = up, 3 = down, 4 = right] of the arrows and rs denote randomly chosen directions out of the four possible ones; see Fig. 1A). In this cued ASRT task, the alternating sequence is marked by arrow stimuli of different colors for predefined (black arrows) and random (red arrows) elements. Participants are told that black arrows always follow a predefined sequence of spatial directions while red arrows always point into a randomly chosen spatial direction.
They are instructed to find the hidden pattern defined by the black arrows to improve their performance, thus to be faster and more accurate using this sequence information to predict the next sequence (pattern) element. However, they are not informed about the exact length of the sequence. Instruction emphasize that participants also have to respond to red arrows.
There are 24 permutations of the four possible spatial directions (e.g., 2 – r – 1 – r – 3 – r – 4 – r; 1 – r – 2 – r – 3 – r – 4 – r; 1 – r – 2 – r – 4 – r – 3 – r, etc.). However, because of the continuous presentation of the stimuli, there are only six unique permutations, i.e., the sequence of 2 – r – 1 – r – 3 – r – 4 – r is indistinguishable from 1 – r – 3 – r – 4 – r – 2 – r. In the present study, one of these six unique permutations was selected for each participant in a
pseudorandom manner (J. H. Howard, Jr., Howard, Dennis, & Yankovich, 2007; Nemeth et al., 2010).
The alternating sequence in the ASRT task makes some runs of three successive elements – henceforth referred to as triplets – more frequent than others. In the first of the examples above (sequence 2 – r – 1 – r – 3 – r – 4 – r), 2 – X – 1, 1 – X – 3, 3 – X – 4, and 4 – X – 2 triplets (X indicates the middle element of the triplet) occur often since their third elements could either be predefined or random (see Fig. 1B). However, 1 – X – 2 and 4 – X – 3 triplets occur less frequently since their third elements could only be random. The former triplet types are labeled as “high-frequency” triplets while the latter types are labeled as “low- frequency” triplets (Kóbor, Janacsek, Takács, & Nemeth, 2017; Nemeth, Janacsek, & Fiser, 2013). The terms high- and low-frequency triplets also refer to the predictability of the final element of that triplet: The third element of a high-frequency triplet is more predictable from the first element of the triplet than in the case of low-frequency triplets. Thus, the comparison of high- vs. low-frequency triplets involves 2nd order transitional probabilities. However, regarding these triplets, distributional (the frequency of the triplet) and transitional probabilities (the predictability of the triplet) completely overlap in the task.
Each stimulus (trial [arrow]) is categorized as either the third element of a high- or a low-frequency triplet, and the reaction time (RT) of the response to this stimulus is
determined. (All stimuli are categorized this way; the third element of a triplet is also a second element of the following triplet, and so on). There are 64 possible triplets in the task,
including all Pattern – random – Pattern (50%) and random – Pattern – random (50%) triplets (see Fig. 1B). Out of the 64 possible triplets, 16 are high-frequency and 48 are low-frequency ones. Particularly, in the case of high-frequency triplets, there are four possible combinations in regard to the first and last elements of the triplet with four possible directions for the middle element (e.g., for 3 – X – 4, the triplet could be 3 – 1 – 4, 3 – 2 – 4, 3 – 3 – 4, 3 – 4 –
4). In the case of low-frequency triplets, there are four possible directions for the first element of the triplet, four for the second, and only three for the third, because the fourth direction corresponds to the high-frequency triplets (i.e., 4*4*3). With respect to the unique triplets, high-frequency triplets occur five times more often than low-frequency triplets (4% [62.5% / 16] vs. 0.8% [37.5% / 48]).
Beyond this local sequence structure (i.e., triplets of different frequency), another aspect of the probabilistic structure in the ASRT task originates from the four non-adjacent elements following the predefined sequence (i.e., the sequence of pattern elements).
Accordingly, high-frequency triplets could occur as both pattern high-frequency triplets and random high-frequency ones. Particularly, because of the alternating sequence structure, all pattern trials (50%) and by chance, one-fourth of random trials (12.5%) form high-frequency triplets (altogether 62.5%). In sum, we could differentiate pattern and random high-frequency triplets as well as random low-frequency ones (occurring with an overall probability of 50%, 12.5%, and 37.5%, respectively, see Fig. 1B; but note that with respect to the unique triplets, random high-frequency triplets are five times more frequent than low-frequency ones). Note that low-frequency triplets are always random and that the terms “pattern trials” and “pattern high-frequency triplets” are interchangeable.
The timing of an experimental trial was the following. The arrow was presented at the center of the screen for 200 ms, then a blank screen was displayed until the participant gave behavioral response but no longer than 500 ms. After a fixed delay of 700 ms following the response (indicated by a blank screen again), the next trial started (Fig. 1A). In the case of an incorrect response, a blank screen and then an “X” were presented at the center of the screen for 500 ms, respectively. If no response occurred in the predefined 500 ms response window, a “!” was presented at the center of the screen for 500 ms. Thus, although participants could proceed with the trial without giving a correct response, we used these visual error signals to
strengthen the representation of different response types and to enhance learning (Gehring, Liu, Orr, & Carp, 2012).
Stimuli were presented in blocks of 85 trials. In each block, the eight-element sequence repeated 10 times after five warm-up trials consisting only of random stimuli (red arrows). After each block, explicit knowledge about the sequence was measured. Participants were instructed to continuously type the order of black arrows with the corresponding
response keys. This sequence report lasted until participants gave 12 consecutive responses (i.e., ideally, they reported the given sequence three times). Participants were not informed that they had to provide exactly 12 responses and that this series of responses could be three repetitions of the given sequence. This method allowed us to determine the duration (in term of the number of blocks) participants needed to identify the length of the sequence and to learn the sequence elements correctly as defined by consistently reporting at least 10 correct responses from that point on in the remaining blocks. We labeled this variable as the timing of the discovery of the sequence. We also scored partial knowledge of the sequence by awarding the report of each correct sequence element with one point after each block, then averaging the sum of correct elements across the 30 blocks. Henceforth, this index is referred to as sequence knowledge score. After the sequence report, participants received feedback about their mean reaction time and accuracy on sequence stimuli in the given block. The feedback lasted for 4000 ms and was followed by a delay interval while participants could have a short rest. The beginning of the next block was self-paced. Participants completed 30 blocks, thus, altogether 2550 trials were presented. The entire experimental procedure lasted about 2.5 hours, including the application of the electrode cap. The ASRT task was written in Presentation software (v. 18.1, Neurobehavioral Systems) and stimuli were displayed on a 19’’ CRT screen at a viewing distance of 125 cm.
Figure 1. Design of the experiment. (A) In the cued Alternating Serial Reaction Time (ASRT) task, an arrow stimulus appears at the center of the screen. The presentation of stimuli follows an eight-element sequence, within which pattern (P) and random (r) elements alternate with each other. Regularity is marked by different colors for pattern (black arrows) and random (red arrows) elements. The timing of an arrow trial, which was modified to make the task suitable for calculating ERPs, is presented below the sequence structure. (B) In the alternating sequence structure, numbers denote the four spatial directions (1 = left, 2 = up, 3 = down, 4 = right) of the arrows. The alternating sequence makes some runs of three consecutive elements (triplets) more frequent than others. High-frequency triplets are denoted with light orange shading and low-frequency triplets are denoted with green shading. Among high-frequency triplets, we determined pattern high-frequency (with black font in the table) and random high- frequency (with blue font in the table) triplets. Only random low-frequency triplets occurred (with green font in the table). Statistical learning contrasted the right column of the table (random low- vs. high-frequency triplets [green vs. blue]) while sequence learning contrasted the top row of the table (random vs. pattern high-frequency triplets [blue vs. black]).
EEG recording and analysis
EEG activity was recorded in an electrically shielded and acoustically attenuated, dimly lit room with 64 Ag/AgCl electrodes, placed according to the international 10–20 system mounted in an elastic cap (EasyCap), using Synamps amplifiers and Neuroscan software 4.5.
(Compumedics Neuroscan, Charlotte, NC, USA). Vertical and horizontal eye movements were recorded by electrodes attached above and below the left eye, and the left and right outer canthi. The tip of the nose was used as reference and electrode AFz was used for ground. The sampling rate was 1000 Hz and the signals were filtered online (70 Hz low-pass, 24 dB/oct).
Electrode impedance levels were kept below 10 kΩ.
Data were analyzed using BrainVision Analyzer software (Brain Products GmbH, Munich, Germany). After visual screening for major deflections and possible bad electrodes, as the first step of pre-processing, the continuous EEG data were band-pass filtered offline between 0.5 – 30 Hz (48 dB/oct) and notch filter at 50 Hz to remove additional electrical noise. Second, we corrected horizontal and vertical eye-movement artifacts and heartbeats with independent component analysis (Delorme, Sejnowski, & Makeig, 2007; Mullens et al.).
Two – four components per participant were rejected (mean = 3.2). Third, EEG data was re- referenced to the average activity of all electrodes. Fourth, the continuous EEG was
segmented in two steps as follows.
The first step involved segmentation as a function of time. Specifically, to track the temporal changes of learning processes, the EEG data were cut into six epochs, each containing five consecutive blocks of the ASRT task. This is in line with the conventional behavioral data analysis protocol of the task (see Data analysis section below), and
considering the requirements of ERP analysis, “epochwise” segmentation could still provide a good temporal resolution for investigating learning processes. The second segmentation step involved the creation of the other three experimental conditions within each epoch. Namely,
we identified pattern high-frequency, random high-frequency, and random low-frequency triplets. Importantly, only correctly responded trials with an RT greater than 0 ms were included in this step of the segmentation. Segments extended from -200 to 600 ms relative to the onset of the stimuli. Thus, altogether 18 (3*6) conditions were created.
After segmentation, as the fifth step of pre-processing, we used an automatic artifact rejection algorithm implemented in BrainVision Analyzer software to remove artifacts still present in the data after ICA corrections (see above). This algorithm rejected segments where the activity exceeded +/- 100 µV at any of the electrode sites. As the percentage of removed segments was below 35% in each condition in the entire sample (range: 0 – 32.3%), all participant’s data were included in further analysis. The mean percentage of removed segments across the conditions was 1.4% (SD = 2.5%). The mean number of retained
segments across the conditions was 104.8 (SD = 3.6; range: 26 – 193; note that random high- frequency triplets are originally rare in the ASRT task [12.5%] producing a broad range of the possibly retainable segments across the conditions). Sixth, after artifact rejection, the retained segments were baseline corrected based on the mean activity from -200 to 0 ms. Finally, these segments were averaged for pattern high-frequency, random high-frequency, and random low-frequency triplets in each of the six epochs.
In order to identify the latency ranges where ERP components might vary as a function of different learning processes, we visually inspected the grand average ERP
waveforms calculated separately for each condition (pattern and random high-frequency, low- frequency triplets) as a function of time (epoch) as well as averaged for the entire learning phase. Given the topographical characteristics of the anterior/frontal N2 component described in previous studies, and since variations in this component were seen over the midline, a frontal electrode pool was defined by calculating the average activity of electrodes of F1, F2, Fz, FCz, FC1, and FC2. We quantified the N2 component indicating mismatch- and deviance-
related functions as the mean amplitude between 200 ms and 300 ms over the frontal (F) pool.
The subsequent P3 component indicating potentially more explicit target processing was measured as the mean amplitude between 250 ms and 350 ms at the electrode Pz. We
quantified the P1 component related to perceptual processing as the mean amplitude between 70 ms and 120 ms at the electrode Oz, where this ERP component showed maximum
amplitude.
Data analysis
Different learning measures can be quantified in the ASRT task. It has been shown that participants give increasingly faster responses to high-frequency triplets compared to low- frequency ones over the course of the task, which is a behavioral correlate of learning the local sequential regularities (i.e., triplet learning, see Nemeth et al., 2010; Song, Howard, &
Howard, 2007). However, as the high-frequency triplet category collapses pattern and random triplets, knowledge about the predefined sequence structure cannot be extracted merely from the comparison of RT to high- vs. low-frequency triplets. To disentangle the two key learning processes of the ASRT task performance (see the behavioral study of Nemeth, Janacsek, &
Fiser, 2013), statistical learning and sequence learning were measured instead of triplet learning. In addition, speed-up could also be measured independent of the frequency or sequential position of the stimuli. The latter indicates general skill improvements reflecting more efficient visuomotor and motor-motor coordination due to practice (Hallgato et al., 2013).
Statistical learning is the difference in RT between random high-frequency and low- frequency triplets (RT for low-frequency triplets minus RT for random high-frequency triplets). These triplets share the same sequence properties (both random) but differ in statistical properties (i.e., whether they are frequent or not during stimulus presentation).
Hence, greater statistical learning is defined as faster responses to high-frequency than to low- frequency random triplets. Sequence learning is the difference in RT between random high- frequency and pattern high-frequency triplets (RT for random high-frequency triplets minus RT for pattern high-frequency triplets). These triplets share the same statistical properties (both high frequency) but differ in sequence properties (i.e., whether they belong to the predefined sequence or not). Thus, greater sequence learning is defined as faster responses to pattern high-frequency than to random high-frequency triplets. As random high-frequency triplets are rare compared to the other triplet types, this learning measure could capture the difference between the effect of a larger sequential pattern and the effect of random
appearance when controlling for the frequency of stimulus presentation. In contrast, statistical learning could capture purely frequency-based learning.
Following the standard data analysis protocol of previous studies using the ASRT task (J. H. Howard, Jr. & Howard, 1997; Nemeth, Janacsek, & Fiser, 2013), two types of low- frequency triplets were eliminated from the behavioral and ERP analyses: repetitions (e.g., 1 – 1 – 1, 4 – 4 – 4) and trills (e.g., 1 – 2 – 1, 2 – 4 – 2). Repetitions and trills were low frequency for all participants, who often show pre-existing response tendencies to them (D. V. Howard et al., 2004). By eliminating these triplets, we could ensure that any high- versus low-
frequency differences were due to learning and not to pre-existing tendencies. As in previous studies (Nemeth, Janacsek, Polner, & Kovacs, 2013; Song et al., 2007; Virag et al., 2015), we collapsed the five-block-long segments of data into larger epochs; thus, we altogether
analyzed six epochs of the ASRT task. Epochs are labeled consecutively in this paper (1, 2, etc.). Considering the behavioral data, for each participant and epoch, we calculated median RT (only for correct responses with an RT greater than 0 ms), separately for pattern and random high-frequency triplets and low-frequency triplets. For the sake of completeness, we report the mean accuracy of responses in each experimental condition in Table 1. However, as
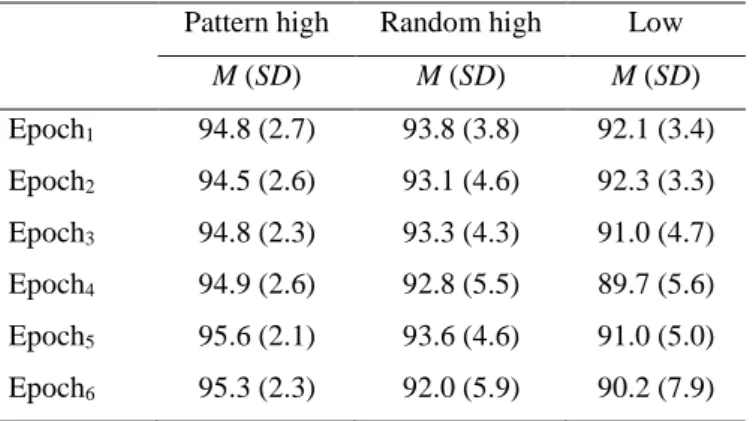
the accuracy of responding has been influenced by the feedback given to participants after each block, and overall accuracy has usually been high with relatively low variability in samples of healthy young adults performing the ASRT task (J. H. Howard, Jr. & Howard, 1997; Nemeth et al., 2010; Romano et al., 2010), we do not analyze accuracy data in details here. In addition, since RTs and ERPs are calculated only for correctly responded trials, accuracy results are not assumed to match RT and ERP results; therefore, are not considered.
The targeted learning measures – statistical learning and sequence learning – were first quantified with two-way repeated measures analyses of variance (ANOVAs) with TYPE (pattern high-frequency, random high-frequency, and low-frequency triplets) and EPOCH (1–
6) as within-subjects factors on RT and the mean amplitude of P1, N2, and P3 components, respectively. In the case of a significant TYPE * EPOCH interaction, statistical learning was then tested with another TYPE by EPOCH ANOVA, where the TYPE factor contrasted random high-frequency and low-frequency triplets. Similarly, sequence learning was tested with a TYPE by EPOCH ANOVA, where the TYPE factor contrasted random high-frequency and pattern high-frequency triplets. In all ANOVAs, the Greenhouse-Geisser epsilon (ε) correction (Greenhouse & Geisser, 1959) was used when necessary. Original df values and corrected p values are reported (if applicable). Partial eta-squared (ηp2) is reported as the measure of effect size. To control for Type I error, we used LSD (Least Significant Difference) tests for pair-wise comparisons.
To investigate the correspondence in the potential change of statistical and sequence learning between the behavioral and the ERP correlates, we ran correlational analysis. We calculated statistical and sequence learning scores for the N2 component in each epoch
similarly to RT data. Namely, statistical learning was defined as the mean amplitude of N2 for low-frequency triplets minus the mean amplitude of N2 for random high-frequency triplets, while sequence learning was defined as the N2 for random high-frequency triplets minus the
N2 for pattern high-frequency triplets. Note that a more negative learning score in the N2 is considered as an index of greater learning since we expected the most negative deflection for low-frequency triplets and the least negative deflection for pattern high-frequency triplets with random high-frequency ones in-between. Importantly, overall learning scores for RT and N2 were also considered for the entire task as the mean of scores calculated for each epoch.
Correlational analysis involved testing the relations between the indices of the sequence report – the timing of the discovery of the sequence and the sequence knowledge score (partial knowledge) – and overall learning scores of RT and N2.
Results
Results from ANOVAs performed on behavioral and ERP data are presented in Table 2.
Table 1. Mean percentage (%) and standard deviation of response accuracy split by triplet type and epoch.
Pattern high Random high Low M (SD) M (SD) M (SD) Epoch1 94.8 (2.7) 93.8 (3.8) 92.1 (3.4) Epoch2 94.5 (2.6) 93.1 (4.6) 92.3 (3.3) Epoch3 94.8 (2.3) 93.3 (4.3) 91.0 (4.7) Epoch4 94.9 (2.6) 92.8 (5.5) 89.7 (5.6) Epoch5 95.6 (2.1) 93.6 (4.6) 91.0 (5.0) Epoch6 95.3 (2.3) 92.0 (5.9) 90.2 (7.9)
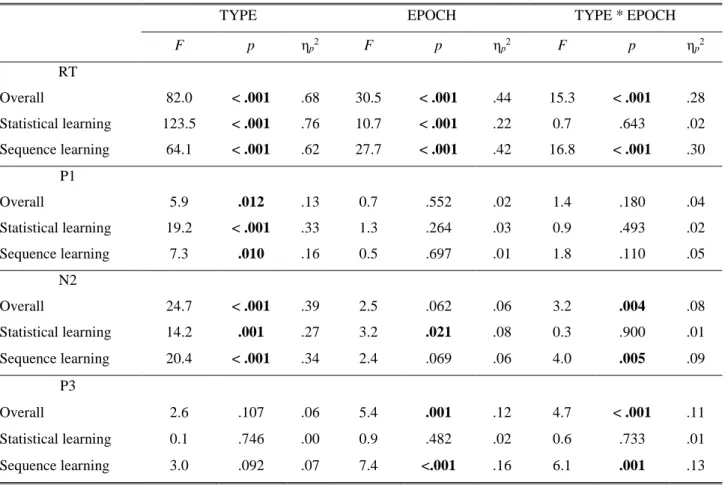
Table 2. Summary of results from ANOVAs performed on behavioral and ERP data.
TYPE EPOCH TYPE * EPOCH
F p ηp2 F p ηp2 F p ηp2
RT
Overall 82.0 < .001 .68 30.5 < .001 .44 15.3 < .001 .28
Statistical learning 123.5 < .001 .76 10.7 < .001 .22 0.7 .643 .02 Sequence learning 64.1 < .001 .62 27.7 < .001 .42 16.8 < .001 .30
P1
Overall 5.9 .012 .13 0.7 .552 .02 1.4 .180 .04
Statistical learning 19.2 < .001 .33 1.3 .264 .03 0.9 .493 .02
Sequence learning 7.3 .010 .16 0.5 .697 .01 1.8 .110 .05
N2
Overall 24.7 < .001 .39 2.5 .062 .06 3.2 .004 .08
Statistical learning 14.2 .001 .27 3.2 .021 .08 0.3 .900 .01
Sequence learning 20.4 < .001 .34 2.4 .069 .06 4.0 .005 .09
P3
Overall 2.6 .107 .06 5.4 .001 .12 4.7 < .001 .11
Statistical learning 0.1 .746 .00 0.9 .482 .02 0.6 .733 .01
Sequence learning 3.0 .092 .07 7.4 <.001 .16 6.1 .001 .13
Note. p-values below .050 are boldfaced.
Behavioral results
The TYPE (pattern high-frequency, random high-frequency, and low-frequency triplets) by EPOCH (1–6) ANOVA on RT revealed the significant main effects of TYPE, F(2, 78) = 82.02, ε = .521, p < .001, ηp2 = .678, and EPOCH, F(5, 195) = 30.51, ε = .633, p < .001, ηp2 = .439, showing that RTs differed across triplet types and overall RT of participants gradually decreased irrespective of triplet type as a result of general skill improvements. These effects were qualified by the significant TYPE * EPOCH interaction, F(10, 390) = 15.25, ε = .382, p
< .001, ηp2 = .281, indicating that RTs between and/or within triplet types changed as the task progressed (see Fig. 2).
To quantify statistical learning in more detail and as a follow-up of this interaction, we performed a TYPE by EPOCH ANOVA contrasting random high-frequency and low-
frequency triplets. Analysis revealed significant statistical learning (main effect of TYPE, F(1, 39) = 123.53, p < .001, ηp2 = .760), indicating that participants were faster on random high-frequency triplets than on low-frequency ones. In addition, there were significant general skill improvements (main effect of EPOCH, F(5, 195) = 10.71, ε = .730, p < .001, ηp2 = .215).
To detail, RTs on random triplets became faster in the early phase of the task, irrespective of the frequency of the triplet (RTs were significantly higher in epoch1 [359 ms] than in
epochs3,4,5,6, all ps ≤ .010, and they were also higher epoch2 [356 ms] than in epochs3,4,5, all ps
≤ .002; but RTs were again higher in epoch6 than in epoch3 [352 ms vs. 347 ms, p = .024] and epoch5 [352 ms vs. 346 ms, p = .002]). The difference in RT between random high- and low- frequency triplets did not change with practice, indicated by the non-significant TYPE * EPOCH interaction, F(5, 195) = 0.68, p = .643, ηp2 = .017.
In regard to sequence learning, the TYPE by EPOCH ANOVA contrasting random high-frequency and pattern high-frequency triplets revealed significant sequence learning and general skill improvements (significant main effects of TYPE, F(1, 39) = 64.07, p < .001, ηp2
= .622, and EPOCH, F(5, 195) = 27.73, ε = .613, p < .001, ηp2 = .416). Participants were faster on pattern high-frequency triplets than on random high-frequency ones, and, importantly, this difference increased with practice, indicated by the significant TYPE * EPOCH interaction, F(5, 195) = 16.78, ε = .617, p < .001, ηp2 = .301. According to pair-wise comparisons, the difference between pattern and random high-frequency triplets was
significant in all epochs (all ps < .001), and this difference significantly increased until epoch4
(it was larger in epoch1 [34 ms] than in all other epochs (all ps < .001); it was larger in epoch2
[57 ms] than in epochs4,5,6, all ps ≤ .008; it was larger in epoch3 [63 ms] than in epochs4,5,6, all ps ≤ .021; and it was larger in epoch4 than in epoch6 [75 ms vs. 87 ms, p = .035]. Particularly, RTs became increasingly faster on pattern high-frequency triplets (RTs were significantly higher in epoch1 [316 ms] than in all other epochs, all ps < .001; they were higher in epoch2
[293 ms] than in epochs3,4,5,6, all ps ≤ .009; and they were higher in epoch3 [278 ms] than in epochs4,5,6, all ps ≤ .010; but no further significant RT decrease was found in the task after epoch4). Meanwhile, RTs on random high-frequency triplets did not change linearly over the task (RTs were significantly higher in epoch1 [350 ms] than in epochs3,4,5, all ps ≤ .020; they were higher in epoch2 [349 ms] than in epochs3,4,5, all ps ≤ .006; but they were again higher in epoch6 than in epoch5 [344 ms vs. 339 ms, p = .038]).
According to the sequence report, explicit knowledge about the sequence emerged early in the experiment. Participants consistently reported the sequence structure from around the 4th block (M = 3.68, SD = 6.15). The mean of the sequence knowledge score for the whole task (partial knowledge of the sequence) was 11.56 (SD = 0.82). After the very first block, the maximum of 12 correct responses was provided by 70% of the sample (28 participants), and relatedly, the mean of reporting the correct sequence elements was 10.18 (SD = 3.26) in the entire sample.
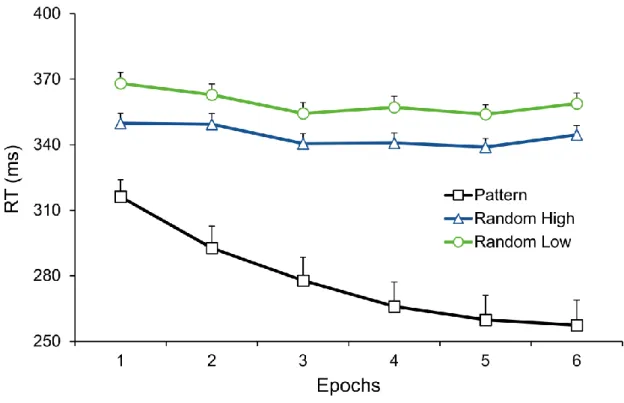
Figure 2. Temporal dynamics of procedural learning across epochs at the behavioral level.
Group-average RT values for correct responses as a function of epoch (1–6) and triplet type (pattern and random high-frequency triplets and random low-frequency triplets) are presented.
The green vs. blue difference indicates statistical learning (random low- vs. high-frequency triplets) while the blue vs. black difference (random vs. pattern high-frequency triplets) indicates sequence learning. Error bars denote standard error of mean.
ERP results
Grand average ERP waveforms split by triplet type and epoch are presented in Figures 3-5.
The P1 component appeared as a sharp positive wave at the Oz electrode, and the N2 component appeared as a broader negative deflection over the frontocentral electrode pool.
Distinct subcomponents of the N2 were not clearly identifiable across conditions. The N2 was followed by a large P3 component over the centroparietal, parietal, and parieto-occipital electrodes sites (only the Pz electrode is presented in Figure 5).
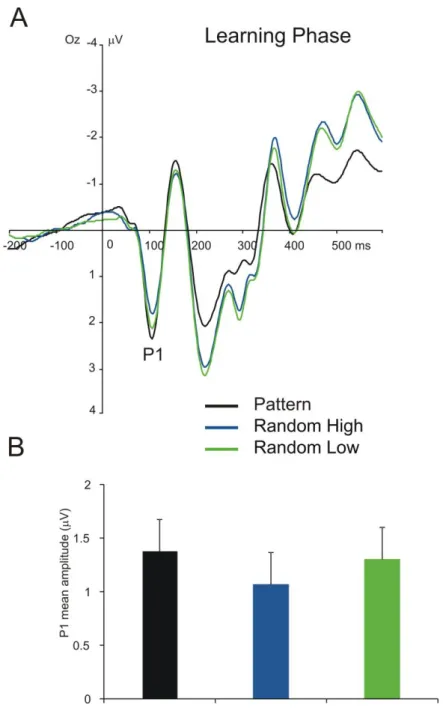
P1 component. The TYPE (pattern high-frequency, random high-frequency, and low- frequency triplets) by EPOCH (1–6) ANOVA on the mean amplitude of P1 showed
significant main effect of TYPE, F(2, 78) = 5.91, ε = .569, p = .012, ηp2 = .132, indicating that the amplitude of P1 was more positive for random low-frequency than for random high- frequency triplets (1.30 µV vs. 1.07 µV, p < .001), and was more positive for pattern high- frequency than for random-high frequency triplets (1.38 µV vs. 1.07 µV, p = .010). This means that the P1 showed the lowest mean amplitude for random high-frequency triplets, and random low-frequency and pattern high-frequency triplets did not differ from one another (see Fig. 3). The main effect of EPOCH, F(5, 195) = 0.69, ε = .569, p = .552, ηp2 = .017, and the TYPE * EPOCH interaction, F(10, 390) = 1.40, p = .180, ηp2 = .035, were not significant, suggesting that the overall mean amplitude of P1 and its difference between triplet types did not change as a function of practice. In line with these results, the TYPE by EPOCH
ANOVAs performed separately for statistical (contrasting random high-frequency and low- frequency triplets) and sequence learning (contrasting random high-frequency and pattern high-frequency triplets) revealed the main effects of TYPE for both learning processes
(statistical learning: F(1, 39) = 19.23, p < .001, ηp2 = .330, sequence learning: F(1, 39) = 7.28, p = .010, ηp2 = .157). As the interaction was not significant in the overall ANOVA, we do not report the separate TYPE * EPOCH interaction effects. However, for the sake of
completeness and direct comparison of learning effects, results of the separate TYPE by EPOCH ANOVAs are shown in Table 2.
Figure 3. P1 results for each triplet type. (A) Grand average ERP waveforms at electrode Oz, displaying the P1 component for each triplet type, averaged for all epochs. Please note, negativity is plotted upwards here and in the following figures representing ERPs. (B) Group- average P1 mean amplitudes for each triplet type. The green vs. blue difference indicates statistical learning (random low- vs. high-frequency triplets) while the blue vs. black
difference (random vs. pattern high-frequency triplets) indicates sequence learning. Error bars denote standard error of mean.
N2 component. The TYPE (pattern high-frequency, random high-frequency, and low- frequency triplets) by EPOCH (1–6) ANOVA on the mean amplitude of N2 showed a
significant main effect of TYPE, F(2, 78) = 24.73, ε = .546, p < .001, ηp2 = .388, a tendency for the main effect of EPOCH, F(5, 195) = 2.54, ε = .576, p = .062, ηp2 = .061, and a
significant TYPE*EPOCH interaction, F(10, 390) = 3.21, ε = .623, p = .004, ηp2 = .076, suggesting that the mean amplitude of the N2 between and/or within triplet types changed as the task progressed (see Fig. 4 and Fig. 6A).
In the case of statistical learning, the TYPE by EPOCH follow-up ANOVA
contrasting random high-frequency and low-frequency triplets revealed the significant main effects of TYPE, F(1, 39) = 14.22, p = .001, ηp2 = .267, and EPOCH, F(5, 195) = 3.21, ε = .669, p = .021, ηp2 = .076, showing that the N2 was larger (more negative) for random low- frequency than for random high-frequency triplets, as well as that the mean amplitude of the N2 for random triplets changed during the task, irrespective of the frequency of the triplet (N2 in epoch2 was significantly lower [less negative, -1.37 µV] than in epochs1,3,4,5, all ps ≤ .024, and it was larger (more negative) in epoch5 than in epoch6 [-1.92 µV vs. -1.66 µV, p = .014]).
The difference in the mean amplitude of N2 between random high-frequency and low-
frequency triplets did not change with practice, indicated by the non-significant interaction of TYPE * EPOCH, F(5, 195) = 0.32, p = .900, ηp2 = .008.
In the case of sequence learning, the TYPE by EPOCH follow-up ANOVA
contrasting random high-frequency and pattern high-frequency triplets revealed a significant main effect of TYPE, F(1, 39) = 20.42, p < .001, ηp2 = .344, and a tendency for the main effect of EPOCH, F(5, 195) = 2.43, ε = .596, p = .069, ηp2 = .059. The mean amplitude of N2 was larger (more negative) for random than for pattern high-frequency triplets, and,
importantly, this difference increased with practice, indicated by the significant TYPE * EPOCH interaction, F(5, 195) = 4.03, ε = .756, p = .005, ηp2 = .094. Pair-wise comparisons
showed that the difference between pattern and random high-frequency triplets was
significant in all epochs (all ps ≤ .036), and this difference significantly increased during the second half of the task as compared to its first half (it was larger in epoch4 [-1.22 µV] than in epochs1,2, all ps ≤ .030; it was larger in epoch5 [-1.29 µV] than in epochs1,2,3, all ps ≤ .044;
and it was larger in epoch6 [-1.31 µV] than in epochs1,2,3, all ps ≤ .028). Particularly, although the N2 for pattern high-frequency triplets slightly decreased over the task (the N2 in epoch6
was significantly lower [less negative, -0.30 µV] than in epochs1,3,5, all ps ≤ .020; other significant differences: epoch1 vs. epoch2 [-0.97 µV vs. -0.59 µV, p = .033], epoch1 vs. epoch4
[-0.97 µV vs. -0.34 µV, p = .009], epoch3 vs. epoch4 [-0.65 µV vs. -0.34 µV, p = .035]), no such trend was observed for random high-frequency triplets (the N2 in epoch2 was
significantly lower [less negative, -1.22 µV] than in epochs1,5, all ps ≤ .033).
P3 component. The TYPE (pattern high-frequency, random high-frequency, and low- frequency triplets) by EPOCH (1–6) ANOVA on the mean amplitude of P3 showed a non- significant main effect of TYPE, F(2, 78) = 2.62, ε = .594, p = .107, ηp2 = .063, a significant main effect of EPOCH, F(5, 195) = 5.43, ε = .707, p = .001, ηp2 = .122, and a significant TYPE * EPOCH interaction, F(10, 390) = 4.72, ε = .551, p < .001, ηp2 = .108, suggesting that the mean amplitude of the P3 between and/or within triplet types changed as the task
progressed (see Fig. 5 and Fig. 6B).
In the case of statistical learning, the TYPE by EPOCH follow-up ANOVA
contrasting random high-frequency and low-frequency triplets did not reveal any significant effect (TYPE: F(1, 39) = 0.11, p = .746, ηp2 = .003, EPOCH: F(5, 195) = 0.85, ε = .707, p = .482, ηp2 = .021, TYPE * EPOCH: F(5, 195) = 0.56, p = .733, ηp2 = .014).
In the case of sequence learning, the TYPE by EPOCH follow-up ANOVA
contrasting random high-frequency and pattern high-frequency triplets revealed a trend for the
main effect of TYPE, F(1, 39) = 2.99, p = .092, ηp2 = .071, and a significant main effect of EPOCH, F(5, 195) = 7.35, ε = .737, p < .001, ηp2 = .158. These effects were qualified by the significant TYPE * EPOCH interaction, F(5, 195) = 6.05, ε = .608, p = .001, ηp2 = .134, indicating that the mean amplitude of P3 was more positive for pattern than for random high- frequency triplets in epoch1 (5.44 µV vs. 4.53 µV, p < .001) and epoch2 (4.85 µV vs. 4.21 µV, p = .002), and there was no significant difference between these triplet types in the remaining epochs (all ps ≥ .179). Pair-wise comparisons also showed that the difference between pattern and random high-frequency triplets significantly decreased as the task progressed (it was larger in epoch1 [-0.91 µV] than in epochs4,5,6, all ps ≤ .038; it was larger in epoch2 [-0.64 µV]
than in epochs5,6, all ps ≤ .002; it was larger in epoch3 than in epoch6 [-0.31 µV vs. 0.14 µV, p
= .033]; and it was larger in epoch4 than in epoch6 [-0.24 µV vs. 0.14 µV, p = .048]; overall, it was lower in epoch6 than in epochs1,2,3,4, all ps ≤ .048). Particularly, the P3 for random high- frequency triplets did not change over the task (all ps ≥ .075), while it showed a roughly linear decrease for pattern high-frequency triplets (the P3 was significantly larger [5.44 µV] in epoch1 than in the other epochs, all ps < .001; it was larger in epoch2 [4.85 µV] than in
epochs4,5,6, all ps ≤ .038; it was larger in epoch3 than in epoch5 [4.63 µV vs. 4.24 µV, p = .014]
and epoch6 [4.63 µV vs. 4.07 µV, p = .002]; and it was larger in epoch4 than in epoch6 [4.49 µV vs. 4.07 µV, p = .021]).
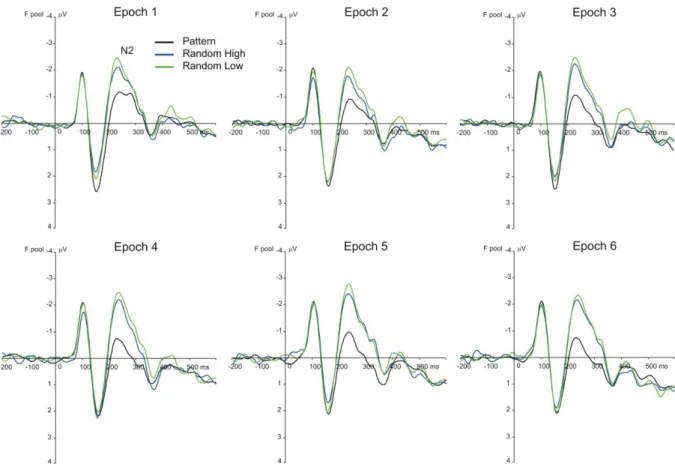
Figure 4.Grand average ERP waveforms at the frontal electrode pool, displaying the N2 component for each epoch and triplet type. The green vs. blue difference indicates statistical learning (random low- vs. high-frequency triplets) while the blue vs. black difference (random vs. pattern high-frequency triplets) indicates sequence learning.
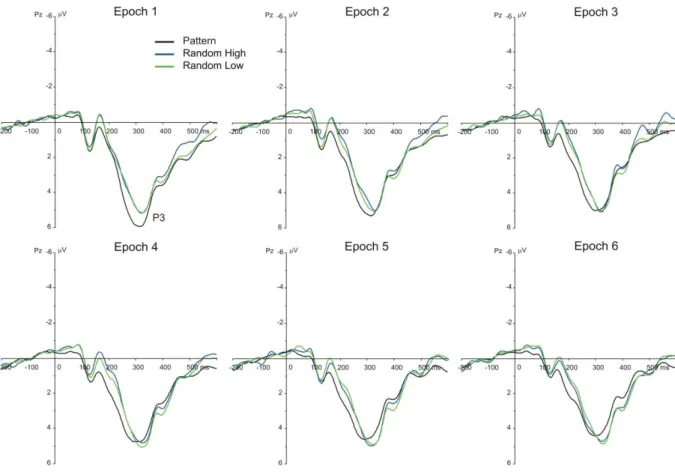
Figure 5. Grand average ERP waveforms at electrode Pz, displaying the P3 component for each epoch and triplet type. The green vs. blue difference indicates (the lack of) statistical learning (random low- vs. high-frequency triplets) while the blue vs. black difference (random vs. pattern high-frequency triplets) indicates sequence learning.
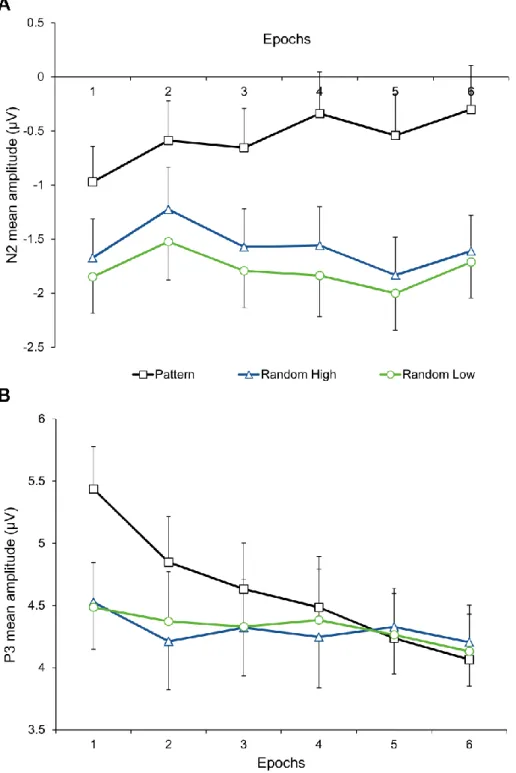
Figure 6. Temporal dynamics of procedural learning across epochs at the level of ERPs.
Group-average (A) N2 and (B) P3 mean amplitudes as a function of epoch (1–6) and triplet type (pattern and random high-frequency triplets and random low-frequency triplets) are presented. The green vs. blue difference indicates statistical learning (random low- vs. high- frequency triplets) while the blue vs. black difference (random vs. pattern high-frequency triplets) indicates sequence learning. Error bars denote standard error of mean.
Correlations between the behavioral and the N2 correlates of learning
First, no significant correlations were found between the overall learning scores of sequence learning and statistical learning calculated either for the RT (r(38) = - .145, p = .372) or the N2 (r(38) = - .126, p = .440). Second, regarding the relations between behavioral and ERP correlates, in the case of sequence learning, greater learning score for RT was associated with greater learning score for N2 (r(38) = - .675, p < .001), but no such association was found in the case of statistical learning (r(38) = - .188, p = .245). (Recall that a more negative learning score in the N2 [larger negative amplitude] is considered as an index of greater learning).
We also tested the indices of the sequence report, which measured explicit knowledge about the ASRT sequence. When we analyzed the timing of the discovery of the sequence, we excluded two participants who failed to provide at least 10 correct responses even after the final block of the task or reached this threshold during earlier blocks but failed to do so consistently in the remaining blocks. Other analyses with the sequence knowledge score (partial knowledge) were run on the entire sample. The distributions of these variables were strongly skewed; therefore, Spearman’s rank correlations (rs) were calculated between indices of the sequence report and RT and N2 overall learning scores. We found a significant
correlation between the timing of the discovery of the sequence and the extent of sequence learning in RT (rs = - .521, p = .001) and N2 (rs = .351, p = .031); thus, the earlier the participants could report the sequence structure, the greater their sequence learning performance was at the level of both the behavioral and the ERP correlates. However, as expected, there was no significant correlation between this sequence report index and statistical learning scores (RT: rs = - .048, p = .776; N2: rs = - .204, p = .220). The same pattern of associations was observed for the sequence knowledge score (partial knowledge):
While higher sequence knowledge score was related to significantly greater sequence learning
in RT (rs = .457, p = .003) and N2 (rs = - .410, p = .009), it was not related to statistical learning (RT: rs = .103, p = .526; N2: rs = .031, p = .849).
Discussion
This study investigated the ERP correlates of simultaneously extracting statistical
probabilities and complex sequential structures from the same information stream. To this end, we separately analyzed the processes of statistical learning and sequence learning in a procedural learning task that included temporal regularity between trials farther apart. In the case of statistical learning, sequential properties of the stimuli were kept constant while stimuli were more or less frequent, thus, differed in transitional and distributional probability.
In the case of sequence learning, stimulus probabilities were kept constant and the stimuli were random or part of the predefined sequence, thus, differed in sequential properties.
Behavioral results suggested the rapid acquisition of statistical probabilities as opposed to the gradual learning of sequential structures, which were independent of one another.
Importantly, ERP results also reflected the distinct trajectory of these two processes. Although the N2 component showed rapid, automatic detection of statistical probabilities, this
component gradually changed as participants acquired the sequential structures. The extent of sequence learning measured by RT as well as the N2 component were related; moreover, these learning measures varied as a function of explicit knowledge about the sequence
structure. Such associations were not shown in relation to statistical learning. Meanwhile, the P3 component was not sensitive to statistical probabilities, but, likewise the N2, it gradually changed with the acquisition of sequential structures. Fast and robust distinction of stimulus probabilities as well as sequential properties was observed at the early stage of perceptual processing as the P1 component was sensitive to both learning processes and this sensitivity did not change further through extended practice with the task. Overall, our results indicate
that statistical learning and sequence learning develop differently at the level of both behavioral and ERP correlates, at least after the early stage of stimulus processing.
The distinction between statistical learning and sequence learning at the behavioral level has been shown previously both in explicit and implicit ASRT task versions (Nemeth, Janacsek, & Fiser, 2013; Simor et al., 2017). As in the study of Nemeth, Janacsek, and Fiser (2013), analysis of the explicit knowledge about the sequence structure in the present study indicate that participants could find and explicitly learn the sequence in line with task
instructions. In addition, the earlier they found the sequence and the more often they correctly reported each element of the sequence, the greater their knowledge about the sequence was in terms of behavioral and ERP correlates. The different nature of statistical and sequence learning was also supported by the fact that the extent of explicit knowledge about the
sequence was unrelated to the extent of statistical learning. Beyond measures of the sequence report, future studies could also consider premature responses and their change in frequency over the task as additional indices of explicit sequence learning (Verleger et al., 2015). Since the occurrence of premature responses was low in the present study (0.29%), these responses could not be meaningfully analyzed. In addition, the use of implicit (with perceptually identical pattern and random elements) and explicit (with the pattern elements cued) task blocks in future experiments might help investigating whether the explicitly acquired
knowledge in the cued blocks could be transferred to the implicit blocks (Nemeth, Janacsek,
& Fiser, 2013). This design could probably test whether the extraction of statistical
probabilities (statistical learning) is related to the generalization of sequence learning from a controlled, explicit learning situation to a more automatic one with the same underlying alternating sequence structure. Nevertheless, our behavioral and correlational findings
altogether support the notion that multiple, dissociable processes contribute to the procedural