Acceptance of Payment Cards by
Retailers in Hungary Based on Data of Online Cash Registers*
Tamás Ilyés – Lóránt Varga
In our study we examined payment card acceptance in the Hungarian retail sector based on a receipt-level, detailed dataset derived from online cash registers. The main objective of our research was to identify the primary explanatory variables and to test conventional card acceptance hypotheses. For the purposes of our analysis, we relied on anonymised online cash register data provided by the National Tax and Customs Administration (NTCA) for the year 2016. Covering an extremely broad section of the Hungarian retail sector, with nearly 3.8 billion data points the database provides a basis for complex and robust analyses. We tested store- level monthly aggregate data with county and network attributes. Based on the robust results of the research, we found that store size can be considered the most important explanatory variable behind card acceptance decisions; however, the correlation is not linear. The marginal effect of size is negligible among small and large-sized stores, but there is a strong positive correlation among mid-sized stores.
We also analysed the effect of the store’s customer base and other attributes, and although numerous effects proved to be statistically significant, they wielded negligible influence in card acceptance decisions. On the other hand, being open on Sundays – a subjective variable that was used as a proxy for store ownership – had a significant negative effect on card acceptance decisions.
Journal of Economic Literature (JEL) codes: C44, G20, D22
Keywords: payment transactions, card acceptance, payment methods, decision models, logistic regression
1. Objective
The objective of this study was to explore the aspects considered in the card acceptance decisions of retail merchants and to provide an exact estimate of their discrete effects. Given the broad range of businesses, no analysis has been produced
* The views expressed in this paper are those of the author(s) and do not necessarily reflect the offical view of the Magyar Nemzeti Bank.
Tamás Ilyés is an economic analyst at the Magyar Nemzeti Bank. E-mail: ilyest@mnb.hu Lóránt Varga is a Head of Department at the Magyar Nemzeti Bank. E-mail: vargalor@mnb.hu The Hungarian manuscript was received on 28 June 2017.
so far that examines the bases of card acceptance decisions across the entire retail sector. Since neither the payment service providers nor card companies have a database that also covers “cash only” merchants, all previous analyses of this kind relied on questionnaire-based surveys. However, the Hungarian online cash register database made available to us by the National Tax and Customs Administration (NTCA) allowed us to inspect the entire retail business from the aspect of payment card acceptance. Thanks to the large sample size, we were able to reliably identify even narrow segments and negligible effects. Our main research questions were the following:
• Based on international experiences, the decision on card acceptance is influenced to the highest extent by the size of the merchant’s annual turnover. To what extent does this observation apply to the domestic retail sector?
• Did the size of the anticipated card turnover influence the decision on card acceptance in Hungary?
• To what extent do factors other than the annual turnover of stores contribute to card acceptance?
• Can we distinguish between small, medium and large stores with and without card acceptance according to the same aspects?
• Is there a significant difference between independent shopkeepers and chain merchants in terms of their card acceptance decisions? In network decisions, is it the size of the network or rather individual store sizes that affect card acceptance the most?
In the first section of our paper we review relevant international literature on card acceptance, and describe the data available, in addition to the online cash register database constituting the basis of our analysis. Some of the variables used in our analysis were derived directly from receipt-level data, while others were used as proxies.
In Section 3 we define the methodology of the analysis and the variables used, and expound on the method applied in determining our sub-samples. We then provide a detailed description of our findings in Section 4, and check the robustness of the results from various perspectives.
2. Processing the literature
Exploring the acceptance of payment cards is primarily a theoretical area of research in payment services. The research focus is the impact of the interchange fee on card acceptance, and an assessment of the ways we can define an equilibrium fee value in the oligopolistic market of bank cards. In the first analysis on this topic, Baxter (1983) argues in favour of the interchange fee. This model was also criticised by
Rochet – Tirol (2003) and Wright (2003), who significantly enhanced the original model, however, the conclusion remained the same, i.e. that without surcharges the interchange fee exerts a neutral impact on the market. In their article from 2007, Rochet and Tirole created an empirical test to determine whether the level of the applied interchange fee is higher than the equilibrium value. An analysis was also performed in Hungary based on this test (Keszy – Harmath et al. 2012), whose results indicated that regulating the interchange fee is justified. However, the theoretical models provided only minor cues for a cross-sectional understanding of card acceptance, since in the simplified framework the merchants usually only differed from one another in terms of unit cost.
Parallel with the theoretical models, a significant part of empirical literature also focused on the costs of card acceptance (Humphrey et al. 2003; Turján et al. 2010). Concerning empirical studies, our research primarily draws from the results of questionnaire-based surveys. Jonker (2011) explored card acceptance and surcharging using survey data collected among 1,008 Dutch merchants. The results of the author’s regression analysis revealed that while the merchant’s revenue and the number of employees are significant explanatory variables, the cost of card payments also influences card acceptance. Arango and Taylor (2008) investigated card acceptance decisions in the Canadian market, primarily focusing on merchant perceptions, whereas Polasik and Fiszeder (2014) studied the payment method acceptance decisions of online shops. The lion’s share of empirical studies, however, concentrates on consumers’ card usage rather than the supply side (Bolt 2008, 2010; Borzekowski 2006).
In our research we verify the applicability of international results in Hungary, primarily focusing on demonstrating the impacts of the size of commerce – annual revenue – and those of subjective factors. Compared to questionnaire-based surveys, owing to the size of the sample and the scope of this survey, this research enables us to assess card acceptance on several sub-samples.
3. Methodology
3.1. Data source: online cash register (OCR) database
The Ministry for National Economy mandated the use of cash registers connected directly online to the tax authority pursuant to Decree 2013/48 (XI. 15). The replacement of cash registers was implemented as part of a gradual process at the end of 2014; subject to certain conditions, taxpayers were permitted to use traditional cash registers until 1 January 2015. The scope of the online cash register system has been expanded significantly since the adoption of the Decree.
Initially, the regulation primarily covered retail trade turnover; from 1 January 2017, however, its provisions became applicable to a substantial part of the services sector too (e.g. taxi services, hospitality/catering, automotive repair services).
The online cash registers provide the NTCA with itemised data on all receipts issued.
For the purposes of our analysis, we used an anonymised database of receipt-level aggregate data. Pursuant to legislation currently in force, retail outlets are not required to issue itemised receipts for each product; they only need to separate products according to collective VAT rate categories. As a result, the itemised breakdown of the database cannot be used for a comprehensive analysis. Besides aggregate data – value, VAT content, payment method, store information – data on the number of items listed on the receipt are also available.
Store information is displayed anonymously through randomly generated identifiers;
the only known information about the physical location is the county, while the activity is only marked by the primary, four-digit NACE’081 code. The merchants are not required to obtain their NACE code on the basis of their main activity, so differences may occur. Certain special scopes of activity can be identified reliably, for example fuel trade.
Owing to the annuality of the database, the group of merchants under review changed during the period; some stores switched ownership, while others operated on a temporary basis. On several occasions, the taxpayer’s activity was modified.
Another serious problem is that owing to the anonymization it is not possible to monitor the turnover of a particular store from month to month. Besides the possible data errors, this means it is not clear in each case in the analysed database whether changes occurred in the operation of the store, or only in the reported administrative details. As a result, the number of stores included in the analyses exceeds that of the online cash registers installed in Hungary. This makes it impossible to assess the database by methods of panel-econometrics.
This problem occurs on a monthly basis; within the month, however, both the actual number of stores and the links within a network can be identified with a high degree of certainty. We have corrected this anomaly by generating the data of all stores separately for each month. In this case, each store is included in the database 12 times on average. This approach guarantees that if the anomaly of identification from month to month depends on the store size, the ratios will not be distorted in the final database. Otherwise, for example, if it is possible to monitor major stores more easily, while the smaller ones are presented several times with different IDs, the raw database would include significantly fewer minor stores than in reality.
There are two methods for making regression estimates on the database created with a monthly breakdown. In one case we have estimated separate regression values for each month. Since 12 regressions will be created here, owing to the restricted space available we only included the coefficients of one representative month in the final database. For most of the assessed variables there are no
1 The Hungarian NACE 2008 codes correspond to the European classifications of NACE rev. 2.
significant differences between the monthly models, we placed the detailed tables in the Annex. The second option is to estimate the entire database within the framework of one model. The individual sub-samples will only be different in level, considering the impacts of other explanatory variables, the marginal impacts will be the same. In modelling we primarily apply the first approach, however, we compare the results to the parameters of the equations estimated on the common sample. Naturally, in that case the impact of the given explanatory variables on card acceptance will be the average annual impact.
3.2. Estimation steps
We can split up the aims of our research into three logically separate parts. Our first question looks at the marginal impact of the individual explanatory variables on the probability of card acceptance. The second question is whether the decision model shows significant differences for stores of various sizes, while the third is whether it is also different if the decision is made at chain level.
In the first case, in the manner presented in the previous chapter, two types of models can be estimated depending on whether we include the monthly data jointly or in a separate regression. In our analysis we present a model in which only the annual revenue and its orthogonal polynomials are included, furthermore, a complex model with all the significant explanatory variables.
For the second question, initially we include the cross products of the major explanatory variables and those of the annual revenue. In the second step we broke up the sample into three size categories based on annual revenue (Annex 1). We determined the cutting points with a simple decision tree model, in an endogenous manner. The stores whose annual turnover is below HUF 15 million were placed in the smallest group. Typically, the stores are only capable of generating funds to cover the labour costs of one or two people. We consider stores with an annual revenue of between HUF 15 and 150 million as medium-sized stores. Based on the cross-sectional data, the marginal impact of the annual revenue on card acceptance is the highest in this category, with everything else unchanged. In stores larger than that, card acceptance is consistently high, and based on the descriptive data it does not depend meaningfully on the store size.
We distinguished three sub-categories for the assessment of chain-level decisions.
We separated the individual stores. From the stores belonging to a chain – sharing the same numerical tax ID – we considered as subject to chain-level decision-making on card acceptance those stores where card acceptance or the lack of it affects over 95 per cent of all stores. For the remaining stores, individual decisions are presumably made on card acceptance, regardless whether or not they belong to the one chain.
We included the three sub-categories as a dummy variable in the main regression as well; however, in the second step we assessed whether we get different results if we estimate regression separately according to the three sub-categories. In the
case of the sub-samples differentiated according to chain-level decision, the fact that selection is performed in an endogenous manner, depending on the dependent variable, could distort the results. Correcting this problem accurately is not an aim of this study, so the results should be treated with appropriate caution.
The estimated logit model shows whether the store with a given characteristic will become an acceptor or a non-acceptor in the period under assessment. The model is not applicable dynamically for the introduction of card acceptance. In the decision on card acceptance in time, there is presumably a significant level of inertia, i.e. the decision made in the previous period is an important explanatory variable for the next period. Our study does not analyse this temporal, stochastic process, rather, an accepting or non-accepting state generated by the process in a given moment.
In the case of biases caused by the missing variable, such an interpretation of the results would be distorted and wrong. The results only show the statistically significant differences between acceptor and non-acceptor stores. This approach is primarily derived from the shortcomings of the database, but it also makes the results comparable to analyses based on other international surveys.
In our analysis we assessed the following regressions:
• A model only containing annual turnover
▪ Consolidated, using annual data
▪ In a monthly breakdown
• A model containing all the significant variables
▪ Consolidated, using annual data
▪ In a monthly breakdown
• Full model, containing the cross products taken with the annual revenue
▪ Consolidated, using annual data
▪ In a monthly breakdown
• A model broken down to sub-samples according to chain-level decision, in a monthly breakdown
▪ Stores not belonging to a chain
▪ Stores belonging to a chain
• Store-level decision on card acceptance
• Chain-level decision on card acceptance
• A model broken down to sub-samples according to annual revenue, in a monthly breakdown
▪ Small-sized stores
▪ Medium-sized stores
▪ Large-sized stores
Owing to the complexity of the models and the high level of multicollinearity among the variables, the direct comparison is not unequivocal in the case of binary dependent variables. In our analysis we consider two models similar if their explanatory power and the classification generated by them are identical on the rest of the sub-samples as well.
3.3. Variables used Dependent variable
In line with our research question, the primary dependent variable is card acceptance. A merchant or a store is considered a card acceptor when payment card transactions are linked to it in the database. Since payment information is often entered manually in the cash register, some transactions might be erroneous. For the purposes of our analyses, we selected 0.5 per cent as the lower margin of error.
Company size
In our analysis, company size is the most important and most decisive explanatory variable. As we have no external information on the store, annual turnover is derived from the sum of the relevant receipts. Although this raw data series has good mathematical attributes – a lognormal-exponential distribution –, owing to the identification problems mentioned above it may cause bias. Since in some cases a single business may be included more than once (due to store information modifications), it would appear in the database as several, small-turnover stores.
Therefore, we use annualised turnover calculated on the basis of actual turnover Figure 1
Card use according to annual turnover
0 10 20 30 40 50 60 70 80 90 100
0 10 20 30 40 50 60 70 80 90
Per cent Per cent 100
1,000,000 10,000,000 100,000,000 1,000,000,000 10,000,000,000 Note: Vertical axis: ratio of acceptor stores, horizontal axis: annual turnover in HUF shown on a logarit- hmic scale.
and opening days. The review period – 2016 – includes the mandatory Sunday closure as well as the period following the revocation of the regulation (the provision on the repeal was announced on 15 April 2016).
There is a strong correlation between store size and card acceptance, but it is non- linear (see Figure 1); so complex functional forms are required to ensure good explanatory power. We include the orthogonal polynomials of the logarithm of store size in the models. In the case of the models segmented by store size, the sample selection itself increases the complexity of the functional form further.
Among the explanatory variables, card acceptance and the average costs of cash management may be raised. Fundamentally, card acceptance consists of fixed costs – installation and operation of the terminal – and variable costs, which primarily means the merchant service fee. According to an intuitive approach, if the annual turnover of the store is high enough, then card acceptance will create a lower unit cost than cash does. According to surveys of the Magyar Nemzeti Bank, since cash turnover is extremely intensive in Hungary, the cost advantage of cash remains even in the largest stores, therefore this cannot be a direct decision factor.
Value categories
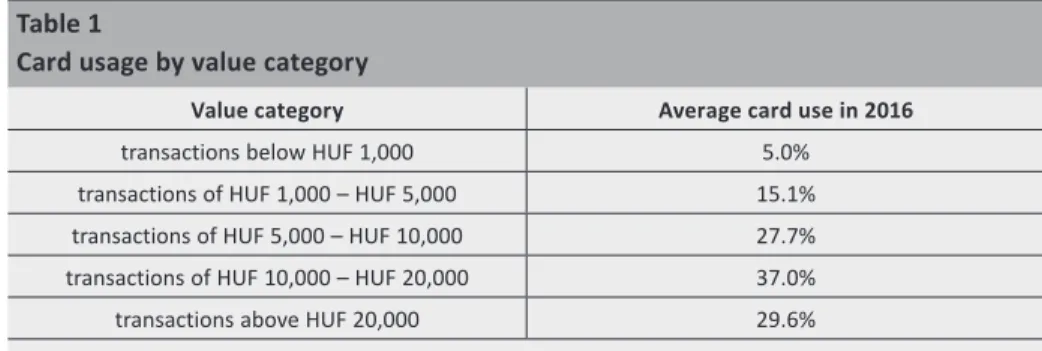
Based on the cross-sectional analysis of the database we can conclude that the willingness to accept payment cards depends strongly on payment value.
Presumably, therefore, in the case of stores with the same annual turnover, actual card use is likely to be higher in businesses where the majority of transactions fall into the appropriate value category as opposed to the stores whose turnover, for the most part, comprises mainly very small-value or very large-value transactions.
Table 1 shows the turnover value categories used in the study.
Table 1
Card usage by value category
Value category Average card use in 2016
transactions below HUF 1,000 5.0%
transactions of HUF 1,000 – HUF 5,000 15.1%
transactions of HUF 5,000 – HUF 10,000 27.7%
transactions of HUF 10,000 – HUF 20,000 37.0%
transactions above HUF 20,000 29.6%
As regards turnover structure, we can examine absolute and relative turnover separately in each individual category. In terms of ratios, the benchmark category is always the highest value category. Due to the nature of the relationship and given the limited number of explanatory variables, the final models include the turnover’s log and its square.
Temporal attributes of the stores
Not only the annualised turnover of the stores, but also the turnover’s monthly and weekly distribution can be established based on the dates indicated on the receipts.
Accordingly, in our analysis we also studied the effect of the weekly turnover structure on card acceptance. For most of the two years under review, the decree on Sunday store closures was in effect in the retail sector. Family-owned stores were the main exceptions. Consequently, Sunday opening hours can be used as a proxy for ownership. Since the correspondence is imperfect, this variable is included in conjunction with the NACE variable in the models. This way we can separate the effects of individual sectoral exceptions from the attributes of the owner.
Since store closures on Mondays and Tuesdays proved to have a significant explanatory power in our analysis, this serves as the control variable in the rest of the models. These attributes are linked to special stores – e.g. museum gift shops, sample stores – where the business is not considered to be an independent financial unit.
Network attributes
A large part of the retail sector operates in the form of a network; in other words, numerous outlets are operated by a single legal entity. According to our hypothesis, the fact that the store is part of a chain affects card acceptance decisions in two ways. In networks where each member of the network belongs to the same category – accepting or not accepting card payments – card acceptance is presumably based on a network-level decision; therefore, the decision situation itself may differ from that of individual stores. By contrast, in networks where, according to observations, card acceptance is based on the independent decision of the store, the decision situation is determined by the store’s unique characteristics. So our models were also designed to examine the effect of decomposing the sample into three parts – independent store, independent decision, chain decision –; moreover, in the case of chain stores, we also included the chain’s total turnover and the number of stores included in the chain. According to the cross-sectional analyses, the correlation is non-linear; therefore we also include the squared terms in the regressions.
Activity
The NTCA database includes the four-digit NACE identifier of the stores’ primary activity. Due to the nature of the sample, nearly three-third of the stores belong to the narrowly interpreted retail sector. In several cases during the modelling, estimating the detailed breakdown is problematic and cannot even be performed completely – for example, where certain secondary activities only involve stores accepting or not accepting cards – or the large number of dummy variables poses obstacles to the estimation of the model. Because of this, we only use the first three digits of the identifier for the majority of our models. The only exceptions
are decision-tree and decision-forest models, where this phenomenon does not present a technical problem.
County code
To ensure the anonymity of the stores, the explanatory variables do not include the precise physical location, only the county identifier. Unfortunately, this significantly restricts the examination of stores that have a different customer base, as we could only distinguish between 21 different types. County code 21 indicates mobile shops with no fixed place. The models do not include customer base information, only the dummy variables of the county codes and the capital city. In the second step, we explain the coefficients of the dummy variables with the aggregate data of the given county.
Item number
The database includes the number of products purchased under each receipt. This allowed us to use the total item number of the store as another approach to the size variable and to introduce average and maximum item numbers. The average and the maximum item number presumably correlate strongly with the payment time and as such, they are used as the proxy variable of the latter. We used average payment value as the control variable in several cases; however, this variable correlates extremely closely with the decomposition of the turnover by value and with the proportions of the ranges.
The most important statistical features of the major explanatory variables are contained in Annex 2.
4. Results
In the manner shown in the presentation of our aim, our first question is to what extent the annual turnover explains card acceptance in Hungary in itself. Based on international literature, the size of turnover of the store is the most important explanatory variable in decisions on card acceptance. After that, we present to what extent the turnover according to value category influences the impact of the entire turnover. In the second step, we analyse the impact of other factors – such as branch, geographical location – then we analyse the identity of the models estimated on samples cut up according to size and decision at chain level.
4.1. Effect of the size variables
It can be concluded from the results (Annex 3) that even if we only make estimates based on annual turnover, acceptor and non-acceptor stores can be set apart from each other to a medium extent. In other words, the annual turnover of the store is the most important aspect in the implementation of card acceptance. The high significance of high-level polynomials implies that fundamentally, the logistic function
form is not capable of properly explaining the processes. The main reason for this is that the impact of size is not linear (Figure 2). In stores with an annual turnover of 150 million, the marginal impact of size decreases significantly. This result returns the phenomenon observed in the cross-sectional analysis of the database.
The turnover split up according to value categories does not significantly change the impact of annual turnover, the explanatory power of the model does not improve substantially (Annex 4). In addition, the various categories affected card acceptance to different degrees. The stores where cards are accepted are more likely to produce transactions that are often paid for by card. The impact of transactions between HUF 10 and 20 thousand is the strongest, while transactions paid for by card in a relatively small ratio even lowered the chance of card acceptance to a small degree (Figure 3). However, the entire impact is lower by an order of magnitude than the impact of the annual turnover. Based on these, we can say that although a split according to value category is significant from a statistical aspect, their impact is not substantial; annual turnover in itself provides a good explanation for card acceptance in Hungary.
Figure 2
Impact of annual turnover in regression in the main models
–4 –2 0 2 4 6 8 10 12 14 16
–4 –2 0 2 4 6 8 10 12 14 16
Only turnover consolidated Only turnover monthly breakdown Complete model consolidated Complete model monthly breakdown
2,000,000 3,200,000 5,000,000 7,900,000 12,600,000 20,000,000 31,600,000 50,100,000 79,400,000 125,900,000 199,500,000 316,200,000
Note: In the case of logistic regressions the impact of the coefficients can be directly interpreted in two ways, the individual impact on the scale of explanatory variables before the logistic transformation, and as an odds-rate multiplier on the scale of the dependent variable. To make the interpretation of polyno- mial forms of functions easier, in this article we present our results according to the first version, there- fore they will be comparable in terms of magnitude according to the different variables. Vertical axis:
the impact calculated on the scale of explanatory variables, horizontal axis: annual turnover presented on a logarithmic scale.
4.2. Impact of other factors
We have added several other explanatory variables to logistic regression, however, the explanatory power of the model only changes to a slight extent as a result of these. Owing to the high number of sample elements, we can also identify minor impacts in our analysis, and although these are statistically significant, they do not substantially influence the decision on card acceptance. Three of the dummy variables should be highlighted, which have a relatively higher impact on the dependent variable. Staying open on Sundays significantly lowers the probability of card acceptance, while giving detailed invoices increases it significantly. The rest of the variables have a low impact, similarly to value categories, and their marginal value is what we expected. Both the size of the chain and the number of stores increase card acceptance, albeit to a decreasing extent. By contrast, the dummy variable of stores with chain-level decisions shows the lowest value. This would imply that in Hungary, controlled for every other impact – primarily filtering out the impact of size-type variables – stores with chain-level decisions are less likely to become acceptors than independent stores. In the database, the level of card acceptance is high in stores with chain-level decisions, however, in their case the impact of size is more powerful. The results can be interpreted to imply that chains deciding to reject card acceptance are less likely, overall, to accept cards compared
Figure 3
Impact of turnover according to value category in the main model
–8 –6 –4 –2 0 2 4
–8 –6 –4 –2 0 2 4
1,000 10,000 100,000 1,000,000 10,000,000 100,000,000
0–1 thousand HUF transactions 1–5 thousand HUF transactions 5–10 thousand HUF transactions 10–20 thousand HUF transactions above 20 thousand HUF transactions
Note: Vertical axis: the impact calculated on the scale of explanatory variables, horizontal axis: annual turnover in HUF of categories of a given value on the logarithmic scale
to their size. All told we can conclude that the impact of other factors is small, and not comparable to the explanatory power of the annual turnover.
We only had the county codes of stores available for our analysis, so owing to the small number of observations we did not directly include information related to counties in the model. However, in a second step we assessed the coefficient of dummy variables belonging to the county, to determine to what extent they can be explained by the socio-demographic statistics available at county level. Including the capital city, there are 20 county codes in total; therefore, in view of the small sample size we did not estimate a regression and only examined the linear correlation.
Among the variables under review, the percentage of the working-age population, the number of municipalities and the number of residents per shopping centre indicate a medium-strong correlation. Contrary to expectations, development and income variables did not prove to be significant at any level. The correlation does not improve even after the omission of the capital city’s outstanding, outlier data point. Based on these, we can conclude that according to the available data no relationship can be shown to exist between the county-level composition of the community of buyers on the one hand, and card acceptance on the other. The coefficients do not change meaningfully even if we perform the estimate on the sub-sample of stores with independent decisions. However, considering the major socio-demographic variables, a significant variation can be observed even within one county, therefore the lack of a demonstrable relationship can also be derived from the level of aggregation. If there is any correlation at all, only a deeper – presumably municipality-level – segmentation would be able to identify it.
Since the high degree of multicollinearity between the variables renders the parameter estimates uncertain, we examined the significance and sign of the variable groups in various combinations. The main problem is caused by the fact that although most construed variables exhibit a strong correlation with store size, in some cases this correlation exists by definition – such as turnover broken down by value categories –, while in others it is empirical. To eliminate this discrepancy, we also ran the regressions without the size variables and studied the explanatory power of the rest of the variables. The results confirm that the proportion of the item numbers and value categories strongly correlates with size and takes over the role of size in the restricted model. The explanatory power of the model declines significantly without the direct use of the size variables. This suggests that the remaining variables are unable to take over a significant part of the explanatory power directly.
4.3. Impact of breakdown to sub-samples
We also included the cross products of other factors and the annual turnover in the regression, which became significant without exception. Based on these, the marginal impact is significantly different for stores of various sizes. The dummies generated according to chain-level decision are also highly significant in the model.
Therefore, in order to carry out the assessment of our research question we cut up the sample in the manner described in the previous chapter into small, medium and large stores, and re-estimated the regressions (Figure 4 and Annex 5).
The three estimated regressions perform to a medium extent on their own sub- sample, but the explanatory power deteriorates significantly, primarily for large- sized stores. In other words, the regression estimated on small and medium- sized stores is not applicable to large stores. The assessment of the parameters implies that it is mainly the impact according to the value category that differs to a significant extent depending on size. While in small- and medium-sized stores the turnover broken down according to value category only exerts a small impact, as described in the previous chapter, with large stores it improves the accuracy of the model significantly. In summary, it can be concluded that in a breakdown according to size, stores belonging to the largest category should clearly be treated separately. In stores with a large turnover, card acceptance can be explained well by the observed factors.
Figure 4
Classification characteristics of regressions estimated on sub-samples according to size (AUC)
0 10 20 30 40 50 60 70 80 90 100
0 10 20 30 40 50 60 70 80 90
Per cent Per cent 100
Big stores subsample Medium-sized stores
subsample Small stores subsample Big stores model
Medium-sized stores model Small stores model
We can also cut up the sample and the estimated models according to type of chain decision (Figure 5 and Annex 5). According to this kind of grouping, substantially higher differences can be observed in the explanatory power of the models. It can clearly be determined that different aspects should be applied for stores not belonging to a chain, to make a distinction between acceptor and non-acceptor stores, than for stores belonging to a chain. Based on the models, it can be concluded that the size of the chain explains card acceptance in the relevant stores to a significant extent, and we cannot treat them as individual stores.
4.4. Simulating the impacts of explanatory variables
The scale of the parameters of the logistic regression cannot be interpreted directly.
Therefore, simulation was used to analyse the effect of the different variables.
We prepared new estimates based on the model of the previous section, to run the simulation in such a way that we increased the value of each variable one by one by a total of 10 per cent, with all other variables remaining unchanged. In the case of the dummy variables we replaced the variables with the higher value, and the county variable was Budapest for all stores. The results of each simulation are shown by Figure 6. Turnover had the greatest impact both directly and indirectly through the cross-products. The coefficients of network turnover were comparable in magnitude. Of the dummy variables, Sunday opening and Monday closure significantly reduced the probability of card acceptance, while among the county variables, the effect of Budapest was outstanding.
Figure 5
Characteristics of matching regressions estimated on sub-samples according to chain-level decision
0 10 20 30 40 50 60 70 80 90 100
0 10 20 30 40 50 60 70 80 90
Per cent Per cent 100
Chain stores subsample Individual stores subsample Individual decision stores subsample Chain stores model
Individual stores model Individual decision stores model
5. Conclusion
In our study we examined payment card acceptance in the domestic retail sector based on a receipt-level, detailed dataset derived from online cash registers. The main objective of our research was to identify the primary explanatory variables and to test conventional card acceptance hypotheses.
For the purposes of our analysis, we relied on anonymised online cash register data provided by the National Tax and Customs Administration (NTCA) for the year 2016.
Covering an extremely broad section of the Hungarian retail sector, with nearly 3.8 billion data points, the database provides a basis for complex and robust analyses.
We tested store-level monthly aggregate data with county and network attributes.
Figure 6
Impact of main explanatory variables in the simulation
–5 –4 –3 –2 –1 0 1 2 3 4 5 6
–5 –4 –3 –2 –1 0 1 2 3 4 5
Per cent Per cent 6
Annual turnover Annual volume 0–1 thousand HUF transaction logarithm 1–5 thousand HUF transaction logarithm 5–10 thousand HUF transaction logarithm 10–20 thousand HUF transaction logarithm 20– thousand HUF transaction logarithm 0–1 thousand HUF transaction share 1–5 thousand HUF transaction share 5–10 thousand HUF transaction share 10–20 thousand HUF transaction share Chain volume Chain turnover Item number County – Budapest Sunday open Monday closed Tuesday closed Individual store Individual decision store Chain store Annual turnover indirect
According to our analysis, in line with international experiences, payment card acceptance can be mainly attributed to store size, which was approximated in our case with annual revenue. Revenue affects the card acceptance of mid-sized stores the most; the marginal effect is far lower in the case of small and large stores. It can be concluded from the results that the logistic function form does not necessarily characterise the relationship between size and acceptance properly, we need a more complex, polynomial form of function to describe the relationship appropriately.
In addition to its value, even the structure of the revenue influences card acceptance, albeit to a lesser degree. A store is more likely to accept payment cards if the bulk of its turnover is composed of transactions that have a higher expected card usage rate. The impact of value structure is very significant in the group of medium- sized and large stores, the extent of the impact is outstanding in the largest store category.
The opening hours of the business and, indirectly, its ownership structure, exert a similarly strong influence in card acceptance decisions; in the case of owner- operated stores, card acceptance is significantly lower. We found that the income of the customer base does not correlate significantly with card acceptance; however, for a more in-depth analysis of this issue the dataset should be broken down further than the county level.
The decomposition of the retail sector by network type and size does not improve the predictive power of the models significantly, but it has a moderate effect on all other significant variables, on several sub-samples. Based on these, we can state that it is stores not belonging to a chain and stores in the highest size category that differ significantly in terms of card acceptance, and these should be assessed separately in any case.
References
Arango, C. – Taylor, V. (2008): Merchant acceptance, costs, and perceptions of retail payments: a Canadian survey. Bank of Canada Discussion Paper, No. 2008–12.
Baxter, W.F. (1983): Bank Interchange of Transactional Paper: Legal and Economic Perspec- tives. Journal of Law and Economics, 26(3): 541−588. https://doi.org/10.1086/467049 Bolt, W. (2008): Consumer Choice and Merchant Acceptance of Payment Media. DNB Working
Papers No. 197, December, De Nederlandsche Bank.
Bolt, W. – Jonker, N. – van Renselaar, C. (2010): Incentives at the counter: An empirical analysis of surcharging card payments and payment behaviour in the Netherlands. Journal of Banking & Finance 34: 1738–1744. https://doi.org/10.1016/j.jbankfin.2009.09.008
Borzekowski, R. – Kiser, E.K. – Ahmed, S. (2006): Consumers’ Use of Debit Cards: Patterns, Preferences, and Price Response. Finance and Economics Discussion Series Divisions of Research & Statistics and Monetary Affairs Federal Reserve Board, Washington, D.C.
2006–16.
Humphrey, D. – Willesson, M. – Lindblom, T. – Bergendahl, G. (2003): What Does it Cost to Make a Payment? Review of Network Economics (2): 159–74.
https://doi.org/10.2202/1446-9022.1024
Jonker, N. (2011): Card acceptance and surcharging: the role of costs and competition. DNB Working Paper No. 300, May, De Nederlandsche Bank.
Keszy-Harmath, É. – Kóczán, G. − Kováts, S. – Martinovic, B. – Takács, K. (2012): The role of the interchange fee in card payment systems. MNB Occasional Papers 96.
Polasik, M. – Fiszeder, P. (2014): Factors determining the acceptance of payment methods by online shops in Poland. https://www.researchgate.net/publication/228867191_The_
acceptance_of_payment_methods_on_the_Polish_e-commerce_market. Downloaded:
23 May 2017.
Rochet, J.-Ch. – Tirole, J. (2003): An Economic Analysis of the Determination of Interchange Fees in Payment Card Systems. Review of Network Economics, 2(2): 69−79.
https://doi.org/10.2202/1446-9022.1019
Rochet, J.-Ch. – Tirole, J. (2007): Must-take cards and the Tourist Test. DNB Working Paper, no. 127, January, De Nederlandsche Bank.
Turján, A. – Divéki, É. – Keszy-Harmath, É. – Kóczán, G. – Takács, K. (2011): Nothing is free − A survey of the social cost of the main payment instruments in Hungary. MNB Occasional Papers, vol. 93.
Wright, J. (2003): Optimal Card Payment Systems. European Economic Review, 47(4):
587−612. https://doi.org/10.1016/S0014-2921(02)00305-7
Annex
Annex 1: Average element numbers of the sub-samples
Sub-samples according to size Sub-samples according to type
Small-sized stores 73,247 Stores with chain-level decision 61,996
Medium-sized stores 91,676 Individual stores 81,411
Large-sized stores 21,153 Stores with individual decision 42,670
Total 186,076 Total 186,076
Annex 2: Major characteristics of the database variables
Average Standard
error Minimum Maximum
Annual revenue orthogonal polynomial of the
first kind –5.1E–03 6.3E–03 –1.6E–02 2.9E–02
logarithm of the 0 to 1 thHUF category 6.3E+00 3.0E+00 –2.7E–03 1.6E+01 logarithm of the 1 to 5 thHUF category 6.4E+00 2.4E+00 –2.7E–03 1.6E+01 logarithm of the 5 to 10 thHUF category 3.9E+00 2.6E+00 –2.7E–03 1.4E+01 logarithm of the 10 to 20 thHUF category 2.7E+00 2.6E+00 –2.7E–03 1.3E+01 logarithm of the 20– thHUF category 2.0E+00 2.4E+00 –2.7E–03 1.3E+01
Average item number 1.9E+00 1.5E+00 0.0E+00 3.5E+02
Average payment value 6.7E+03 5.8E+04 1.0E+00 4.9E+07
ratio of the 0 to 1 thHUF category 4.3E–01 3.2E–01 0.0E+00 1.0E+00 ratio of the 1 to 5 thHUF category 3.6E–01 2.2E–01 0.0E+00 1.0E+00 ratio of the 1 to 5 thHUF category 9.0E–02 1.2E–01 0.0E+00 1.0E+00 ratio of the 10 to 20 thHUF category 5.6E–02 1.1E–01 0.0E+00 1.0E+00
Total revenue of the chain 1.8E+01 2.4E+00 1.5E+01 2.8E+01
Number of stores in the chain 5.8E+01 3.4E+02 1.0E+00 3.0E+03
Closed on Monday 1.8E–01 3.9E–01 0.0E+00 1.0E+00
Closed on Tuesday 1.4E–01 3.5E–01 0.0E+00 1.0E+00
Open on Sunday 6.6E–01 4.7E–01 0.0E+00 1.0E+00
Cross product closed on Monday 3.1E+00 6.5E+00 0.0E+00 2.4E+01
Cross product closed on Tuesday 2.4E+00 6.0E+00 0.0E+00 2.4E+01
Cross product closed on Sunday 1.1E+01 8.1E+00 0.0E+00 2.5E+01
Cross product number of stores in the chain 9.5E+02 5.4E+03 1.5E+01 5.8E+04 Cross product total revenue of the chain 3.1E+02 6.5E+01 2.1E+02 6.7E+02
Annex 3: Coefficients of the main models
Only the size, a consolidated on
sample
Only the size, monthly breakdown
Full model on a consolidated
sample
Entire model monthly breakdown
Cross products on the merged sample
Cross products monthly breakdown
Constant –13.068
(–8.174) –10.474
(–1.923) –12.492
(–0.050) –10.801
(–0.012) –27.552
(–0.111) –26.248 (–0.030) Annual revenue orthogonal
polynomial of the first kind 1,569.077
(9.016) 1,256.704
(2.115) 137.895
(43.194) 109.014
(9.716) –382.139
(–10.875) –287.557 (–2.144) Annual revenue orthogonal
polynomial of the second kind –1,573.727
(–7.816) –1,226.946
(–1.789) –63.635
(–38.029) –71.990
(–11.916) –160.482
(–64.993) –158.770 (–17.560) Annual revenue orthogonal
polynomial of the third kind 1,463.783
(8.069) 1,138.491
(1.836) 22.648
(15.388) 20.016
(3.948) 10.659
(5.786) 7.012 (1.084) logarithm of the 0 to 1 thHUF
category 0.039
(6.477) 0.037
(1.706) 0.016
(2.543) 0.015 (0.685) logarithm of the 1 to 5 thHUF
category 0.103
(9.602) 0.121
(3.114) 0.130
(11.961) 0.132 (3.365) logarithm of the 5 to 10 thHUF
category 0.124
(14.477) 0.085
(2.768) 0.110
(12.795) 0.073 (2.366) logarithm of the 10 to 20
thHUF category 0.045
(6.930) 0.033
(1.430) 0.038
(5.886) 0.021 (0.878) logarithm of the 20- thHUF
category 0.092
(17.804) 0.105
(5.641) 0.137
(26.033) 0.147 (7.699) square of the logarithm 0 to 1
thHUF category 0.020
(24.818) 0.025
(8.491) 0.024
(28.800) 0.028 (9.215) square of the logarithm 1 to 5
thHUF category –0.023
(–19.448) –0.020
(–4.633) –0.027
(–22.999) –0.023 (–5.302) square of the logarithm 5 to 10
thHUF category –0.027
(–22.693) –0.031
(–7.283) –0.026
(–21.481) –0.031 (–7.185) square of the logarithm 10 to
20 thHUF category 0.042
(34.785) 0.057
(12.929) 0.045
(36.764) 0.062 (13.861) square of the logarithm of the
20- thHUF category –0.041
(–35.834) –0.053
(–12.290) –0.052
(–43.241) –0.063 (–13.970)
Average item number –0.025
(–10.502) –0.037
(–4.341) –0.009
(–3.356) –0.023 (–2.412)
Average payment value 0.000
(–20.028) 0.000
(–4.198) 0.000
(–19.345) 0.000 (–4.161) ratio of the 0 to 1 thHUF
category –0.640
(–6.450) –1.544
(–4.366) –0.486
(–4.869) –1.317 (–3.702) ratio of the 1 to 5 thHUF
category –1.123
(–10.618) –1.913
(–5.042) –1.278
(–12.034) –1.964 (–5.158) ratio of the 5 to 10 thHUF
category 2.680
(20.558) 3.187
(6.824) 2.862
(21.806) 3.411 (7.248) ratio of the 10 to 20 thHUF
category 1.880
(17.003) 1.060
(2.740) 1.631
(14.732) 0.793 (2.044)
Only the size, on a consolidated
sample
Only the size, monthly breakdown
Full model on a consolidated
sample
Entire model monthly breakdown
Cross products on the merged sample
Cross products monthly breakdown square of the 0 to 1 thHUF
category ratio –3.682
(–41.924) –3.554
(–11.425) –4.036
(–45.505) –3.970 (–12.624) square of the 1 to 5 thHUF
category ratio 0.701
(7.568) 0.875
(2.659) 0.896
(9.654) 0.997 (3.027) square of the 5 to 10 thHUF
category ratio –6.377
(–30.918) –7.778
(–10.391) –6.776
(–32.481) –8.207 (–10.837) square of the 10 to 20 thHUF
category ratio –3.128
(–24.361) –2.716
(–6.180) –2.959
(–23.013) –2.526 (–5.731)
Total revenue of the chain –0.301
(–9.965) –0.481
(–4.184) 0.287
(0.990) 1.014 (0.916) Square of the entire revenue
of the chain 0.015
(19.271) 0.020
(6.844) –0.084
(–10.660) –0.098 (–3.244)
Number of stores in the chain –0.007
(–54.065) –0.010
(–17.006) 0.091
(68.225) 0.097 (14.733) Square of the number of stores
in the chain 0.000
(43.612) 0.000
(12.189) 0.000
(–45.599) 0.000 (–3.180)
Closed on Monday –0.661
(–58.244) –0.637
(–15.986) 0.200
(1.058) –0.529 (–0.798)
Closed on Tuesday –0.590
(–37.402) –0.735
(–12.278) 0.285
(1.115) –1.490 (–1.491)
Open on Sunday –0.134
(–22.699) –0.063
(–2.961) –0.822
(–9.821) –0.956 (–3.251)
County: Mobile shops –0.827
(–32.574) –0.841
(–9.056) –0.807
(–31.544) –0.822 (–8.799)
County: Bács-Kiskun 0.428
(30.770) 0.379
(7.743) 0.445
(31.897) 0.400 (8.163)
County: Baranya 0.162
(9.087) 0.099
(1.588) 0.169
(9.463) 0.106 (1.691)
County: Békés –0.466
(–27.580) –0.534
(–8.974) –0.465
(–27.464) –0.527 (–8.816)
County: Borsod-Abaúj-Zemplén –0.390
(–20.742) –0.457
(–6.868) –0.391
(–20.686) –0.451 (–6.744)
County: Budapest –0.134
(–8.023) –0.189
(–3.216) –0.138
(–8.240) –0.197 (–3.330)
County: Csongrád 0.145
(8.395) 0.105
(1.740) 0.144
(8.307) 0.114 (1.879)
County: Fejér 0.255
(14.371) 0.199
(3.193) 0.257
(14.462) 0.204 (3.272)
County: Győr-Moson-Sopron –0.372
(–22.301) –0.441
(–7.532) –0.375
(–22.405) –0.437 (–7.429)
County: Hajdú-Bihar –0.007
(–0.405) –0.050
(–0.857) 0.004
(0.223) –0.035 (–0.590)
Only the size, on a consolidated
sample
Only the size, monthly breakdown
Full model on a consolidated
sample
Entire model monthly breakdown
Cross products on the merged sample
Cross products monthly breakdown
County: Heves –0.007
(–0.400) –0.097
(–1.478) –0.010
(–0.519) –0.095 (–1.441)
County: Jász-Nagykun-Szolnok 0.394
(21.123) 0.327
(4.975) 0.398
(21.285) 0.337 (5.132)
County: Komárom-Esztergom –0.330
(–13.709) –0.383
(–4.531) –0.339
(–14.005) –0.391 (–4.588)
County: Nógrád 0.083
(5.569) 0.020
(0.383) 0.084
(5.621) 0.028 (0.529)
County: Pest –0.275
(–14.691) –0.286
(–4.232) –0.277
(–14.725) –0.286 (–4.217)
County: Somogy –0.697
(–39.108) –0.799
(–12.647) –0.703
(–39.251) –0.803 (–12.655) County: Szabolcs-Szatmár-
Bereg –0.181
(–9.912) –0.238
(–3.688) –0.183
(–9.963) –0.237 (–3.657)
County: Tolna –0.126
(–6.199) –0.208
(–2.911) –0.132
(–6.471) –0.210 (–2.933)
County: Vas –0.529
(–26.831) –0.621
(–8.880) –0.544
(–27.391) –0.630 (–8.953)
County: Veszprém 0.151
(8.651) 0.124
(2.002) 0.156
(8.934) 0.132 (2.123) County: Zala
Dummy variable 1st month of
2016 –0.254
(–24.314) –0.112
(–9.363) –0.111
(–9.245) Dummy variable 2nd month of
2016 –0.066
(–6.449) 0.027
(2.296) 0.030
(2.551) Dummy variable 3rd month of
2016 –0.048
(–4.661) 0.050
(4.326) 0.054
(4.644) Dummy variable 4th month of
2016
Dummy variable 5th month of
2016 –0.237
(–22.711) –0.101
(–8.509) –0.100
(–8.369) Dummy variable 6th month of
2016 –0.207
(–20.017) –0.115
(–9.808) –0.115
(–9.759) Dummy variable 7th month of
2016 –0.201
(–19.469) –0.073
(–6.239) –0.069
(–5.916) Dummy variable 8th month of
2016 –0.185
(–18.030) –0.076
(–6.525) –0.072
(–6.153) Dummy variable 9th month of
2016 –0.175
(–17.067) –0.059
(–5.096) –0.054
(–4.680) Dummy variable 10th month of
2016 –0.129
(–12.602) –0.024
(–2.038) –0.019
(–1.664)