Applied Surface Science 547 (2021) 149123
Available online 28 January 2021
0169-4332/© 2021 The Authors. Published by Elsevier B.V. This is an open access article under the CC BY license (http://creativecommons.org/licenses/by/4.0/).
Full Length Article
The impact of Au nanoparticles and lanthanide-doped NaYF 4 on the photocatalytic activity of titania photocatalyst
B. Hampel
a,b, K. Hernadi
a,c,*, L. Baia
b,d,e, Zs. Pap
a,b,e,*aDepartment of Applied and Environmental Chemistry, University of Szeged, Rerrich B´ela sqr. 1, HU-6720 Szeged, Hungary
bNanostructured Materials and Bio-Nano-Interfaces Center, Institute for Interdisciplinary Research on Bio-Nano-Sciences, Babes¸–Bolyai University, Treboniu Laurian str.
42, RO-400271 Cluj-Napoca, Romania
cInstitute of Physical Metallurgy, Metal Forming and Nanotechnology, University of Miskolc, HU-3515 Miskolc-Egyetemv´aros, C/1 108, Miskolc, Hungary
dFaculty of Physics, Babes¸−Bolyai University, Mihail Kog˘alniceanu str. 1, RO-400084 Cluj− Napoca, Romania
eInstitute for Research, Development and Innovation in Applied Natural Sciences, Babeș-Bolyai University, Fˆantˆanele 30, RO-400294 Cluj-Napoca, Romania
A R T I C L E I N F O Keywords:
NaYF4
Lanthanide doping Titania Gold nanoparticles Photocatalysis
A B S T R A C T
Composite systems were prepared by doping NaYF4 (NYF) with lanthanide cations (Yb3+, Er3+, Tm3+), TiO2, and gold nanoparticles to exploit the light conversion properties of NYF and its possible impact on the photocatalytic activity of the composites. The composites were synthesized via solvothermal crystallization and the obtained structures were anatase TiO2, hexagonal NYF, and gold nanoparticles of 5–7 nm. The presence of NYF enhanced the photoactivity of TiO2 towards Rhodamine B degradation under UV irradiation, while it decreased its per- formance under visible light. The presence of Au was beneficial when visible light was applied for the degra- dation experiments. The reason behind the enhanced activity was the fluorescence of NYF at 400 nm that was the most intense for the composites that did not contain gold. The NYF-based samples also showed signs of up- conversion when 900 nm was the excitation light source, highlighting the potential of this material for photo- catalytic applications that utilize the full (UV–IR) light spectrum.
1. Introduction
Considerable research is currently focused on the most widely studied and used semiconductor photocatalyst, titanium dioxide (TiO2) [1], which is the most promising candidate due to its improved photo- catalytic performance [2]. It is naturally occurring, non-toxic, chemi- cally-, thermally- and photostable, has excellent electronic, optic and catalytic properties, and is affordable [3]. Over the past decades, it has been used in a wide variety of applications such as lithium ion batteries [4], self-cleaning surfaces [5], dye-sensitized solar cells [6], Na-ion batteries [7], and as photocatalyst for water purification [8].
Titanium dioxide has been utilized as a photocatalyst [9] starting from the ’70s. It can be used for sterilization, wastewater treatment, and for the photocatalytic oxidation of organic pollutants or other contam- inants such as pesticides, drug residues, polyaromatic hydrocarbons, various heavy metals (mercury, lead, cadmium, etc.) or even arsenic [10]. TiO2 can only be excited efficiently by UV photons, which limits its
visible light applicability. Therefore, demand has arisen to extend its excitability to the visible light range and/or to increase the charge separation efficiency [11].
However, titania might also exhibit photoactivity under visible light irradiation using appropriate co-catalysts or by coupling it with semi- conductors of narrower band gap [12]. Common co-catalysts include noble metals, such as Ag [13], Au [14], Pd [15] and Pt [16] or even non- metallic elements, such as S [17] and N [18], however the latter ones are mostly considered as dopants. According to several studies, metal ion (Fe2+, Cu2+) incorporation and dye sensitization have proved to be the most effective methods to expand the excitability of titania-based pho- tocatalysts to the visible light region [19].
Upconversion describes a nonlinear process, where two or more photons are absorbed consecutively, which results in the formation of real intermediate energy states, thus light is emitted with a wavelength shorter than the absorbed light’s due to luminescence [20]. Lanthanide- doped particles are able to convert long wavelength radiation (near
* Corresponding authors at: Department of Applied and Environmental Chemistry, University of Szeged, Rerrich B´ela sqr. 1, HU-6720 Szeged, Hungary (K. Hernadi and Zs. Pap). Institute for Research, Development and Innovation in Applied Natural Sciences, Babeș-Bolyai University, Fˆantˆanele 30, RO-400294 Cluj-Napoca, Romania (Zs. Pap).
E-mail addresses: hernadi@chem.u-szeged.hu (K. Hernadi), pzsolt@chem.u-szeged.hu, zsolt.pap@ubbcluj.ro (Zs. Pap).
Contents lists available at ScienceDirect
Applied Surface Science
journal homepage: www.elsevier.com/locate/apsusc
https://doi.org/10.1016/j.apsusc.2021.149123
Received 13 August 2020; Received in revised form 18 January 2021; Accepted 22 January 2021
infrared - NIR) to short wavelength (UV, visible) radiation [21]. These materials usually are composed of an inorganic matrix (i.e. NaYF4), in the role of the host and trivalent lanthanide ions, which are present in the host’s crystal lattice [22]. Fluorides have low phonon energies and are highly stable, thus they are the most frequently used [23]. Two crystalline phases of NaYF4 are known: hexagonal and cubic. Due to their low photon energy and chemical stability, hexagonal nanocrystals have enhanced luminescent properties and they are formed only at high reaction temperatures, unlike cubic structures that are formed at low temperatures. For optical applications the hexagonal structure is preferred over the cubic structure because it provides better photo- luminescent properties [24].
These upconverting elements are often used to make various fluo- rescent materials. They can be used as fillers to make luminescent polymer films and luminescent inks, for example, against counterfeiting of money and documents [25]. NaYF4-TiO2 double-shell photocatalysts have already been synthesized by hydrothermal method, enabling the absorption of both UV and visible light [26].
Composites can be formed containing the upconverting materials and TiO2. Titanium dioxide can utilize the upconverted photons, thus exploit a greater proportion of the light spectrum (e.g. sunlight) at the same time. Lanthanide-doped NaYF4 exhibits photoluminescent prop- erties in the UV and NIR ranges, which can also contribute to the enhancement of the photoactivity [27,28]. In addition to titanium- dioxide, further semiconductors can be used beside the upconversion nanoparticles, such as CdS [29] or graphitic carbon nitride (g-C3N4) [30].
Gold nanoparticles can not only improve the photocatalytic activity (by increasing the lifetime of electron-hole pairs), but they also exhibit surface plasmon resonances (SPR) [31]. This phenomenon can be uti- lized in photocatalysis, because the SPR-induced electrons can be directly injected into the conduction band of TiO2 [32], thus the TiO2-Au composites can exhibit photocatalytic activity under visible light irradiation.
The beneficial properties of the above-mentioned materials have provided the basis of the present research. The main idea was to syn- thesize ternary composites containing lanthanide-doped NaYF4, which can convert the visible/NIR light to shorter wavelengths that can be used by TiO2 and Au nanoparticles. With this method, the beneficial prop- erties of all three components can be exploited simultaneously. The special interest for the present research can also be derived from the extremely small number of papers published in the last 45 years in this topic (i.e., only 12 publications, based on Web of Science; 7 deals with photocatalysis, mostly NIR-driven, 2 with dye-sensitized solar cells, and the others deal with either oxidation reactions, H2 production, or improvement in up-conversion luminescence).
2. Experimental section 2.1. Materials
During the experiments, the following materials were used without further purification: trisodium citrate (Na3C3H5O(COO)3, 99.99% pu- rity; Alfa-Aesar) as 0.5 mmol⋅L−1 and 0.63.10−4 mol⋅L−1 aqueous solu- tions; Y(NO3)3 (0.5 mol⋅L−1), Yb(NO3)3 (0.5 mol⋅L−1), Er(NO3)3 (0.01 mol⋅L−1), and Tm(NO3)3 (0.01 mol⋅L−1) stock solutions (all purchased from Alfa Aesar, 99.9%); NaF (Fluka AG); urea (CH4N2O, 99.4% Molar);
isopropanol (C3H8O, 100%, VWR); diethylenetriamine (DETA, C4H13N3, Sigma-Aldrich); titanium isopropoxide (97%, Ti[OCH(CH3)2]4, Aldrich); HAuCl4 as a 25.4 mmol⋅L−1 (99.99%; trace metal basis, Sigma- Aldrich); sodium borohydride (NaBH4; 96% purity; acquired from Merck) as a solution of 0.15 mol⋅L−1; Milli-Q water; and ethanol (C2H5OH, VWR).
2.2. Synthesis methods
2.2.1. Synthesis of the lanthanide-doped NaYF4
The NYF samples were prepared by adding 1.488 mL Y(NO3)3 (0.5 M), 0.5 mL Yb(NO3)3 (0.5 M), 0.1 mL Er(NO3)3, 0.5 mL Tm(NO3)3 stock solutions to 15 mL of 0.5 mM trisodium-citrate. After stirring for 1 h, 4 mmol of NaF and 20 mmol of urea were added and stirred again for 1 h with a magnetic stirrer. The sample was then placed in a Teflon® lined autoclave for 12 h at 180 ◦C. As the autoclave cooled to room temper- ature, the sample was separated and washed by centrifugation (5 ×5 min, 4400 rpm), 3 times with 40 mL ethanol and 2 times with 40 mL distilled water. Finally, the sample was dried for 12 h at 40 ◦C in an oven.
2.2.2. Synthesis of the lanthanide-doped NaYF4-TiO2 composites 0.05 g of the previously prepared NaYF4 was dispersed in 42 mL of isopropanol and then 0.04 mL of diethylenetriamine (DETA) was added.
After stirring for 10 min, 2 mL of 97% titanium isopropoxide was added.
After mixing, the sample was hydrothermally treated for 24 h at 200 ◦C in a Teflon® lined autoclave. The as-formed composite was separated and washed by centrifugation using 40 mL ethanol (3 ×5 min, 4400 rpm). Then it was dried in an oven at 40 ◦C for 12 h [11]. In certain cases, calcination was carried out at 350 ◦C for 2 h at a heating rate of 5 ◦C/min. The TiO2 reference sample was synthesized by carrying out the same steps, just without adding NaYF4 to the system.
2.2.3. Synthesis of composites decorated with Au nanoparticles
For the synthesis of the Au-containing composites 495 mg of the previously prepared sample was added to 20 mL of Milli-Q water. Then, 1.62 mL of Na-citrate solution (0.63⋅10−4 mol⋅L−1) was added under continuous magnetic stirring, followed by 0.21 mL of HAuCl4 (25.4 mmol⋅L−1) after 30 min, and 0.26 mL of freshly prepared NaBH4 solution (0.15 mol⋅L−1) after another 30 min. This mixture was stirred for another half hour. After that it was dried in an oven for 12 h at 40 ◦C, then washed by centrifugation with 40 mL of Milli-Q water (3 ×15 min, 4400 rpm), and finally dried again at 40 ◦C for 12 h. In all cases the Au content was 1 wt%, which was based on the fact that in the literature the 1–2% Au content proved to be the most beneficial to improve the pho- tocatalytic activity [33]. During the synthesis only the reduction of Au took place, because it is not possible to reduce the Ti in TiO2, because this process needs extremely high temperature and inert atmosphere [34].
3. Nomenclature of the composites
Lanthanide-doped NaYF4 was abbreviated as NYF. If the TiO2 or the NYF-TiO2 composite was calcinated it is marked with ‘_calc’. The order of the components indicates the order of the synthesis (for example:
NYF-TiO2_calc means that the NYF was synthesized firstly, then a com- posite was formed with TiO2, then finally it was calcined).
Based on the methods described above, the following materials were prepared:
• NYF
• TiO2
• TiO2_calc
• TiO2-Au
• TiO2_calc-Au
• NYF-TiO2
• NYF-TiO2_calc
• NYF-TiO2-Au
• NYF-TiO2_calc-Au
The theoretical composition of the composites was 99:1 wt% for TiO2-Au; 28:71:1 wt% for NYF-TiO2-Au and 28.5:71.5 wt% for NYF- TiO2.
3.1. Characterization methods and instrumentation
The crystalline phase compositions and mean primary crystallite sizes of the photocatalysts were determined by X-ray diffraction (XRD) with a Rigaku diffractometer using Cu-Kα radiation (λ = 1.5406 Å) equipped with a graphite monochromator. The primary crystallite size of the prepared semiconductors was evaluated using the well-known Scherrer equation [35].
The morphological properties were investigated by transmission electron microscopy (TEM). TEM micrographs were obtained using a FEI Tecnai G2 20 X-Twin HRTEM instrument to determine the compo- sition of the samples.
During the scanning electron microscopy (SEM) measurements a Hitachi S-4700 Type II FE-SEM was used to determine the average particle size and morphology of the samples. The applied acceleration voltage was 10.0 kV.
The BET method was used to calculate the specific surface areas of the composite samples, for which a BELCAT-A device was used to record the isotherms at 77 K via N2 adsorption.
Fluorescence emission measurements were carried out at room temperature using an epifluorescence accessory (EFA 383 module) for Jasco LP-6500 spectrofluorometer with a 1 nm spectral resolution, equipped with a Xenon lamp as excitation source, using excitation and emission bandwidths of 3 nm. Fluorescence spectra were recorded in the wavelength range of 200–900 nm employing a fixed excitation wave- length at 365, 550, and 900 nm.
In the case of diffuse reflection spectroscopy (DRS) the light ab- sorption properties of the solid samples were measured. The spectra of the samples (λ =300–800 nm) were registered by using a JASCO-V650 spectrophotometer with an integration sphere (ILV-724). The indirect band gap of the photocatalysts was determined via the Kubelka-Munk method [36].
Photocatalytic activities of the composites were determined by the decomposition of Rhodamine B solution under UV- (λmax =365 nm), visible light (λ >400 nm) and near infrared irradiation (NIR, λ >850).
The reactor was surrounded either by 6 ×6 W black light lamps (9.53 W/m2 energy flux at the reactor position) or 4 ×24 W conventional compact fluorescent lamps (Düwi 25920/R7S-24 W; 81.37 W/m2 energy flux at the reactor position), or 4 ×150 W NIR lamps (Philips IR RED R250 250 W; 52.25 W/m2 energy flux at the reactor position). Then a Rhodamine B stock solution (10 μmol⋅L−1) and a 1 g⋅L−1 photocatalyst
suspension were prepared. An ultrasonic bath was used to distribute the catalyst more efficiently, then the system was stirred for 15 min in dark for adsorption to occur, after that the photocatalytic degradation reac- tion was initiated by turning on the lamp (either UV–visible- or NIR- light-emitting, with the above-mentioned wavelengths). In the case of the NIR tests the water was supplemented for each 2 h (except night), while the experiment length was 24 h. During the UV and visible light driven experiments continuous magnetic stirring was applied. 2 mL of the samples were taken every 10 min (1 h in NIR) in the first hour (6 h NIR and one sample 2 h later and the last sample before finishing the experiment) of the experiment and every 20 min in the second hour.
After the centrifugation (3 min, 13,800 rpm) and filtration (with a Whatman Anotop 25 0.02 µm syringe filter) of the samples, the Rhodamine B concentrations were measured. UV–Vis measurements were performed using a JASCO-V650 spectrophotometer, using distilled water as reference. A pre-prepared calibration curve of the Rhodamine B solution was applied to determine the actual concentrations at 553 nm.
4. Results and discussion 4.1. X-Ray diffraction
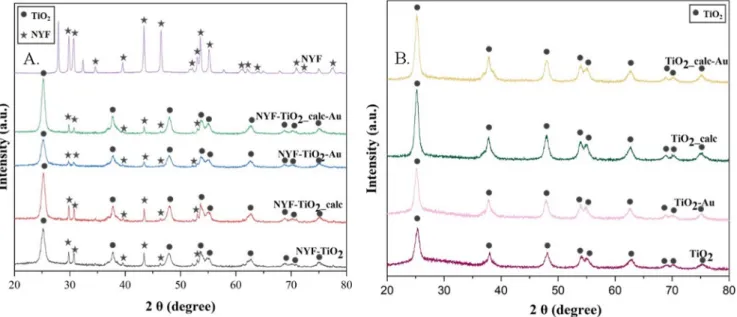
Based on the XRD measurements anatase TiO2 (JCPDS: 21-1272) and hexagonal NaYF4 [37] (JCPDS: 28-1192) were identified (Fig. 1). XRD patterns of the composites containing NYF, TiO2 and gold nanoparticles are presented in Fig. 1A, while the patterns of the samples without NYF are shown in Fig. 1B. The dots above the patterns indicate the reflections of TiO2, while the stars indicate the reflections of NYF. There is a min- imal difference between the diffraction patterns of the calcined and non- calcined composite samples. In the latter, the peaks are sharpened, indicating an increase in the mean primary crystallite sizes (for example, TiO2-10.7 nm, TiO2_calc-13.8 nm), that were calculated with the Scherrer equation and summarized in Table 1.
Gold nanoparticles (JCPDS: 04-0784) were not detectable in the Au- containing composites, because their concentration was lower than the detection limit of the instrument, moreover, the gold-specific signals (38◦, 45◦, 64.5◦and 77.5◦) overlap with reflections of both TiO2 and NaYF4. The XRD pattern of the calcined TiO2-NaYF4 composite was used to calculate the TiO2:NaYF4 ratio of 71.6:28.4 taking the two most intensive reflections at 25.28◦ (2θ) for TiO2 and 53.6◦(2θ) for NaYF4
into account.
Fig. 1.A. XRD patterns of the composites containing both NYF and TiO2. The reflections of both materials can be observed, while the reflections of Au nanoparticles were not detectable. B. XRD patterns of the composites without NYF. The dots indicate the reflections of TiO2, while the stars indicate the reflections of NYF.
Based on the data in Table 1 it can be seen that the mean primary crystallite size of the TiO2 and NaYF4 increases, while their specific surface area decreases, as expected.
4.2. Scanning electron microscopy
Based on the SEM micrographs of the NYF particles, they have an average length of 5.8–6.8 µm and an average width of 3.2–3.8 µm Table 1
Primary crystallite mean size, the specific surface area, band gap energy of the composites and the degradation efficiencies under UV and visible light for the investigation samples.
Sample name TiO2
(nm) NaYF4
(nm) Specific surface area (m2/g)
Band gap energy (eV)
Surface Degradation efficiency under UV light (%)
Degradation efficiency (UV) (mM/m2)
Degradation efficiency under Vis light (%)
Surface Degradation efficiency (Vis) (mM/
m2)
NYF – 15.3 25 1.07 13.2 0.528 8.2 0.328
TiO2 10.7 – 155 1.82 17.3 0.111 99.8 0.643
TiO2_calc 13.8 – 133 2.97 48.2 0.362 62.0 0.466
TiO2-Au 12.9 – 163 2.56 23.2 0.142 94.7 0.58
TiO2_calc-Au 13.8 – 126 2.74 63.7 0.505 86.4 0.685
NYF-TiO2 12.5 11.5 123 1.82 49.7 0.404 84.8 0.689
NYF-TiO2_calc 13.3 12.2 112 3.09 86.0 0.767 82.8 0.739
NYF-TiO2-Au 11.6 11.1 135 2.52 48.2 0.357 67.8 0.502
NYF-TiO2_calc-
Au 14.7 12.8 88 2.87 75.5 0.857 73.2 0.83
Fig. 2.SEM micrographs of the prepared photocatalysts: the first column contains the base catalysts, while the second column contains their heat-treated coun- terparts. In the third column the EDAX spectrum of the sample named NYF-TiO2_calc-Au can be seen. All of the constituent elements are present in the composite.
(Fig. 2). It can be observed that a NYF particle has a hollow prism structure with 6 flat surfaces. The calculated mean crystallite sizes derived from the XRD data differ from those determined based on the micrographs, because the Scherrer equation is accurate only for smaller particle sizes (10–80 nm). From the SEM micrographs of TiO2 and the calcined TiO2 the following conclusions can be drawn: TiO2 has an average particle size of 1.5–2.5 µm, the calcination induces a particle size growth, increasing the average size to 4.5–5.5 µm. A similar alter- ation of the mean primary crystallite size was also obtained from the XRD data.
In Fig. 2 the left column shows the NYF, TiO2 and NYF-TiO2 com- posite particles, and the right column their calcined counterparts. After calcination the particles that build up the composites have grown, in accordance with the results of the XRD pattern analysis. In addition, these particles have a uniform, smoother surface compared to the samples before calcination. Both spherical and hexagonal particles were formed as it can be seen in the micrographs. Moreover, the structure of the NYF particles is damaged, while irregularly deposited individual TiO2 crystals can also be found. Furthermore, the effect of calcination does not affect the hollow prism structure of NYF in the composite. The gold nanoparticles cannot be seen in these micrographs, because they are too small to be detected by SEM. Therefore, EDAX and TEM was used to prove their presence.
In Fig. 2 in the third column the EDAX spectrum of the sample named NYF-TiO2_calc-Au is presented. All of the constituent elements are pre- sent in the composite, therefore the synthesis can be considered successful.
4.3. Transmission electron microscopy
Based on the TEM micrographs the gold nanoparticles can clearly be observed as small spheres in the TiO2-Au, NYF-TiO2-Au samples, and in their calcined counterparts. Fig. 3 shows a representative TEM micro- graph of the NYF-TiO2_calc-Au composite sample, where the gold nanoparticles are marked with arrows. The average size of the gold nanoparticles was 5–7 nm, while the average size of TiO2 particles is 12–14 nm (see Fig. 4; matching with the calculated results from XRD). A
relatively good dispersion of Au NPs inside the composite can also be observed that ensure the existence of a high number of TiO2-Au contact points, and consequently improve the degradation efficiency of the samples that contain Au in comparison with those without Au (Table 1).
4.4. Specific surface area - nitrogen adsorption
The specific surface area of the composite samples was determined by nitrogen adsorption and the results are shown in Table 1 and Fig. 5.
Fig. 3.TEM micrograph of NYF-TiO2_calc-Au: the arrows indicate the positions of the Au nanoparticles, which have spherical shape and an average size of 5–7 nm.
A.
B.
2 3 4 5 6 7 8 9 10 11
0 5 10 15 20 25
Frequency (%)
Particle size (nm)
8 9 10 11 12 13 14 15 16 17 18
0 5 10 15 20 25
Particle size (nm)
Frequency (%)
Fig. 4.Particle size distribution curve for Au (A) and TiO2 (B) nanoparticles.
The average size of Au being 5–7 nm, while for TiO2 12–14 nm.
Fig. 5.The specific surface area of the composite samples determined by ni- trogen adsorption.
TiO2-Au (163 m2/g) exhibited the highest specific surface area, while NYF (25 m2/g) the smallest one. Furthermore, the effect of calcination is also observed here, namely the specific surface area of the samples decreased as the particle size increased. As expected, when a material with lower specific surface area is combined with a sample with higher specific surface area, the resulting specific surface area will be in be- tween those two values [38], as it was the case in this study. The pres- ence of gold facilitated crystallization, therefore it has resulted in the decrease of the specific surface area [39].
4.5. Diffuse reflectance spectroscopy
The optical properties were investigated by DRS measurements. As it can be seen in Fig. 6 the reflectance values in the visible light region are higher for the calcined samples that do not contain gold nanoparticles.
The characteristic plasmonic resonance bands, which appear due to the presence of gold nanoparticles, can be observed at ~500 nm in all composites that contain Au, further reinforcing its presence. Addition- ally, UV–visible spectroscopy measurements were carried out. In Fig. 7 the UV–visible spectrum of the gold nanoparticles is presented. The absorption band at ~500 nm appears due to the surface plasmon reso- nance of the Au nanoparticles [40].
The band gap energies were calculated using the Kubelka-Munk equation and the results were listed in Table 1. In all cases, the calci- nation has led to the increase of the band gap energy values, implying that these samples became more crystalline. Interestingly, if a sample was not calcined, the loading of gold resulted in the increase of the band gap energy value, and if a gold-containing sample was heat treated then its band gap energy decreased. Another interesting result is the band gap energy of TiO2, which was calculated to be 1.82 eV.
4.6. Photocatalytic activity under UV light
From the initial and final concentrations of Rhodamine B the degradation efficiency was calculated for the prepared samples, and these values are summarized in Table 1. Results show that among the obtained materials NYF-TiO2_calc has the highest (86%) decomposition efficiency. Thus, the following order can be established: NYF-TiO2_calc- Au (75.5%), TiO2_calc-Au (63.7%), NYF-TiO2 (49.7%), NYF-TiO2-Au (48.3%), TiO2_calc (48.2%), TiO2-Au (23.2%), TiO2 (17.3%) and NYF has the lowest degradation efficiency (13.2%).
Furthermore, it can be observed that the calcined counterpart of a composite has a higher efficiency, for example, NYF-TiO2_calc has an efficiency of 86%, while for the corresponding non-calcined composite
(NYF-TiO2) this value is 49.7%. Calcination promoted crystallization (crystalline anatase is formed), thus increased the photocatalytic activ- ity [34]. The presence of gold in some composites improved the pho- tocatalytic activity, which could be explained as a result of charge separation [41].
4.7. Photocatalytic activity under visible light
Similarly to the photocatalytic experiments under UV light, the visible light-degradation efficiency was calculated from the initial and final Rhodamine B concentrations, and these values are also summarized in Table 1 and Fig. 8B. From the results it can be concluded that the prepared composites achieved higher activity in visible light than in UV light. Except for NYF, which had negligible photocatalytic activity (just 8.2%), all composites showed degradation efficiency higher than 60%.
TiO2 decomposed almost all of the Rhodamine B even after 60 min and its final efficiency was 99.8%, which can be explained by the fact that the band gap energy of TiO2 is 1.8 eV (already discussed in more detail in Section 3.5). This value was followed closely by TiO2-Au, with an efficiency of 94.7%. TiO2_calc-Au, NYF-TiO2, and NYF-TiO2_calc had almost the same photocatalytic activity with degradation efficiencies of 86.4%, 84.8%, and 82.8%, respectively. NYF-TiO2_calc-Au (73.2%), NYF-TiO2-Au (67.8%) and TiO2_calc (62%) achieved similar degrada- tion results as well. Calcination did not have such a significant impact on the degradation as in the previous case using UV light irradiation:
calcination increased the activity only for NYF-TiO2-Au (from 67 to 73%). With the deposition of gold nanoparticles, an increase in the ac- tivity was expected, however, the presence of gold increased the effi- ciency only for the TiO2_calc sample (from 62% to 86.4%). On the other hand, it is worth pointing out that there is no significant difference be- tween the samples with or without Au. Since TiO2 had the best photo- catalytic activity, one can ask why is it worth to deal with the composites? The answer regarding this question lies within the fact that an elucidated mechanism can be provided which can result in further strategies which could lead to higher photocatalytic activity.
4.8. Photoluminescence measurements and the origin of activity-possible photocatalytic mechanisms
The fluorescence measurements were carried out using λ =365 nm and 900 nm light as the excitation source, because the photocatalytic experiments were also carried out at this wavelength. It should be taken in consideration, that the fluoresce in correlation with the measured photoactivity values are giving indirect evidence about the importance of each component and their optical properties. The following key ob- servations were made:
Fig. 6. DRS spectra of the prepared samples.
300 400 500 600 700 800
0.0 0.5 1.0 1.5 2.0 2.5
Absorbance
Wavelength (nm)
Fig. 7. UV–visible spectrum of the gold nanoparticles.
•when NYF was present in the samples an emission at 460 nm was found, and an asymmetric emission band around 400 nm was also observed. This was the strongest when sample NYF-TiO2_calc was used. It seems that a down-conversion occurs in these samples, but the emitted light is in the border of UV-A and visible light, that is why under UV irradiation this composite shows high activity.
•Moreover, when Au was deposited the band at 460 nm got weaker, while the one at 400 nm nearly disappeared. As the light emitted at 460 nm was not utilizable by any of the components, the obtained activity for NYF-TiO2_calc-Au was lower. When the excitation wavelength was changed to 550 nm, no additional fluorescence was observed, therefore the above-registered activity trends were inde- pendent from the fluorescence properties of NYF. That is why the best activity was achieved for the TiO2-Au sample under visible light irradiation.
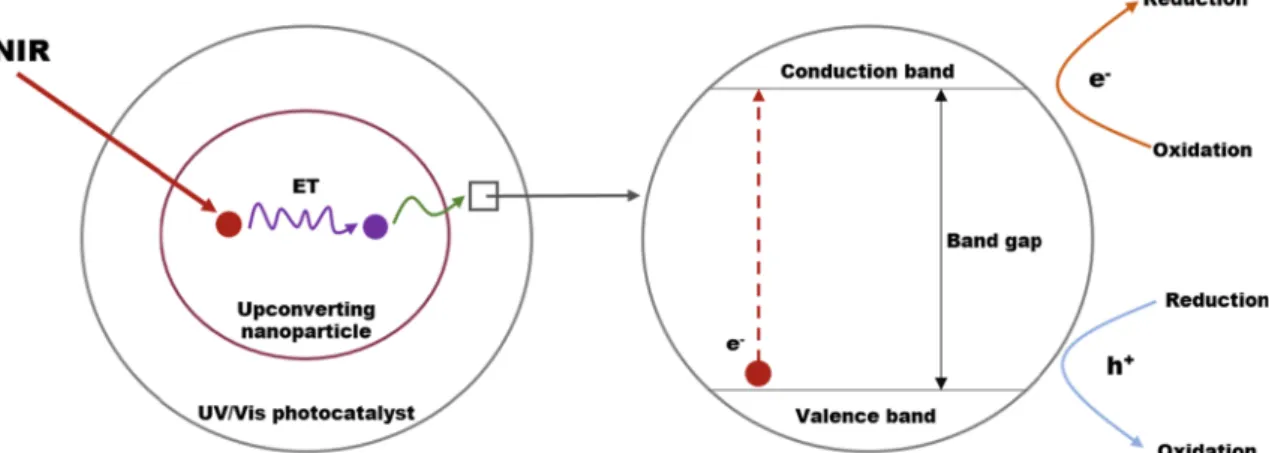
•Nevertheless, when the excitation wavelength was changed to 900 nm the band at 400 and 460 nm reappeared, pointing out the possible activation of this catalyst under infrared irradiation. For this mechanism to happen the system must go through a set of more complex processes. First, the 2F7/2→ 2F5/2 transition must happen in order to absorb the NIR light. For this to happen, Yb3+ is the responsible specie. The emission band at 400 nm must be the result of the 1D2→ 3H6 transition of Tm3+with the possibility of cross relaxing, as the expected wavelength would be around 365 nm. This observation was made by others as well [42]. However, this slight 40 nm difference could originate from the higher energy excitation at 900 nm instead of 980 nm or above. The band at 460 nm seems to
originate from Tm3+, as well as from the 1D2→ 3F4 transition, meaning that Er3+does not participate in the up-conversion cycle.
However, Au could absorb the emitted wavelength above 500 nm, making this transition invisible, while resulting in an electron in- jection into the conduction band of TiO2. This finding means that NIR photons can indeed be utilized, however, the buildup of the light path must be carefully developed to maximize the efficiency of this process. Experimental evidence of the NIR activity, with the mech- anism proposed above and illustrated in Fig. 9 was gathered for all the samples. Only in case of sample (NYF-TiO2_calc_Au) a 12.5% of degradation was observed (Figure S1). Although, the degradation value seems quite small, it should be mentioned that even such an amount is a great advance, proving that NIR photoactivity is achievable.
To explain the photoactivity, the above-mentioned excitation sce- narios can be considered, while not entering in-detail the formation of Rhodamine B degradation intermediates and mechanisms (the usual degradation mechanism, driven by direct hole oxidation and OH radical driven degradation). Under UV irradiation, the photoactivity of pure titania can be considered, while a substantial reemission by NaYF4 en- hances the activity, by maximizing the overall photon flux, which enters in contact with TiO2. Interestingly, in case of visible light irradiation the NYF component was inactive, most probably due to the fact that Au was localized mostly on TiO2, while the latter is not excitable under visible light irradiation. The upconversion mechanism was noticed when car- rying out the fluorescence measurements at 900 nm, namely the emis- sion bands at UV and visible light reappeared making possible the excitation pathway detailed in Fig. 9.
Interestingly, if the degraded Rhodamine B was normalized to the available specific surface area the most efficient catalyst would be NYF- TiO2_calc-Au (Table 1). This shows that the surface quality of this composite is good (the necessary amount of surface defects and cata- lytically active centers), but due to the lower specific surface area the reemitted light amount and the available surface for the mass transfer is low, thus synthesizing this sample with higher specific surface area shows great potential.
5. Conclusions
In the presented research, composites were synthesized from TiO2, lanthanide-doped NaYF4, and Au nanoparticles. Based on the XRD re- sults hexagonal NaYF4 and anatase TiO2 were obtained. The calcination of the samples increased the primary crystallite sizes. The obtained NYF particles had an average length of 5.8–6.8 µm and an average width of 3.2–3.8 µm, while TiO2 had an average particle size of 1.5–2.5 µm, the latter one being a hierarchical structure. The presence of gold nano- particles was proved by TEM, and their average particle size was in the range of 5–7 nm. The specific surface area of the composite samples was determined by nitrogen adsorption. The results showed that TiO2-Au (163 m2/g) had the highest specific surface area, while NYF (25 m2/g) had the smallest one. The photocatalytic activity was investigated by Rhodamine B degradation. The presence of NYF enhanced the photo- activity, but only under UV illumination. The presence of Au was not beneficial under UV irradiation, only in the case of visible light experi- ments, while NYF proved to be active in upconversion under NIR irra- diation, achieving 12.5% of degradation.
CRediT authorship contribution statement
B. Hampel: Investigation, Writing - original draft, Conceptualiza- tion. K. Hernadi: Writing - review & editing. L. Baia: Supervision, Writing - original draft. Zs. Pap: Funding acquisition, Writing - review &
editing.
B.
A.
23.22 63.68 48.30 75.49 13.20 49.72 86.02 17.25 48.15
0 20 40 60 80 100
Degradation efficiencyafter 2 hours (%)
TiO2-Au TiO2_calc-Au NYF-TiO2-Au NYF-TiO2_calc-Au
NYF NYF-TiO2
NYF-TiO2_calc TiO2 TiO2_calc
TiO2_calc-Au NYF-TiO2_calc-Au NYF-TiO2 TiO2 TiO2-Au
NYF-TiO2-Au NYFNYF-TiO2_calc TiO2_calc
94.74 86.48 67.86 73.22 8.22 84.80 82.81 99.84 62.08
0 20 40 60 80 100
Degradation efficiency after 2 hours (%)
TiO2-Au TiO2_calc-Au
NYF-TiO2-Au
NYF-TiO2 NYF-TiO2_calc TIO2 TiO2_calc
TiO2_calc-Au NYF-TiO2_calc-Au NYF-TiO2
TiO2 TiO2-Au
NYF-TiO2-Au NYFNYF-TiO2_calc TiO2_calc
Fig. 8.Photocatalytic activity of the composites: A. under UV light, B. under visible light.
Declaration of Competing Interest
The authors declare that they have no known competing financial interests or personal relationships that could have appeared to influence the work reported in this paper.
Acknowledgements
Zs. Pap would like to thank for the financial support of the Hungarian Academy of Sciences – Bolyai J´anos research scholarship and B. Hampel to the NTP-NFTO-20 scholarship. ¨
Appendix A. Supplementary material
Supplementary data to this article can be found online at https://doi.
org/10.1016/j.apsusc.2021.149123.
References
[1] S. Rasalingam, R. Peng, R.T. Koodali, Removal of hazardous pollutants from wastewaters: Applications of TiO2-SiO2 mixed oxide materials, J. Nanomater. 2014 (2014).
[2] T. Bak, J. Nowotny, N.J. Sucher, E.D. Wachsman, Photocatalytic water disinfection on oxide semiconductors: Part 1 - Basic concepts of TiO2 photocatalysis, Adv. Appl.
Ceram. 111 (2012) 4–15.
[3] W.J. Ong, L.L. Tan, S.P. Chai, S.T. Yong, A.R. Mohamed, Facet-dependent photocatalytic properties of TiO2-based composites for energy conversion and environmental remediation, ChemSusChem 7 (2014) 690–719.
[4] Z. Xiu, M.H. Alfaruqi, J. Gim, J. Song, S. Kim, T.V. Thi, P.T. Duong, J.P. Baboo, V. Mathew, J. Kim, Hierarchical porous anatase TiO2 derived from a titanium metal-organic framework as a superior anode material for lithium ion batteries, Chem. Commun. 51 (2015) 12274–12277.
[5] S. Banerjee, D.D. Dionysiou, S.C. Pillai, Self-cleaning applications of TiO2 by photo- induced hydrophilicity and photocatalysis, Appl. Catal. B Environ. 176–177 (2015) 396–428.
[6] S. Kathirvel, C. Su, Y.J. Shiao, Y.F. Lin, B.R. Chen, W.R. Li, Solvothermal synthesis of TiO2 nanorods to enhance photovoltaic performance of dye-sensitized solar cells, Sol. Energy 132 (2016) 310–320.
[7] Z. Hong, J. Hong, C. Xie, Z. Huang, M. Wei, Hierarchical rutile TiO2 with mesocrystalline structure for Li-ion and Na-ion storage, Electrochim. Acta 202 (2016) 203–208.
[8] C. Zhang, Y. Li, D. Shuai, Y. Shen, D. Wang, Progress and challenges in photocatalytic disinfection of waterborne Viruses: A review to fill current knowledge gaps, Chem. Eng. J. 355 (2019) 399–415.
[9] A. Fujishima, K. Honda, Electrochemical Photolysis of Water at a Semiconductor Electrode, Nature 238 (1972) 37–38.
[10] C.M. Lee, P. Palaniandy, I. Dahlan, Pharmaceutical residues in aquatic environment and water remediation by TiO2 heterogeneous photocatalysis: a review, Environ. Earth Sci. 76 (2017).
[11] Z. Xu, M. Quintanilla, F. Vetrone, A.O. Govorov, M. Chaker, D. Ma, Harvesting lost photons: Plasmon and upconversion enhanced broadband photocatalytic activity in core@shell microspheres based on lanthanide-doped NaYF4, TiO2, and Au, Adv.
Funct. Mater. 25 (2015) 2950–2960.
[12] T. Morikawa, R. Asahi, T. Ohwaki, Visible-light photocatalyst-nitrogen-doped titanium dioxide, R&D Rev. Toyota CRDL 40 (2005) 45–50.
[13] B. Xin, L. Jing, Z. Ren, B. Wang, H. Fu, Effects of simultaneously doped and deposited Ag on the photocatalytic activity and surface states of TiO2, J. Phys.
Chem. B 109 (2005) 2805–2809.
[14] Y. Tian, T. Tatsuma, Mechanisms and applications of plasmon-induced charge separation at TiO2 films loaded with gold nanoparticles, J. Am. Chem. Soc. 127 (2005) 7632–7637.
[15] S. Fodor, G. Kov´acs, K. Hern´adi, V. Danciu, L. Baia, Z. Pap, Shape tailored Pd nanoparticles’ effect on the photocatalytic activity of commercial TiO2, Catal.
Today 284 (2017) 137–145.
[16] G. Kov´acs, S. Fodor, A. Vulpoi, K. Schrantz, A. Dombi, K. Hern´adi, V. Danciu, Z. Pap, L. Baia, Polyhedral Pt vs. spherical Pt nanoparticles on commercial titanias:
Is shape tailoring a guarantee of achieving high activity? J. Catal. 325 (2015) 156–167.
[17] T. Ohno, T. Mitsui, M. Matsumura, Photocatalytic activity of S-doped TiO2 photocatalyst under visible light, Chem. Lett. 32 (2003) 364–365.
[18] J. Wang, D.N. Tafen, J.P. Lewis, Z. Hong, A. Manivannan, M. Zhi, M. Li, N. Wu, Origin of photocatalytic activity of Nitrogen-doped TiO2 nanobelts, J. Am. Chem.
Soc. 131 (2009) 12290–12297.
[19] M. Ni, M.K.H. Leung, D.Y.C. Leung, K. Sumathy, A review and recent developments in photocatalytic water-splitting using TiO2 for hydrogen production, Renew.
Sustain. Energy Rev. 11 (2007) 401–425.
[20] F. Zhang, Photon Upconversion Nanomaterials, Springer, vol. 3, 2017, ISBN 9783662455968.
[21] Y. Zhang, Z. Hong, Synthesis of lanthanide-doped NaYF4@TiO2 core-shell composites with highly crystalline and tunable TiO2 shells under mild conditions and their upconversion-based photocatalysis, Nanoscale 5 (2013) 8930–8933.
[22] Q. Zhang, F. Yang, Z. Xu, M. Chaker, D. Ma, Are lanthanide-doped upconversion materials good candidates for photocatalysis? Nanoscale Horizons 4 (2019) 579–591.
[23] K. Lingeshwar Reddy, V. Srinivas, K.R. Shankar, S. Kumar, V. Sharma, A. Kumar, A. Bahuguna, K. Bhattacharyya, V. Krishnan, Enhancement of Luminescence Intensity in Red Emitting NaYF4:Yb/Ho/Mn Upconversion Nanophosphors by Variation of Reaction Parameters, J. Phys. Chem. C 121 (2017) 11783–11793.
[24] S. Saha, R.G.S. Pala, S. Sivakumar, Catalyzing Cubic-to-Hexagonal Phase Transition in NaYF4 via Ligand Enhanced Surface Ordering, Cryst. Growth Des. 18 (2018) 5080–5088.
[25] S. Xie, C. Tong, H. Tan, N. Li, L. Gong, J. Xu, L. Xu, C. Zhang, Hydrothermal synthesis and inkjet printing of hexagonal-phase NaYF4: Ln3+upconversion hollow microtubes for smart anti-counterfeiting encryption, Mater. Chem. Front. 2 (2018) 1997–2005.
[26] W. Wang, W. Huang, Y. Ni, C. Lu, Z. Xu, Different upconversion properties of β-NaYF4: Yb3+, Tm3+/Er3+in affecting the near-infrared-driven photocatalytic activity of high-reactive TiO2, ACS Appl. Mater. Interfaces 6 (2014) 340–348.
[27] S. Mavengere, J.S. Kim, UV–visible light photocatalytic properties of NaYF4:(Gd, Si)/TiO2 composites, Appl. Surf. Sci. 444 (2018) 491–496.
[28] G. Gong, S. Xie, Y. Song, H. Tan, J. Xu, C. Zhang, L. Xu, Synthesis of Lanthanide- Ion-Doped NaYF4 RGB Up-Conversion Nanoparticles for Anti-Counterfeiting Application, J. Nanosci. Nanotechnol. 18 (2018) 8207–8215.
[29] A. Kumar, K.L. Reddy, S. Kumar, A. Kumar, V. Sharma, V. Krishnan, Rational Design and Development of Lanthanide-Doped NaYF4@CdS-Au-RGO as Quaternary Plasmonic Photocatalysts for Harnessing Visible-Near-Infrared Broadband Spectrum, ACS Appl. Mater. Interfaces 10 (2018) 15565–15581.
[30] Q. Zhang, J. Deng, Z. Xu, M. Chaker, D. Ma, High-Efficiency Broadband C3N4 Photocatalysts: Synergistic Effects from Upconversion and Plasmons, ACS Catal. 7 (2017) 6225–6234.
[31] S. Linic, P. Christopher, D.B. Ingram, Plasmonic-metal nanostructures for efficient conversion of solar to chemical energy, Nat. Mater. 10 (2011) 911–921.
[32] Z. Bian, T. Tachikawa, P. Zhang, M. Fujitsuka, T. Majima, Au/TiO2 superstructure- based plasmonic photocatalysts exhibiting efficient charge separation and unprecedented activity, J. Am. Chem. Soc. 136 (2014) 458–465.
Fig. 9. Mechanism of the near-infrared photocatalysis based on upconverting nanoparticle and UV or visible light active photocatalyst. (*ER =energy transfer).
[33] G.R. Bamwenda, S. Tsubota, T. Nakamura, M. Haruta, Photoassisted hydrogen production from a water-ethanol solution-a comparison of activities of Au@TiO2 and Pr@TiO2.pdf, J. Photochem. Photobiol. A – Chem. 89 (1995) 177–189.
[34] J.Z. Soo, B.C. Ang, B.H. Ong, Influence of calcination on the morphology and crystallinity of titanium dioxide nanofibers towards enhancing photocatalytic dye degradation, Mater. Res. Express 6 (2019).
[35] R. Jenkins, R. Snyder, in: Introduction to X-ray Powder Diffractometry, John Wiley Sons, 1996, pp. 47–95.
[36] A.B. Murphy, Band-gap determination from diffuse reflectance measurements of semiconductor films, and application to photoelectrochemical water-splitting, Sol.
Energy Mater. Sol. Cells 91 (2007) 1326–1337.
[37] C. Li, F. Wang, J. Zhu, J.C. Yu, NaYF4:Yb, Tm/CdS composite as a novel near- infrared-driven photocatalyst, Appl. Catal. B Environ. 100 (2010) 433–439.
[38] V. Iliev, D. Tomova, S. Rakovsky, A. Eliyas, G.L. Puma, Enhancement of photocatalytic oxidation of oxalic acid by gold modified WO3/TiO2 photocatalysts under UV and visible light irradiation, J. Mol. Catal. A Chem. 327 (2010) 51–57.
[39] Z. Pap, A. Radu, I.J. Hidi, G. Melinte, L. Diamandescu, T. Popescu, L. Baia, V. Danciu, M. Baia, Behavior of gold nanoparticles in a titania aerogel matrix:
Photocatalytic activity assessment and structure investigations, Cuihua Xuebao/
Chinese J. Catal. 34 (2013) 734–740.
[40] K. Rahme, J.D. Holmes, Gold Nanoparticles: Synthesis, Characterization, and Bioconjugation, Dekker Encycl. Nanosci. Nanotechnol., third ed. (2015) 1–11.
[41] J.C. Dur´an-Alvarez, A.L. Santiago, D. Ramírez-Ortega, P. Acevedo-Pe´ ˜na, F. Castill´on, R.M. Ramírez-Zamora, R. Zanella, Surface modification of B-TiO2 by deposition of Au nanoparticles to increase its photocatalytic activity under simulated sunlight irradiation, J. Sol-Gel Sci. Technol. 88 (2018) 474–487.
[42] K.L. Reddy, S. Kumar, A. Kumar, V. Krishnan, Wide spectrum photocatalytic activity in lanthanide-doped upconversion nanophosphors coated with porous TiO2 and Ag-Cu bimetallic nanoparticles, J. Hazard. Mater. 367 (2019) 694–705.