High-resolution paleoclimatic proxy data from the MIS3/2 transition recorded in northeastern Hungarian loess
Janina B€ osken
a,*, Igor Obreht
a, Christian Zeeden
a, Nicole Klasen
b, Ulrich Hambach
c,d, P al Sümegi
e, Frank Lehmkuhl
aaDepartment of Geography, RWTH Aachen University, Templergraben 55, 52056 Aachen, Germany
bInstitute of Geography, University of Cologne, Albertus-Magnus-Platz, 50923 Cologne, Germany
cBayCEER&Chair of Geomorphology, University of Bayreuth, Germany
dChair of Physical Geography, Faculty of Sciences, University of Novi Sad, Serbia
eDepartment of Geology and Palaeontology, University of Szeged, Hungary
a r t i c l e i n f o
Article history:
Received 31 March 2017 Received in revised form 13 August 2017
Accepted 4 December 2017 Available online 26 December 2017
Keywords:
Grain size analysis Weathering indices Magnetic susceptibility Loess
Luminescence dating
Wind directions derived from AMS measurements
a b s t r a c t
The Bodrogkeresztúr loess-paleosol sequence in northeastern Hungary was investigated to improve our understanding of the paleoenvironmental conditions at the foothills of the Carpathians and their impact on the Gravettian population. The main part of the section is comprised of eolian deposits that enable the reconstruction of the paleoenvironmental conditions. This study comprises grain size, geochemical, color and rock magnetic analysis, as well as luminescence and radiocarbon dating. The chronological data place this section from later MIS 3 until present, but also suggest erosion of the sediment in the late MIS 2 and the (early) Holocene. Moreover, generally more humid conditions during late MIS3 and early MIS2 are observed, in comparison to other regions in the Carpathian Basin. Main dust source was most likely the Tiszafloodplain, and the material was probably transported to the site from a northeastern wind direction. Increased weathering led to the formation of a well-developed MIS3 paleosol. The loess ex- hibits elevated values of frequency dependent magnetic susceptibility that highlight the relatively mild conditions during loess formation. Nevertheless, two loess layers with high sand abundance in the profile indicate colder and dryer conditions with increased eolian dynamics during short periods within MIS2.
Finally, the Bodrogkeresztúr section highlights the unique microclimatic conditions at the foothill areas of the Carpathian Basin, which may have offered a favorable environment for the Gravettian population.
©2017 Elsevier Ltd and INQUA. All rights reserved.
1. Introduction
Loess-paleosol sequences have the ability to preserve past environmental and climatic conditions (e.g. Buggle et al., 2013;
Derbyshire, 2003; Evans and Heller, 2001; Guo et al., 2002; Heller and Liu, 1984; Krauß et al., 2016; Kukla, 1977; Kukla et al., 1988;
Obreht et al., 2016, 2017; Smalley and Vita-Finzi, 1968; Smalley and Leach, 1978; Zeeden et al., 2016b). Therefore, these represent a widely used terrestrial archive for the reconstruction of paleocli- matic dynamics. The loess deposits of the Carpathian Basin have been studied increasingly in recent years for paleoenvironmental studies, but also for geoarcheological investigations (e.g.Kels et al., 2014; B€osken et al., accepted, Chu et al. accepted). The Danube River
has been proposed as route for anatomically modern human dispersal in the Middle and Lower Danube Basin, especially during the Aurignacian (Conard and Bolus, 2003, 2008; Mellars, 2011;
Iovita et al., 2014). Additionally, the density of Aurignacianfind spots suggests a preference for the Carpathian foothill zone (Hauck et al., 2017). Understanding the paleoenvironmental and paleo- climatological conditions during early modern human dispersal might improve our understanding of past human-climate interactions. In northeastern Hungary, there have been also archeologicalfindings of Gravettian origin such as the Bodrogker- esztúr-Henye site (Vertes, 1965, 1966; Dobosi, 2000). Loess- paleosol sequences can be employed to better understand the environmental context of early modern humans by interpreting proxies of weathering intensity (e.g.Újvari et al., 2008; Buggle et al., 2011a; Obreht et al., 2015; Schatz et al., 2015), pedogenesis (e.g.Hao et al., 2008; Babek et al., 2011), wind strength and directionality (e.g. Nawrocki et al., 2006; Sun et al., 2010; Obreht et al., 2015;
*Corresponding author.
E-mail address:Janina.Boesken@geo.rwth-aachen.de(J. B€osken).
Contents lists available atScienceDirect
Quaternary International
j o u r n a l h o m e p a g e :w w w . e l s e v i e r . c o m / l o c a t e / q u a i n t
https://doi.org/10.1016/j.quaint.2017.12.008
1040-6182/©2017 Elsevier Ltd and INQUA. All rights reserved.
Zeeden et al., 2015; Újvari et al., 2016), sedimentation rates (e.g.
Újvari et al., 2010; Stevens et al., 2011), and changing source ma- terial inputs (e.g.Újvari et al., 2012; Muhs et al., 2013; Obreht et al., 2016).
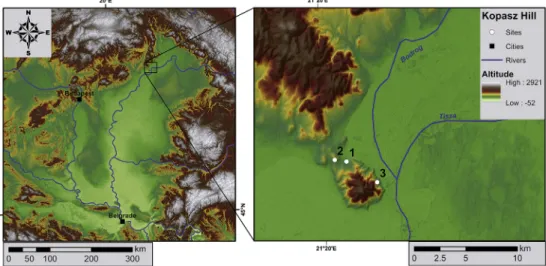
The present study investigates a loess-paleosol sequence close to the former excavations Bodrogkeresztúr-Henye at the Kopasz Hill (see Fig. 1) near Tokaj in northern Hungary. Several proxies (grain size distributions, geochemical analysis, rock magnetic proxies and color measurements) are used to study past environ- mental changes. Geochronological control is provided by radio- carbon and luminescence dating. The research aim lies in the reconstruction of the paleoenvironmental conditions at the loess- paleosol sequence Bodrogkeresztúr (BKT) in order to improve our understanding of the paleoclimatic conditions in northeastern Hungary specifically in MIS 3 and the transition to the cooler MIS 2.
A detailed comparison to the close-by loess-paleosol sequence Tokaj (Sümegi and Hertelendi, 1998; Sümegi, 2005; Schatz et al., 2011, 2012, 2015) aims at detecting local differences in environ- mental proxies, paleogeography and possibly microclimates.
Furthermore, the resolution of the proxy data is increased, which enhances the environmental reconstruction.
2. Previous investigations
The investigated Bodrogkeresztúr section is located at the northwestern site of the Kopasz Hill, which contains Sarmatian (Miocene) volcanic (including pyroclastic) rocks and is widely covered by loess deposits (Sümegi and Hertelendi, 1998). Previous investigations around the Kopasz Hill have been conducted inten- sively (Sümegi and Hertelendi, 1998; Sümegi et al., 2000; Rudner and Sümegi, 2001; Sümegi and Rudner, 2001; Sümegi and Krolopp, 2002; Sümegi, 2005; Schatz et al., 2011, 2012, 2015). The authors constructed a general stratigraphy: the profiles start with a ca. 68e48 ka cal. BP ‘lower’ loess layer, which probably formed under tundra conditions. It is overlain by a dark brown paleosol (48e41 ka cal. BP), which has evolved under a temperate and hu- mid climate. Above, a‘middle’loess layer (~41e34 ka cal. BP) is covered by a reddish brown paleosol that formed during the Upper Weichselian ~34e29 ka cal. BP (Sümegi and Hertelendi, 1998). The Gravettian layer of the Bodrogkeresztúr-Henye site is also related to this paleosol (Sümegi et al., 2000,2016). The paleosol is covered by
a charcoal bearing white layer indicating the occurrence of exten- sive (spruce) forestfires under extremely dry conditions ~30e28 ka cal. BP (Sümegi and Hertelendi, 1998; Sümegi et al., 2000; Sümegi and Rudner, 2001; Sümegi, 2005). Overlying this soil is the‘upper’ loess layer (<29 ka cal. BP) that points to continental steppe con- ditions. Two interstadial phases within the loess layer were determined at 26e23 and 20e17 ka cal. BP (Sümegi and Hertelendi, 1998), and also two more phases of forestfires occurred around 25 and 20 ka cal. BP.Schatz et al. (2011)found two tree-less steppe intervals with strong winds and loess deposition under cool and humid climate. Moreover,five periods with increased tree/shrub vegetation cover were found in this loess layer.
The new site adds a high-resolution paleoenvironmental archive to the previous investigations that is in the vicinity of the archeo- logical site in a comparable geomorphological position, which al- lows a reconstruction of the climatological conditions during and after Gravettian occupation. What is more, the original archeo- logical site and it chronological control is disturbed by erosion of the upper loess layer as well as root penetration into the paleosol and the formation of a more recent soil on top of the paleosol (Sümegi and Hertelendi, 1998; Sümegi and Krolopp, 2000; Sümegi et al., 1998, 2000). The new site at the Bodrogkeresztúr brickyard allows investigating an undisturbed paleosol, which can be con- nected to the archeological site, and its cover loess. Finally, the investigated sequence is the northernmost loess sequence with a thickness>2 m in this part of the Carpathians highlighting its value for paleoenvironmental studies.
3. Methods
3.1. Field work
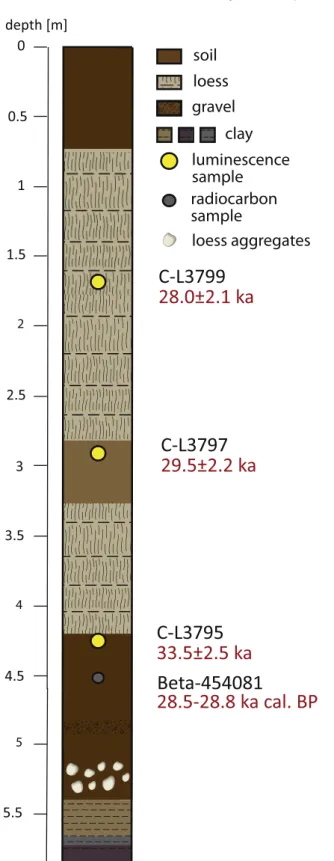
Two loess-paleosol profiles were carefully cleaned, described, and sampled in a former brickyard close to the town of Bod- rogkeresztúr in northeastern Hungary. Samples for rock magnetic, sedimentological and color analyses were taken in a resolution of 4 cm, while geochemical analyses were performed in 8 cm reso- lution. One radiocarbon and three luminescence samples were taken at depths of 1.69 m (C-L3799), 2.9 m (C-L3797), 4.27 m (C- L3795) and 4.51 m (Beta-454081). No further charcoal for14C dating was found.
Fig. 1.Topographical map showing an overview of the Carpathian Basin (left) and some of the research sites at the Kopasz Hill (right). 1. Bodrogkeresztúr (this study), 2. Bod- rogkeresztúr-Henye (e.g.Sümegi, 2005; Sümegi and Rudner, 2001; Sümegi et al., 2016), 3. Tokaj (Sümegi, 2005; Schatz et al., 2015, 2012, 2011)/Patko quarry (e.g.Sümegi and Hertelendi, 1998; Sümegi and Krolopp, 2002). SRTM data available from U.S. Geological Survey.
osken et al. / Quaternary International 502 (2019) 95e107 96
3.2. Geochronology 3.2.1. Luminescence dating
3.2.1.1. Equivalent dose (De). Sample preparation for De determi- nation followed standard laboratory procedures (e.g.B€osken et al., 2017).
Continuous wave optically stimulated luminescence measure- ments (CW-OSL) were carried out on a Risø TL/OSL DA 20 reader equipped with a90Sr/90Ybsource and IR LEDs, emitting at 870 nm (FWHM¼40 nm). For signal detection, a 410 nm interferencefilter was used. The applicability of the pIRIR protocol (Thiel et al., 2011;
Buylaert et al., 2012) was determined by testing different combi- nations of preheat,first IR and second IR temperatures on natural and bleached samples (i.e. dose recovery test). First IR stimulation temperature tests on natural samples (cf.Buylaert et al., 2012) were conducted using the pIRIR225, pIRIR250, pIRIR270, and pIRIR290pro- tocols. In a second step, selected combinations of preheat,first IR stimulation, and second IR stimulation temperatures underwent a dose recovery test, after the aliquots were bleached for 24 h in a H€onle Sol2 solar simulator. Finally, the Dewas determined on a minimum of eight aliquots per sample using an arithmetic mean.
The signal was integrated using thefirst 2.4 s minus a background of the last 25.6 s. Residual doses, after bleaching for 24 h in a H€onle Sol2 solar simulator, were assessed. Fading rates were measured for one sample after administering a dose of ~115 Gy using storage times between 100 and 800 min (followingAuclair et al., 2003).
3.2.1.2. Dose rate. Samples for dose rate determination were oven dried (50 C), homogenized and packed into plastic cylinders.
Radionuclide concentrations were measured on a high-purity germanium gamma-ray spectrometer after a resting period of four weeks (to compensate for radon emanation during pretreat- ment). Dose rates and ages were calculated in DRAC v.1.2 (Durcan et al., 2015) using the conversion factors ofLiritzis et al. (2013), an estimated water content of 15e17%, and attenuation factors of Bell (1980)andGuerin et al. (2012). The water content was esti- mated using sample depth and a formula for Hungarian loess sec- tions byPecsi and Richter (1996). Moreover, an internal potassium content of 12.5±0.5% (Huntley and Baril, 1997) and an internal rubidium content of 400±100 ppm (Huntley and Hancock, 2001) was assumed. The cosmic dose rate was calculated afterPrescott and Hutton (1994)considering the geographical position, altitude and sample depth. a-efficiency was determined by giving the samples different a-doses of <400Gy in a Freiberg Instruments Lexsyg Research device and recovering this dose withb-irradiation in a Risø-reader, similar to a dose recovery test. It was ensured that the given dose was small enough to befitted with a linear function.
3.2.2. Radiocarbon dating
The charcoal sample wasfloated to extract charcoal from sedi- ment. Dating was performed at the Beta Analytic Radiocarbon Dating Laboratory following the acid/alkali/acid-pretreatment procedure. The content of carbon isotopes was measured by means of accelerator mass spectrometry. Finally, the measured carbon isotope ratios were converted to14C years and later cali- brated using the INTCAL13 calibration curve and the intercept method (Talma and Vogel, 1993; Reimer et al., 2013).
3.3. Rock magnetism
The rock magnetic measurements followed procedures outlined in e.g.Baumgart et al. (2013), Buggle et al. (2014), andZeeden et al.
(2011, 2015). Samples were dried and compressed into plastic boxes with a volume of 6.4 cm3. Each specimen was measured twice for measurement of the (frequency dependent) magnetic susceptibility
(cfd). Two different frequencies (0.3 and 3 kHz) in a magnetic AC field of 300 Am1 and a MAGNON VFSM susceptibility bridge (sensitivity greater than 5 106 SI) were used. The frequency dependent magnetic susceptibility is calculated using the following equation:cfd%¼((c0.3 kHzec3kHz)/c0.3 kHz)100 [%].
Oriented sampling of nine specimens were taken at a depth range from about 4.02 to 4.12 m. Anisotropy of magnetic suscep- tibility (AMS) measurements follow procedures outlined in (Zeeden et al., 2011, 2015). Measurements of the magnetic sus- ceptibility and of the anisotropy of the magnetic susceptibility were made employing an AGICO KLY-3S kappabridge. Data evaluation of magnetic fabric data was done employing the ANISOFT software (version 4.2).
3.4. Grain size (GS)
For particle size analysis, all samples were prepared as described inNottebaum et al. (2015)andSchulte et al. (2016). Particle size was measured with a Laser Diffraction Particle Size Analyzer (Beckman Coulter LS 13 320) calculating the percentaged size frequency of 116 classes within a size range of 0.04e2000mm (2% error). Accuracy was increased by measuring each sample four times in two different concentrations. The grain size distributions were deter- mined using the Mie theory (ISO International Standard 13320, 2009; Fluid RI: 1.33; Sample RI: 1.55; Imaginary RI: 0.1; Ozer€ et al., 2010; cf.Schulte et al., 2016).
3.5. Geochemistry
A Spectro Xepos was used for elemental determination by X-ray fluorescence (EDPXRF). Sample preparation followed procedures described in e.g.Kels et al. (2014)andObreht et al. (2016, 2015). All samples were measured twice and the arithmetic mean is used for data analysis.
Using elemental data, element ratios, such as Al2O3/SiO2, were calculated to quantify weathering. The Chemical index of alteration was calculated by using the formula CIA ¼ (Al2O3/ (Al2O3þNa2OþCaO*þK2O))*100; where CaO* is silicatic CaO (Nesbitt and Young, 1989), as well as the Chemical Proxy of Alter- ation (CPA ¼ (Al2O3/(Al2O3þNa2O))*100) (Buggle et al., 2011b).
Moreover, the Ba/Sr ratio was calculated as indicator for immobile (Ba, bound to clay)/mobile (Sr, similar behavior as Ca and mainly associated with Ca) elements (seeBuggle et al., 2011band refer- ences therein). Additionally, an A-CN-K diagram (Nesbitt and Young, 1989) plots the concentrations of Al2O3, Na2OþCaO*, and K2O in a tertiary diagram.
3.6. Color
Samples were homogenized and dried, the color was deter- mined using a Konica Minolta CM-5 spectrophotometer. The L*a*b*
values indicate the extinction of light, on a scale from L* 0 (absolute black) to L* 100 (absolute white), and express color as chromaticity coordinates on red-green (a*) and blue-yellow (b*) scales.
Measured colors were plotted using the ‘drawProfile.R’ R script (Sprafke, 2016; Zeeden et al., 2017).
4. Results
4.1. Stratigraphy
The two sampled profiles, about 2 m apart, can be correlated by means of litho- and pedo-stratigraphy and physical and chemical proxy data (see SupplementaryFig. S1). A composite profile is used for further description (Fig. 2).
osken et al. / Quaternary International 502 (2019) 95e107 97
The bottom of the profile is characterized by dark brown (~5.7e5.84 m) and dark grey clay (5.67e5.7 m), followed by light and clay-rich sediment (5.45e5.67 m). Duringfieldwork, the clay layers were interpreted as overbank deposits. Complete mollusk shells were found in the paleosol and loess layers. The clay is fol- lowed by a chestnut-colored paleosol (~4.2e5.45 m). Within this
horizon, a layer containingfine gravels (~4.75 m) and some thin, flat and lens-like loess aggregates (depth 5.1e5.4 m) can be iden- tified. These embeddedflat loess aggregates are from a sedimen- tological perspective interesting, because these are typical for transport over a short distance by water action (cf.Sch€afer, 2005).
The paleosol is overlain by a horizon offine grey loess (3.95e4.2 m) with a transitional zone between soil and loess. On top follows a yellowish and homogenous loess layer (~3.25e3.95 m) and a weak paleosol (2.8e3.25 m). The upper part of the profile is characterized by a homogenous yellowish-light brown loess layer (0.8e2.8 m) and the modern soil (0e0.8 m).
4.2. Geochronology 4.2.1. Luminescence data
Thorough testing of the luminescence signal was undertaken on sample C-L3797. First IR stimulation temperature tests are shown in Fig. 3a. Four pIRIR protocols with a second stimulation temperature of 225C, 250C, 270C, and 290C were tested. While preheat temperatures were always 30C higher than second IR stimulation temperatures, different first IR stimulation temperatures were applied: 50C, 80C, 110C, 140C and 180C. Additionally, we
Fig. 2. Stratigraphical sketch of the loess-paleosol sequence Bodrogkeresztúr. Location of geochronological samples and their results are included.
Fig. 3.a.) Plot showing the results of thefirst IR stimulation temperature tests on sample C-L3797. Four different pIRIR protocols were used with second IR stimulation temperatures of 225C, 250C, 270C, and 290C. Testedfirst IR temperatures were 50C, 80C, 110C, 140C, and 180C. b.) Dose recovery test of sample C-L3797 using different combinations of preheat,first IR and second IR stimulation temperatures.
Preheat temperatures were always 30C higher than second IR stimulation temper- atures. All tested pIRIR protocols pass the test with an acceptance limit of 1.0±0.1.
osken et al. / Quaternary International 502 (2019) 95e107 98
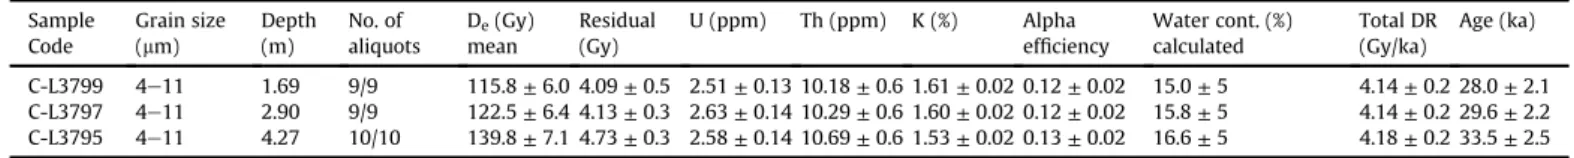
conducted a dose recovery test (Fig. 3b) for some of the tested protocols, which shows that all tested protocols are able to recover a given dose satisfactorily (recovered/given dose ratios between 0.95±0.02 and 1.02±0.02). In order to keep fading to a minimum and allow a better comparison to other samples measured, we finally used the pIR50IR290protocol for Dedetermination.Fig. S2in the Supplementary Materials shows several shine down and dose response curves. The abanico plots (Fig. S3) indicate a low relative standard error<4% for all Dedistributions. Residual signals after 24 h bleaching are minimal (<5 Gy) and were not considered for further calculations. Alpha efficiency measurements determined a- values of 0.13±0.02 (C-L3795) and 0.12±0.02 (C-L3797 and C- L3799). The fading measurements determined a mean g2daysvalue of 0.27±0.76% for sample C-L3797 (Fig. S4). Dose rates are similar for all samples ~4.1 Gy/ka. Final ages and Devalues increase with depth from 28.0 ± 2.1 ka (115.8 ± 6.0 Gy) to 33.5 ± 2.5 ka (139.8±7.1 Gy).Table 1summarizes the luminescence data.
4.2.2. Radiocarbon dating
Sample Beta-454081 yields a conventional radiocarbon age of 24,580 ±90 BP. 2-sconfidence interval of the calibrated age is 28,770e28,475 cal. BP. At a 1-sconfidence interval, the calibrated age estimate is 28,705e28,565 cal. BP.
4.3. Rock magnetism
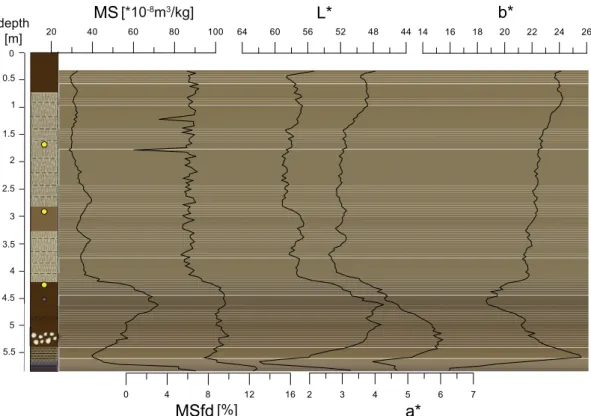
The magnetic susceptibility (c) of the profile ranges from 30 to 90*108 m3/kg (Fig. 4). The lower ~1.5 m of the profile show considerable variability starting with a decrease from ~90*108m3/ kg to 40*108m3/kg within 30 cm. This is followed by a less rapid increase inctowards ~70*108m3/kg (4.6 m depth). Another rapid decrease inctowards ~35*108m3/kg is succeeded by a double sigmoidal pattern at a depth from 2.7 to 4.1 m. Above,cdecreases slightly and shows only small variation between 30 and 40*108m3/kg in the upper part of the profile (~0.32e2.0 m). The frequency dependent magnetic susceptibility (cfd) begins with values around 12% in the lower cm, which drop rapidly toward 8e10% (4.2e5.5 m). After a minimum ~5% (3.4e4.1 m), the upper 3.4 m show similar values around ~6e7%, however, some variations are observed, especially at 1.2 m and 1.75 m depth.
The magnetic susceptibility is often measured in bulk, but its (an)isotropy can be investigated when turning samples 3- directional in an appliedfield. This yields a 3-dimensional ellip- soid, which can be fully described by its orientation and three axis lengths of the maximum, medium and minimum susceptibility. In sedimentary systems, anisotropic particles are often lyingflat, and also preferential directions can be observed and interpreted.
Here, the axes of maximum susceptibility (k1; circles inFig. 5) have a mean declination of 176.4(±33.2) and inclination of 1.9 (±9.1). The axis of medium susceptibility (k2; triangles) have a mean declination of 266.6(±33.3) and inclination of 4.7(±6.1).
The minimum (k3; squares) axis of data have a mean declination of 64.8(±9.2) and a mean inclination of 84.9(±6.3).
Confidence in clear separation of a maximum, medium and minimum axis can be reached through parametric (Jelinek, 1977)
and nonparametric statistics (Constable and Tauxe, 1990), here the test according toJelinek (1977)is applied. All tests for anisotropy (mean F-test value is 237) and rotational anisotropy (mean F test value is 42) show that anisotropy could be determined from all but two (T_2.1; T_6.3) samples.Fig. 5shows all data, and encircles the
k1 &k2 directions for the two samples where these directions
cannot be reliably separated. However, their consistency with remaining samples suggests the correct assignment of k1 and k2 directions.
4.4. Grain size
Fig. 6shows the changes in grain size throughout the sequence.
At the bottom of the profilefine and coarse silts (<5mm; 22e63mm) are the most abundant fractions (~60%), while grains>63mm show the smallest proportion of ~5%. Between 3.8 and 5.2 m the coarser fractions increases at varying rates up to 75%, while the finer fractions decrease accordingly. A double sigmoidal pattern is evident for all grain size fractions at 2.8e3.8 m depth. The upper part of the section (0e2.8 m) is characterized by increasing per- centages of thefine grain sizes from ~15% to ~20% (<5mm) and from 17% to 24% (5e22 mm; Fig. 6). The coarser grain sizes show an increasing trend in this part (50-45% for 22e63 mm; 19-10% for
>63mm), with the maximum in sand (>63mm) between 1.3 and 1.8 m.
The U-ratio shows a similar pattern as the coarse grain sizes. It shows a low value of 1.5e2.2 in the bottom of the profile (4.5e5.84 m). The U-ratio increases rapidly between ~4 and 4.5 m towards 4 and shows the same double sigmoidal pattern as the coarse grain sizes between 2.7 and 4 m. The U-ratio is relatively constant between 2 and ~2.5 m around 3.5 and decreases slowly in the upper 2 m of the profile towards 2.5.
The grain size distribution curves of loess show a bimodal dis- tribution of the sediment with a pronounced peak in the coarse silt fraction and a shoulder in the clay (Fig. 7). The well-developed basal paleosol also shows a bimodal grain size distribution, where the pronounced peak has a lower volume and the shoulder in clay has a more pronounced volume. The lowermost 0.2 m of the section are not characterized by bimodal distributions.
4.5. Geochemistry
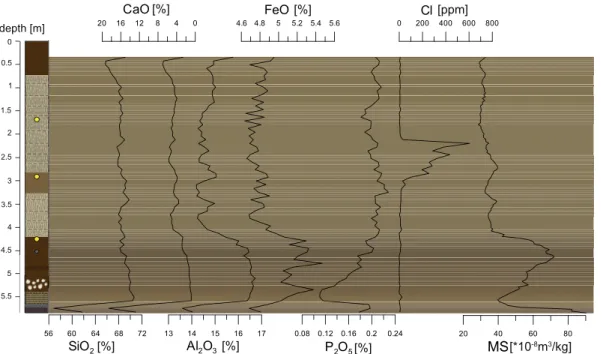
The sediment is dominated by quartz being the major carrier of SiO2, contributing from 65.8 to 70.7%, except in the lowermost 12 cm of the section where the SiO2abundance shows lower values between 56 and 62% (Fig. 8). The Al2O3content shows an average of 15.1%. CaO is generally low for Danubean loess (average 4.4%;
compareB€osken et al., accepted; Krauß et al., 2016; Obreht et al., 2016, 2015), with an abundance of ~10%; only in the lower 12 cm values increase up to ~18%. Albeit the general values are low, the lower 20 cm exhibit highfluctuations between 0.9 and 18% (Fig. 8).
The sediments contain 4.9% FeO with slightly higher values in the lower part (paleosol) of 5e5.5%. The average content of P2O5is 0.2%, its abundance decreases gradually in the paleosol towards 0.11%. Cl shows low values <30 ppm for most of the profile, except in
Table 1
Luminescence data including radionuclide concentrations, dose rates (DR), equivalent doses, alpha efficiency and age.
Sample Code
Grain size (mm)
Depth (m)
No. of aliquots
De(Gy) mean
Residual (Gy)
U (ppm) Th (ppm) K (%) Alpha efficiency
Water cont. (%) calculated
Total DR (Gy/ka)
Age (ka)
C-L3799 4e11 1.69 9/9 115.8±6.0 4.09±0.5 2.51±0.13 10.18±0.6 1.61±0.02 0.12±0.02 15.0±5 4.14±0.2 28.0±2.1 C-L3797 4e11 2.90 9/9 122.5±6.4 4.13±0.3 2.63±0.14 10.29±0.6 1.60±0.02 0.12±0.02 15.8±5 4.14±0.2 29.6±2.2 C-L3795 4e11 4.27 10/10 139.8±7.1 4.73±0.3 2.58±0.14 10.69±0.6 1.53±0.02 0.13±0.02 16.6±5 4.18±0.2 33.5±2.5
osken et al. / Quaternary International 502 (2019) 95e107 99
~2.1e2.8 m, where a sudden increase towards 605 ppm is observed.
Fig. 9shows the geochemical ratios and weathering indices. The lowermost ~20 cm show a strong variability in weathering indices.
Generally, the weathering indices CIA and CPA follow an upward-
decreasing trend with varying values between 64 and 74 (CIA), and 85e91 (CPA). Rb/Sr and Ba/Sr follow a similar general pattern.
Decreasing values from 5.5 m to 4 m (0.9 for Rb/Sr and 4 for Ba/Sr) are followed by pronounced minima from ca. 4e2.4 m depth.
Increasing values occur in the upper ~2.5 m (0.85e0.65 for Rb/Sr;
4e2.8 for Ba/Sr). The Al2O3/SiO2 ratio is elevated in the paleosol (~0.24) and shows lowest values between 2.8 and 4.2 m (0.2e0.21).
The upper 1.5 m show an increasing trend of Al2O3/SiO2towards 0.23.
The AeCNeK diagram (Al2O3e(CaO* þNa2O)eK2O diagram;
Nesbitt and Young, 1984) inFig. 10informs about weathering and sorting effects of aluminosilicates, as well as the initial composition of the unweathered material (Buggle et al., 2008; Obreht et al., 2015). At the Bodrogkeresztúr section, all samples are clustered on the line parallel to the A-CN join, indicating a domination of the chemical weathering (first-order plagioclase removal, and slight K- feldspar weathering) and an absence of a sediment sorting effect at the section.
4.6. Color
Measured colors were plotted inFig. 4. Values of L* (extinction of light) and a* (red-green) show a similar pattern (note that L* is plotted from higher to smaller values): L* value range from 48 to 64 with lowest values in the lowermost sample and between 4.2 and 5.3 m. The highest L* values of ~64 occur at a depth of ~5.7 m. In the upper 4 m, L* values range from 54 to 59, with slightly lower values in the interval between 2.8 and 4.1 m a* shows an opposite pattern with minima around 3 (2.8e4.1 m) and a maximum of ~6 (4.9e5.3 m). a* shows values ~3e3.5 between 1.4 and 4.1 m and increases in the upper 1 m towards 4. b* shows a rapid increase from 15 to 25 between 5.6 m and 5.84 m depth, which is followed by decreasing values towards 18 (4.5 m). b* increasesfirst rapidly Fig. 4.Physical property data of the Bodrogkeresztúr section showing the magnetic susceptibility (MS), the frequency dependent magnetic susceptibility (MSfd), and the L*, a*, and b* values of color measurements. In the uppermost part no samples were taken for laboratory analyses. The proxy data are underlain by a representation of dry measured color data.
(For interpretation of the references to color in thisfigure legend, the reader is referred to the Web version of this article.)
Fig. 5.Directions of the anisotropy of the magnetic susceptibility from Bodrogker- esztúr. Circles depict k3 directions, triangles depict k2 directions and squares represent K1 axes. Encircled data indicates that k1 and k2 directions cannot clearly be separated statistically.
osken et al. / Quaternary International 502 (2019) 95e107 100
and then more gradually towards 24 until the top of the section.
5. Discussion
5.1. Geochronology
The luminescence samples were tested thoroughly to choose the optimal measurement settings. The dose recovery ratios, low fading rates, and low relative standard errors confirm the applica- bility of the used pIR50IR290protocol. The luminescence data fits well to the radiocarbon chronology of the Kopasz hill (Sümegi and Hertelendi, 1998) and the luminescence chronology ofSchatz et al.
(2012). The Bodrogkeresztúr section can be linked to the‘upper’ paleosol and the‘upper’loess layer found at the other profiles. Our age of 33.5±2.5 ka (C-L3795) agrees well with two pIRIR290ages of 39.2±3.4 ka and 30.1±2.7 ka of the upper paleosol at Tokaj (Schatz et al., 2012). In addition, the radiocarbon chronology (Sümegi and Hertelendi, 1998) places this paleosol between 29 and 34 ka cal.
BP. Moreover, the other two ages of 28.0±2.1 and 29.6±2.2 ka fall in the same range as the upper loess layer at Tokaj, which is dated to 24.9± 2.2e27.8± 2.5 ka (Schatz et al., 2012). . The radiocarbon sample gives an age of 28.5e28.8 ka cal. BP, and represents an age estimate of the formation of the paleosol slightly younger than the age of the sedimentation as dated by the luminescence samples.
However, this is not surprising as not the same event is dated and age estimates do overlap when their 2-suncertainty are consid- ered. Similar observations were made byÚjvari et al. (2014a)at the Dunaszekcs}o loess paleosol sequence where pIRIR290age estimates were consistently older than 14C ages, especially in younger samples.
Even though resulting ages agree well between the BKT and Tokaj profiles, there are considerable differences in the lumines- cence characteristics, which might speak for different provenance, geochemistry or sedimentary processes prior to deposition. At Tokaj,Schatz et al. (2012)encountered severe problems during the dose recovery measurements related to the optical or thermal pretreatment, while the BKT samples did not show any problematic behavior. Residual doses are higher at Tokaj, but both sections show in general low residuals. In both sections, residual doses increase
slightly with the equivalent dose. Dose rates at Tokaj were marginally lower than at BKT, and different a-values were used, which can lead to differences in age of a few thousand years.
5.2. Origin of the sediments
The bimodal grain size distribution curves of loess with a peak in coarse silt and a shoulder in clay strongly support an eolian origin of the sediments, although a minor contribution of slope wash deposits cannot be ruled out. The well-developed basal paleosol shows a bimodal distribution with exception of the lowermost 0.2 m, suggesting a mixing of loess-like and alluvial deposits here.
This is supported by observations in thefield and low values ofc (~4.6 m to bottom). Therefore, the part below a depth of 4.6 m should not be interpreted as a paleoclimatic signal.
Wind directions inferred from AMS measurements (e.g.
Nawrocki et al., 2006; Bradak, 2009; seeFig. 5) speak for a domi- nant north(west) - south(east) wind direction, or a perpendicular direction from (south)west - (north)east (for the eolian part of the section). A paleowind direction of north-south direction may also be inferred from landforms in the region and to the south-east in the more open steppe landscape. Here we interpret the data as the material originating from a predominantly northeastern wind di- rection, because this is most consistent with landforms in the re- gion (visible in topographic maps). This suggests the Tisza floodplain to the northeast to be a main source of sediment, which is supported by an increased abundance of coarser particles (Fig. 6) indicating that the source area was close by (Obreht et al., 2014, 2016; B€osken et al., accepted). However, the well-developed pale- osol shows a high abundance offine particles, suggesting a strong alteration of primary deposited loess caused by pedogenesis, combined with the deposition offine-grained overbank deposits.
Geochemical characteristics (Fig. 8) show a composition similar to the Tokaj section, with a higher contribution of SiO2and a lower contribution of CaO. This is different to other studied loess sections in Hungary (Újvari et al., 2008, 2014b; Varga et al., 2011; B€osken et al., accepted), indicating strong dissolution of CaO from the original sediment, also supported by low Sr values (average 111 ppm). Moreover, candcfdare generally high for Danubean Fig. 6.Grain size properties of the Bodrogkeresztúr section showing the<5mm. 5e22mm. 22e63mm and>63mm fractions, as well as the U-ratio. For comparison between the figures the magnetic susceptibility (MS) is shown. In the uppermost part no samples were taken for laboratory analyses.
osken et al. / Quaternary International 502 (2019) 95e107 101
loess, additionally supporting the interpretation of increased weathering intensity caused by relatively high paleo-precipitation.
Also low L* and high a* values (in comparison to other loess sec- tions in Southeastern Europe, e.g.B€osken et al., accepted; Lukic et al., 2014;Obreht et al., 2016) indicate a generally high intensity of pedogenesis and weathering.
5.3. Weathering indices
Chemical weathering indices have been widely applied to evaluate the intensity of weathering in loess from different regions (Yang et al., 2006; Varga et al., 2011; Buggle et al., 2011b, 2013;
Újvari et al., 2014b; Hosek et al., 2015; Krauß et al., 2016; Obreht et al., 2015). They are based on the concept on mineral alteration, where the selective removal of soluble and mobile elements from a section is compared to a relative enrichment of immobile and non- soluble elements. Simple ratios like Ba/Sr or Rb/Sr are suggested to be strongly influenced by CaCO3content (Buggle et al., 2011b), or rarely by MgO content (Obreht et al., 2015). However,Schatz et al.
(2015) reported those ratios to be influenced by the grain size rather than CaCO3content at Tokaj. Similarly, the Ba/Sr and Rb/Sr ratios from our record show a similar trend like thefine fractions (Fig. 9). An explanation of such grain size dependence of geochemical ratios may be related to higher Rb concentrations in clay and enrichment of the Sr in silt (Schatz et al., 2015; Újvari, 2014). Nevertheless, additional studies are required for a better understanding of the nature of the Ba/Sr and Rb/Sr ratios as weathering indices. Classical weathering indices like the Chemical Index of Alteration (CIA,Nesbitt and Young, 1989) or the Chemical Proxy of Alteration (CPA,Buggle et al., 2011b) are suggested to be more sensitive to the weathering intensity. However, studies with a higher sampling resolution (Obreht et al., 2015; Krauß et al., 2016) demonstrated that the general trends of the CIA and CPA are mostly in agreement with enhanced weathering, but clear deviations are observed in some parts of the profiles. Similarly, the CIA and CPA from the Bodrogkeresztúr section indicate increased weathering in the well-developed paleosol and the upper part of the section, but the values between 2 and 3.5 m show high values that are not supported by other proxies that represent weathering (cf.Fig. 9). A potential explanation for this discrepancy is that weathering indices, such as Rb/Sr and Ba/Sr ratios, may be controlled by grain size and leaching, while CIA and CPA might preferentially reflect Ca and Na removal by plagioclase and feldspar weathering.
5.4. Paleoclimatological conditions during late MIS3
Geochemical characteristics of the Bodrogkeresztúr section show clear differences between loess and paleosol. The well- developed paleosol with a supposed alluvial sediment input at the profile base has higher FeO and Al2O3contents (Fig. 8), sug- gesting strong weathering producing iron oxides andfiner particles associated with a higher Al contribution due to post-depositional clay formation.
The unusually well-developed MIS 3 paleosol is a characteristic of both sections, Tokaj and Bodrogkeresztúr, indicating rather hu- mid conditions during MIS 3 in the northern part of the Carpathian Basin. Values ofcin this paleosol (cf.Fig. 4) are in the range of the values from interglacial soils in the other parts of the Carpathian Basin (Buggle et al., 2009, 2014; Markovic et al., 2011; Stevens et al., 2011; Újvari et al., 2016; Zeeden et al., 2016b), supporting an interpretation of high humidity and enhanced soil moisture. This is also supported by high values ofcfdin the paleosol (cf. Fig. 4).
Moreover, dark soil color suggests a high concentration of humic material and therefore, strong pedogenesis over this period.
Lower values of weathering indices of the Tokaj section, when compared to Bodrogkeresztúr, also indicate weaker weathering at the higher geomorphological position. Consequently, the different geomorphological situated sections of Tokaj and Bodrogkeresztúr did experience slightly different local paleoenvironmental condi- tions; however, both profiles show that paleoclimatic conditions were more humid than in the remaining Carpathian Basin.
5.5. Paleoclimatological conditions during early MIS2
Thecfdalso shows higher values in loess (MIS 2) in comparison to other loess sections of the same period. Values are in the range usually found in MIS 3 paleosols of the Carpathian Basin, or even Fig. 7.Grain size density distribution curves of representative samples from different
stratigraphic depths.
osken et al. / Quaternary International 502 (2019) 95e107 102
higher (Basarin et al., 2014; Buggle et al., 2014; Markovic et al., 2014). The values of the close-by Tokaj section are notably lower, but still higher than other sections in the Carpathian Basin (Basarin et al., 2014; Buggle et al., 2014; Markovic et al., 2014; Zeeden et al., 2016b). Highcandcfdfor loess sediments, supported by low L*, high a* values and low CaO content, proves generally wetter/milder conditions at the Kopasz Hill also during periods of loess formation.
Although milder conditions at the Bodrogkeresztúr section are recorded, two layers at ~280e320 cm and ~360e390 cm clearly
show a high contribution of coarse particles indicating rather high wind intensities or a shorter transport distance (cf. Fig. 6).
These layers may relate to Heinrich Events 3 and/or 2, reported from (south)eastern European loess (Shi et al., 2003; Sümegi et al., 2012; Zeeden et al., 2016a). In particular, Heinrich event 2 has been suggested to be associated with high eolian sedi- mentation rates (Bokhorst et al., 2011). Although the possible events might be covered by the OSL ages of samples C-L3795 and C-L3797, the large uncertainties of the age estimates do not allow Fig. 8.Geochemical properties of the Bodrogkeresztúr section showing the abundance of SiO2, CaO, Al2O3, FeO, P2O5, and Cl. For comparison between thefigures the magnetic susceptibility (MS) is shown. In the uppermost part no samples were taken for laboratory analyses.
Fig. 9.Geochemical weathering indices of the Bodrogkeresztúr section showing the ratios SiO2/Al2O3, SiO2/K2O, Rb/Sr, Ba/Sr, the Chemical Index of Alteration (CIA) and the Chemical Proxy of Alteration (CPA).
osken et al. / Quaternary International 502 (2019) 95e107 103
a straightforward assignment. In the lower layer with high coarse particles content, all other proxies show low values (c,cfd, a* and weathering indices) indicating cold and dry conditions. The layer with high content of coarse particles between ~280 and 320 cm is represented by indications of a weak paleosol development.
Moreover, cand cfd do show a slight decrease, but cfd is still generally high for MIS 2 loess (Fig. 4). This indicates that the general soil humidity was still relatively high, while the eolian dynamics were more intensive or the source area was charac- terized by coarser particles (e.g. due to stronger river discharge).
At the Tokaj section, modeling results of n-alkanes suggest MIS 2 as a period with higher soil moisture, but two dry periods are also observed (Schatz et al., 2011). Relying only on the lumines- cence dating it is challenging to conclude if those two layers of dryer conditions at the Tokaj section are related to two layers with higher sand content at the Bodrogkeresztúr section. How- ever, the vicinity and consistency of their occurrence suggests so.
The data presented in our study points towards a more widely occurring signal related to north Atlantic cold events.
The loess at BKT shows a generally homogeneous geochemical composition. However, a part of the profile between ~210 and 280 cm shows surprisingly high Cl values (cf.Fig. 8). Such high Cl values may be related to a tephra layer (Obreht et al., 2016), but no glass shards were found after detailed microscopic sample examination. This may indicate further contribution from an additional or different source during the formation of this loess layer, and suggests a change in sediment properties. Moreover, the characteristic stratigraphic shape of the anomaly with an abrupt but low amplitude, beginning and a following increase ending in a maximum peak, which is abruptly ceased, speaks for the relocation of parental material with high Cl content. A different geochemical composition suggesting an additional source is further supported by the opposing trends ofcandcfd, suggesting that the contribution from the additional source might have had a higher bulk cthan the main source area, while the climatic conditions were unfavorable for the formation of fine magnetic grains and cfd decreased. Without further proof we refrain from a more in depth interpretation.
5.6. Erosion of uppermost loess (late MIS2)
Another interesting feature of the section investigated at the Kopasz Hill is that the upper loess deposition seems to have ended around 20 ka or was eroded and/or overprinted by Holocene pedogenesis (Schatz et al., 2012). Although we did not date the uppermost part of the profile, one can assume a similar behavior at Bodrogkeresztúr, since sample C-L3799 can be considered rather old in comparison to its depth of 1.69 m. It is noteworthy that stratigraphy and ages compare well between Bodrogkeresztúr and Tokaj, although the geomorphological setting is different (this study: position low in the landscape on the northern side of the Kopasz Hill vs. Schatz et al.: position higher in the landscape on the eastern side of the same hill). For an impression of the section, see also the photograph inSupplementary Fig. S5.
6. Conclusion
The investigated loess-paleosol sequence in northeastern Hungary was dated to 33.5±2.5e28.0±2.1 ka and ~2.5 m of loess accumulation in the dated time frame. While the lowermost part needs to be disregarded in the paleoclimatological investigation due to the (partial) input of alluvial sediment, the remaining section shows several interesting features. It is suggested that the loess originates dominantly from the Tisza River floodplain and that sediment was transported predominantly from a north-eastern direction. We conclude that the general climatic conditions dur- ing the late MIS 3 and early MIS 2 were more humid than in most of the Carpathian Basin. However, short relatively dry periods are recorded as well. This supports an overall observation based on mollusk results from the Carpathian Basin that the northern part was more humid (but colder), and that the paleoenvironmental evolution was more dynamic (Rudner and Sümegi, 2001; Sümegi and Krolopp, 2002; B€osken et al., accepted). Temperatures were higher and the relative humidity was lower in the southern Car- pathian Basin, suggesting steppic environmental conditions (Markovic et al., 2007, 2015). Additionally, we highlight that the foothill areas apparently provided unique microclimatic conditions in the Carpathian Basin that were more humid and had higher biomass production than in the basin itself, at least during the last
~30e50 ka (also supported by Schatz et al., 2011). This may be related to an increased occurrence of Upper Paleolithic findings along the foothill areas around the Carpathian Basin, as suggested for the Aurignacian (e.g. Floss et al., 2016), supporting a more favorable environment in these elevated positions. Also,Sümegi et al. (2016)point out that the local environment of the oldest Gravettian sites occur along creek valleys and mixed taiga wood- lands and loess-covered hills of spruce and steppe forests. The absence of discovered artifacts outside of the foothill area and the occurrence of camp sites repeatedly within spruce forests within this period (Sümegi et al., 2016), may be interpreted as highlighting a selective preference of the Gravettian population for these environments.
Acknowledgments
The investigations were carried out within CRC 806“Our way to Europe”, subproject B1 “The Eastern Trajectory: Last Glacial Paleogeography and Archaeology of the Eastern Mediterranean and of the Balkan Peninsula”, supported by the DFG (Deutsche For- schungsgemeinschaft, grant number INST 216/596-2). All physical and chemical data obtained in this study are available in the CRC806 database (seeB€osken et al., 2017c). We thank Anja Zander for the assessment of the radionuclide concentrations and her help in the Cologne Luminescence Laboratory. We thank Marianne Fig. 10.A-CN-K diagram. Sample distribution in the diagram indicates domination of
silicate weathering.
osken et al. / Quaternary International 502 (2019) 95e107 104
Dohms and her team from the sedimentological Laboratory at the RWTH Aachen University for the measurements of the sedimen- tological and geochemical samples. Further, the authors would like to thank David Molnar and Balazs Sümegi for help duringfield- work, and Philipp Schulte and Daniel Veres for fruitful discussions.
Finally, we thank Wei Chu for his assistance in thefield, his advice on the manuscript and the preparation of the radiocarbon sample.
Appendix A. Supplementary data
Supplementary data related to this article can be found at https://doi.org/10.1016/j.quaint.2017.12.008.
References
Auclair, M., Lamothe, M., Huot, S., 2003. Measurement of anomalous fading for feldspar IRSL using SAR. Radiat. Meas. 37, 487e492. https://doi.org/10.1016/
S1350-4487(03)00018-0.
Babek, O., Chlachula, J., Grygar, T.M., 2011. Non-magnetic indicators of pedogenesis related to loess magnetic enhancement and depletion: examples from the Czech Republic and southern Siberia. Quat. Sci. Rev. 30, 967e979. https://
doi.org/10.1016/j.quascirev.2011.01.009.
Basarin, B., Buggle, B., Hambach, U., Markovic, S.B., Dhand, K.O., Kovacevic, A., Stevens, T., Guo, Z., Lukic, T., 2014. Time-scale and astronomical forcing of Serbian loessepaleosol sequences. Glob. Planet. Change 122, 89e106.https://
doi.org/10.1016/j.gloplacha.2014.08.007.
Baumgart, P., Hambach, U., Meszner, S., Faust, D., 2013. An environmental magnetic fingerprint of periglacial loess: records of Late Pleistocene loessepalaeosol se- quences from Eastern Germany. Quat. Int. 296, 82e93.https://doi.org/10.1016/
j.quaint.2012.12.021.
Bell, W.T., 1980. Alpha dose attenuation in quartz grains for thermoluminescence dating. Anc. TL 12, 4e8.
Bokhorst, M.P., Vandenberghe, J., Sümegi, P., Łanczont, M., Gerasimenko, N.P., Matviishina, Z.N., Markovic, S.B., Frechen, M., 2011. Atmospheric circulation patterns in central and eastern Europe during the Weichselian Pleniglacial inferred from loess grain-size records. Quat. Int. 234, 62e74.https://doi.org/
10.1016/j.quaint.2010.07.018.
B€osken, J., Klasen, N., Zeeden, C., Obreht, I., Markovic, S.B., Hambach, U., Lehmkuhl, F., 2017. New luminescence-based geochronology framing the last two glacial cycles at the southern limit of European Pleistocene loess in Stalac.
Geochronometria 44, 150e161.https://doi.org/10.1515/geochr-2015-0062.
B€osken, J., Sümegi, P., Zeeden, C., Klasen, N., Gulyas, S., Lehmkuhl, F., 2017. Inves- tigating the last glacial Gravettian site“Sagvar Lyukas Hill”(Hungary) and its paleoenvironmental and geochronological context using a multi-proxy approach. Palaeogeogr. Palaeoclimatol. Palaeoecol. https://doi.org/10.1016/
j.palaeo.2017.08.010(in press).
B€osken, J., Zeeden, C., Klasen, N., Obreht, I., Hambach, U., Sümegi, P., Lehmkuhl, F., 2017c. Paleoclimatic Proxy Data from the MIS3/2 Transition Recorded at the Bodrogkeresztúr Loess-paleosol Sequence in Northeast Hungary. CRC806- Database.https://doi.org/10.5880/SFB806.38.
Bradak, B., 2009. Application of anisotropy of magnetic susceptibility (AMS) for the determination of paleo-wind directions and paleo-environment during the accumulation period of Bag Tephra, Hungary. Quat. Int. 198, 77e84.https://
doi.org/10.1016/j.quaint.2007.11.005.
Buggle, B., Glaser, B., Z€oller, L., Hambach, U., Markovic, S., Glaser, I., Gerasimenko, N., 2008. Geochemical characterization and origin of southeastern and Eastern European loesses (Serbia, Romania, Ukraine). Quat. Sci. Rev. 27, 1058e1075.
https://doi.org/10.1016/j.quascirev.2008.01.018.
Buggle, B., Hambach, U., Glaser, B., Gerasimenko, N., Markovic, S.B., Glaser, I., Z€oller, L., 2009. Stratigraphy, and spatial and temporal paleoclimatic trends in Southeastern/Eastern European loessepaleosol sequences. Quat. Int. 196, 86e106.https://doi.org/10.1016/j.quaint.2008.07.013.
Buggle, B., Glaser, B., Hambach, U., Gerasimenko, N., Markovic, S., 2011a. An eval- uation of geochemical weathering indices in loessepaleosol studies. Quat. Int.
240, 12e21.https://doi.org/10.1016/j.quaint.2010.07.019.
Buggle, B., Glaser, B., Hambach, U., Gerasimenko, N., Markovic, S., 2011b. An eval- uation of geochemical weathering indices in loessepaleosol studies. Quat. Int.
240, 12e21.https://doi.org/10.1016/j.quaint.2010.07.019.
Buggle, B., Hambach, U., Kehl, M., Markovic, S.B., Z€oller, L., Glaser, B., 2013. The progressive evolution of a continental climate in southeast-central European lowlands during the Middle Pleistocene recorded in loess paleosol sequences.
Geology 41, 771e774.https://doi.org/10.1130/G34198.1.
Buggle, B., Hambach, U., Müller, K., Z€oller, L., Markovic, S.B., Glaser, B., 2014. Iron mineralogical proxies and Quaternary climate change in SE-European loessepaleosol sequences. CATENA 117, 4e22. https://doi.org/10.1016/
j.catena.2013.06.012.
Buylaert, J.-P., Jain, M., Murray, A.S., Thomsen, K.J., Thiel, C., Sohbati, R., 2012.
A robust feldspar luminescence dating method for Middle and Late Pleistocene sediments: Feldspar luminescence dating of Middle and Late Pleistocene sedi- ments. Boreas 41, 435e451.https://doi.org/10.1111/j.1502-3885.2012.00248.x.
Chu, W., Lengyel, G., Zeeden, C., Pentek, A., Kaminska, L., Mester, Z., 2017. Evaluating upper paleolithic surface collections from loess-like sediments in the Northern Carpathian Basin. Quat. Int. https://doi.org/10.1016/j.quaint.2017.05.017 (in press).
Conard, N.J., Bolus, M., 2003. Radiocarbon dating the appearance of modern humans and timing of cultural innovations in Europe: new results and new challenges. J. Hum. Evol. 44, 331e371.https://doi.org/10.1016/S0047-2484(02) 00202-6.
Conard, N.J., Bolus, M., 2008. Radiocarbon dating of the late Middle Paleolithic and the Aurignacian of the Swabian Jura. J. Hum. Evol. 55, 886e897.https://doi.org/
10.1016/j.jhevol.2008.08.006.
Constable, C., Tauxe, L., 1990. The bootstrap for magnetic susceptibility tensors.
J. Geophys. Res. 95, 8383e8395.https://doi.org/10.1029/JB095iB06p08383.
Derbyshire, E., 2003. Loess, and the dust indicators and records of terrestrial and marine palaeoenvironments (DIRTMAP) database. Quat. Sci. Rev. 22, 1813e1819.
https://doi.org/10.1016/S0277-3791(03)00209-9.
Dobosi, V.T. (Ed.), 2000. BodrogkeresztúreHenye (NE Hungary) Upper Palaeolithic Site. Magyar Nemzeti Múzeum Kiadvanya, Budapest.
Durcan, J.A., King, G.E., Duller, G.A.T., 2015. DRAC: dose rate and age calculator for trapped charge dating. Quat. Geochronol. 28, 54e61.https://doi.org/10.1016/
j.quageo.2015.03.012.
Evans, M.E., Heller, F., 2001. Magnetism of loess/palaeosol sequences: recent de- velopments. Earth Sci. Rev. 54, 129e144. https://doi.org/10.1016/S0012- 8252(01)00044-7.
Floss, H., Fr€ohle, S., Wettengl, S., 2016. The aurignacian along the danube - its two- Fold role as a Transalpine and Cisalpine passageway of early Homo Sapiens into Europe. In: Krauss, R., Floss, H. (Eds.), Proceedings of the International Work- shop within the Collaborative Research Centres Sfb 1070“RessourcenKulturen”, Schloss Hohentübingen, 9th of May 2014. Presented at the Southeast Europe before Neolithisation. Universit€at Tübingen, pp. 13e39.
Guerin, G., Mercier, N., Nathan, R., Adamiec, G., Lefrais, Y., 2012. On the use of the infinite matrix assumption and associated concepts: a critical review. Radiat.
Meas. 47, 778e785.https://doi.org/10.1016/j.radmeas.2012.04.004.
Guo, Z.T., Ruddiman, W.F., Hao, Q.Z., Wu, H.B., Qiao, Y.S., Zhu, R.X., Peng, S.Z., Wei, J.J., Yuan, B.Y., Liu, T.S., 2002. Onset of Asian desertification by 22 Myr ago inferred from loess deposits in China. Nature 416, 159e163.https://doi.org/10.1038/
416159a.
Hao, Q., Oldfield, F., Bloemendal, J., Guo, Z., 2008. Particle size separation and evi- dence for pedogenesis in samples from the Chinese Loess Plateau spanning the past 22 my. Geology 36, 727e730.
Hauck, T.C., Lehmkuhl, F., Zeeden, C., B€osken, J., Thiemann, A., Richter, J., 2017. The Aurignacian way of life: Contextualizing early modern human adaptation in the Carpathian Basin. Quat. Int. https://doi.org/10.1016/j.quaint.2017.10.020 (in press).
Heller, F., Liu, T., 1984. Magnetism of Chinese loess deposits. Geophys. J. Int. 77, 125e141.https://doi.org/10.1111/j.1365-246X.1984.tb01928.x.
Hosek, J., Hambach, U., Lisa, L., Grygar, T.M., Horacek, I., Meszner, S., Knesl, I., 2015. An integrated rock-magnetic and geochemical approach to loess/paleosol sequences from Bohemia and Moravia (Czech Republic): implications for the Upper Pleis- tocene paleoenvironment in central Europe. Palaeogeogr. Palaeoclimatol. Palae- oecol. 418, 344e358.https://doi.org/10.1016/j.palaeo.2014.11.024.
Huntley, D.J., Baril, M.R., 1997. The K content of the K-feldspars being measured in optical dating or in thermoluminescence dating. Anc. TL 15, 11e12.
Huntley, D.J., Hancock, R.G.V., 2001. The Rb contents of the K-feldspar grains being measured in optical dating. Anc. TL 19, 43e46.
Iovita, R., Dobos¸, A., Fitzsimmons, K.E., Probst, M., Hambach, U., Robu, M., Vlaicu, M., Petculescu, A., 2014. Geoarchaeological prospection in the loess steppe: pre- liminary results from the lower danube Survey for paleolithic sites (LoDanS).
Quat. Int. 351, 98e114.https://doi.org/10.1016/j.quaint.2013.05.018.
ISO International Standard 13320, 2009. Particle Size AnalysisdLaser Diffraction Methods.
Jelinek, V., 1977. The Statistical Theory of Measuring Anisotropy of Magnetic Sus- ceptibility of Rocks and its Application. Geofyzika. Brno 87, 4.
Kels, H., Protze, J., Sitlivy, V., Hilgers, A., Zander, A., Anghelinu, M., Bertrams, M., Lehmkuhl, F., 2014. Genesis of loess-like sediments and soils at the foothills of the Banat Mountains, Romaniaeexamples from the paleolithic sites Rom^anes¸ti and Cos¸ava. Quat. Int. 351, 213e230.https://doi.org/10.1016/j.quaint.2014.04.063.
Krauß, L., Zens, J., Zeeden, C., Schulte, P., Eckmeier, E., Lehmkuhl, F., 2016. A multi- proxy analysis of two loess-paleosol sequences in the Northern Harz Foreland, Germany. Palaeogeogr. Palaeoclimatol. Palaeoecol. 461, 401e417. https://
doi.org/10.1016/j.palaeo.2016.09.001.
Kukla, G., Heller, F., Ming, L.X., Chun, X.T., Sheng, L.T., Sheng, A.Z., 1988. Pleistocene climates in China dated by magnetic susceptibility. Geology 16, 811e814.
https://doi.org/10.1130/0091-7613(1988)016<0811:PCICDB>2.3.CO;2.
Kukla, G.J., 1977. Pleistocene landdsea correlations I. Europe. Earth-Science Rev. 13, 307e374.https://doi.org/10.1016/0012-8252(77)90125-8.
Liritzis, I., Stamoulis, K., Papachristodoulou, C., Ioannides, K., 2013. A re-evaluation of radiation dose-rate conversion factors. Mediterr. Archaeol. Archaeom. 13, 1e15.
Lukic, T., Basarin, B., Buggle, B., Markovic, S.B., Tomovic, V.M., Raljic, J.P., Hrnjak, I., Timar-Gabor, A., Hambach, U., Gavrilov, M.B., 2014. A joined rock magnetic and colorimetric perspective on the Late Pleistocene climate of Orlovat loess site (Northern Serbia). Quat. Int. 334e335, 179e188. https://doi.org/10.1016/
j.quaint.2014.03.042.
Markovic, S.B., Oches, E.A., McCoy, W.D., Frechen, M., Gaudenyi, T., 2007.
osken et al. / Quaternary International 502 (2019) 95e107 105