Carpathian Journal of Earth and Environmental Sciences, August 2021, Vol. 16, No. 2, p. 361 – 372; DOI:10.26471/cjees/2021/016/181
INVESTIGATION THE RELATION BETWEEN THE RECENT LAND COVER AND THE EURASIAN SKYLARK (ALAUDA ARVENSIS)
POPULATION CHANGES IN EUROPEAN SCALE
Nándor CSIKÓS
1,*& Péter SZILASSI
11Department of Geoinformatics, Physical and Environmental Geography, University of Szeged, Egyetem u. 2-6, H-6722 Szeged, Hungary; e-mail: toto@geo.u-szeged.hu, *Correspondence: csikos@geo.u-szeged.hu
Abstract: In Europe, the most widespread land cover category is agriculture, including Non-irrigated arable land. The agricultural land cover category includes various types of land use with different levels of human impact. The heterogeneity and spatial structure of these landscapes vary among regions and countries, but the decline of farmland bird species population can be observed in almost all European countries. This decrease can be detected from the abundance data of farmland birds, such as the Eurasian skylark (Alauda arvensis). Some small-scale studies have analysed the relation between country- and regional-level land cover types and the population data of farmland birds. Europe-wide analysis is necessary to detect the land use land cover (LULC) types that are suitable habitat for the skylark and to compare the population density data of skylarks in Hungary and Schleswig-Holstein, with the pan-European LULC datasets. In this study, we used the Corine Land Cover (CLC) 2012 dataset from the European Union and two (Hungarian and German) bird monitoring datasets were aggregated at the same grid size (5 × 5 km). Based on the CLC land cover dataset, we identified the land cover types of the Eurasian skylark habitat. We performed our statistical calculations by generalised linear models (GLMs) in R to determine the impact of land cover types on the abundance of skylarks. We applied negative binomial models to account for the over-dispersion of the skylark abundance data and the step AIC function with the stepwise function in both directions. In Hungary, we found a significant positive relation between skylark abundance and the Natural grassland LULC category and six significant negative relation s (e.g., Fruit trees and berry plantations; Complex cultivation patterns and Forests). In Schleswig-Holstein, we found significant positive relations between skylark abundance and Pastures and Natural grasslands. We identified the land cover types which shows positive relation s with skylark abundance as skylark habitat areas and the land cover types with negative relations with skylark abundance as skylark non-habitat areas. We calculated the habitat and non-habitat areas of the Eurasian skylark for each grid size (5 × 5 km) of CLC database and visualised the habitat changes between 2000 and 2018. We calculated habitat changes of European countries and compared it with the country level population change data of Eurasian skylark. Based on this he European-scale habitat change map of skylark we can detect habitat change hotspots of this farmland bird in European scale.
Keywords: Eurasian skylark; land cover; land cover change; habitat change; habitat change estimation;
Corine Land cover
1. INTRODUCTION
In the XXI century, the dominant terrestrial ecosystem in the world is agriculture, including Non- irrigated arable land, which accounts for 38% of all land cover (FAO, 2016). In Europe this value is much higher, at 45% (EBCC, 2020). The agricultural land cover of the rural areas includes various types of land use with different levels of human impact. The heterogeneity and spatial structure of agrarian
landscapes vary among regions and countries, but the decline of farmland biodiversity can be observed worldwide. This decline can be detected in the abundance data of farmland birds (Morelli et al., 2020; Wretenberg et al., 2007). Many studies report that the decreasing trend in farmland birds has a significant relation with the intensive agricultural farming, landscape patterns and land cover diversity (Gil-Tena et al., 2015, Moreira et al., 2005, Orłowski
& Ławniczak, 2009, Piha et al., 2003). Most articles
focus on small-scale studies and analyse the relations between skylark abundance and crop type, height, coverage and heterogeneity (Berg et al., 2015, Gottschalk et al., 2010, Guerrero et al., 2012, Hoffmann, et al., 2018, Praus & Weidinger, 2015, Redlich, et al., 2018, Szilassi, et al., 2019). Some large-scale studies analyse the relations between country- and regional-level land cover types and the abundance data for farmland birds (Szilassi et al., 2019). Europe-wide analyses are necessary to detect the land cover types that are suitable environment for the Eurasian skylark (Alauda arvensis). Here, we compare the habitat preferences of this farmland bird in the two study areas (Hungary and Schleswig- Holstein, North-Germany) based on pan-European datasets. Analyses of these two study areas with different landscape characteristic are needed, because could vary the habitat preferences of skylark and there are different drivers of habitat changes across Europe.
The skylark is the most distinctive bird of the agrarian landscape in Europe. In the European Union, the Eurasian skylark has a declining trend in population between 2000 and 2018: Norway -47%, Lithuania -41%, France -38%, Czech Republic - 29%, Hungary -24% and Germany -17%. Most skylarks leave Hungary and Germany to settle in the Mediterranean region for the winter time (Csörgo et al., 2009). The skylark was introduced into the Americas, Asia, Australia and New Zealand except the Nearctic and in high mountains (Cramp, 1988).
The habitat preferences, including crop structure and heterogeneity, of the skylark are well-known. Large- scale studies have provided general knowledge about the skylark’s continental- and regional-wide preferences for habitat and land cover heterogeneity (Szilassi et al., 2019). However, only a few studies have analysed the relations between skylark abundance and land cover types across Europe, and fewer studies have estimated habitat changes on a European scale. To estimate changes in the skylark’s habitat, first we have to identify the land cover types that serve as habitat for the skylark. The second step is to determine the impact of land cover changes on the skylark’s abundance changes.
In this study we used the Corine Land cover 2012 (CLC 2012) dataset from the European Union and two bird monitoring datasets on regional scale.
We used CLC 2012 to identify the land cover types of the skylark’s habitat, and based on this dataset, we estimated the impacts of disparate land cover types on the skylark’s population in Europe. Based on the model’s results, we can describe the optimal landscape composition for this species in Europe.
Our outcomes may be helpful for further researches
of recent land cover changes related to this species in other countries. The skylark abundance data were acquired from the Hungarian Common Bird Monitoring (MMM) database and from the Ornithological Working Group of Schleswig- Holstein and Hamburg (Südbeck et al., 2005, Tibor Szép et al., 2012). The following were the main goals of this study:
• To determine and analyse the impact of land cover types on the skylark’s abundance on regional scale.
• To compare with each other the habitat changes and the skylark’s population trend changes in European scale.
The results of this study are expected to be valuable for understanding the environmental background the changes in the abundance of the skylark. The results could also be useful for studying other situations or for analysis of the impact of landscape composition on the populations of farmland birds.
2. MATERIALS AND METHODS 2.1. Study area
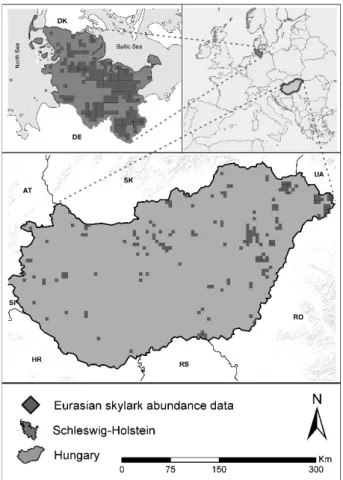
Hungary is placed in Central Europe and in the Carpathian Basin (45°43' to 48°35'N and 16°06' to 22°53'E), which is part of the Pannonian biogeographic region (Fig. 1). The country has an area of 93,033 km2, and is characterized by an elevation between 77 and 1014 m a.s.l. The agricultural land is the most important land cover type, and 61% of the country is cultivated as non- irrigated arable land (Farkas & Lennert, 2015). An additional 20.7% consists of grassland and forest, and 5.5% consists of built-up areas.
Schleswig-Holstein Federal State is located in Northern Germany. This area is surrounded by the sea on east (North Sea) and west (Baltic Sea), and it is bordered by Denmark on the north (Fig. 1). The most important land cover type is agricultural land, and 48% of the state is covered by non-irrigated arable land. An additional 38% is covered by grassland and forest and 8.5% is covered by built-up areas.
2.2. Databases
2.2.1. Abundance data of the skylark
In Hungary, a country-wide bird-monitoring survey has been conducted each year from 1999 by approximately 800 field surveyors. The establishment of the Hungarian Common Bird Monitoring Database (MMM) has been resulted by their work (Szép &
Gibbson, 2000; Szép & Nagy, 2001; Szép et al., 2012).
Figure 1. Study areas and spatial distribution of the grids, which contain Eurasian skylark abundance (number of grids: Hungary 175, Schleswig-Holstein 207)
With 2.5 × 2.5 km UTM quadrants covering the whole country, it was delineated as a bird-monitoring mapping unit before the surveys. This article focuses on the grid cells. Point counts within a 100-metre radius from each point (25 points in each UTM grid cell with a minimum distance of 500 m) was carried out during two spring visits. Samplings were performed between mid-April and mid-June, with a minimum of 2 weeks between samplings. The counts were performed at the morning between 5 and 10 am when there was no rainfall and the wind speed was less than 5 m/s. Our bird abundance dataset fits in time to our land cover database from 2012. We ordered the neighbouring 4 quadrants into 5x5 km grid (178 grid) to generalized the Hungarian dataset to the same as the Schleswig-Holstein dataset.
The survey of the skylark abundance data in Schleswig-Hosltein have been performed by the
Ornithological Working Group of Schleswig- Holstein and Hamburg (Ornithologische Arbeitsgemeinschaft für Schleswig-Holstein und Hamburg). The data collection was maintained by the ADEBAR (Der Atlas Deutscher Brutvogelarten) project between 2005 and 2009. All the breeding bird species have been mapped in the federal state by the approximately 150 surveyors. Samplings were performed between end of March and May, with a minimum of 2 weeks between samplings. The survey was managed inside the border grid of TK25 (Topographic map 1:25 000), where the area of each unit is approximately 120 km2 (Südbeck et al., 2005). Each TK25 unit was split into four 5 x 5 km grid cells (Südbeck et al., 2005). 646 5 x 5 km TK25 grid cells take place in Schleswig-Holstein, of which 380 were surveyed (59 %). 207 grid cells have been used, which contains the latest population data from 2009.
2.2.2. CLC Database 2012
The Corine Land Cover datasets were produced using the same methods for all European Union countries (EEA, 2006, EEA and ETC-TE, 2017). The 1:100,000 scale datasets have a 25ha minimum mapping unit for patches and 100 m minimum width for linear elements. The first CLC dataset were prepared in 1990 and then it was repeated in every 6 years. 44 land cover and land use categories are included in the dataset, 30 categories are suited in Schleswig-Holstein and in Hungary there are 28 categories (EEA and ETC-TE, 2017).
The study areas contain 21 level 3 CLC categories.
2.3. Data analysis
For our investigations we used the grids of the bird surveys from the two study areas in the same grid size (5 × 5 km). The proportion of land cover types (all CLC category) and the skylark population were determined inside the grids. There were no homogeneous landscapes inside the grids. We applied a preliminary test to identify the group of correlated a preliminary test to identify the group of correlated land cover categories applying variance inflation factors (VIFs). The VIF values ranging between 1 and 1.8,
Table 1. Descriptive statistics of the Eurasian skylark’s bird monitoring datasets from Hungary and Schleswig-Holstein Study area Number of
grids
Area of grids (km2)
Skylark abundance
Minimum Maximum Total Mean SD
Hungary 178 4450 1 230 1617 9.1 21.38
Schleswig-
Holstein 207 5175 1 375 8325 40.22 40.42
which means that the explanatory variables were not linearly related, so the multicollinearity is low between the variables (LULC types and indices). We performed our statistical calculations by generalised linear models (GLMs) to determine the impact of land cover on the abundance of the skylark. The CLC 2012 dataset was used in the two study areas. In Hungary we used the CLC 2012 dataset and the abundance data from 2012.
For Schleswig-Holstein we have abundance data from 2009 and CLC data from 2012, but they can be used together, because the landscape usually changes less than 1% per year (European Environment Agency, 2017). The Non-irrigated arable land category was not put into the model, because in Hungary and other European countries, the agricultural land is the matrix (dominant LULC type) in the landscape, so the proportion of this category shows strong autocorrelations with other LULC types. To account for the over-dispersion of the skylark population data, negative binomial models have been applied (tested by overdispersion test function of AER package in R).
Models with all explanatory variables (CLC categories) were generated, and Akaike’s information criterion has been used to rank them with the ‘dredge’
function of the ‘MuMin’ package in R (Barton, 2015).
The ‘LmerTest’ package were used to determine he significance value of the variables (Kuznetsova et al., 2020). We also performed GLM using the stepAIC function with the stepwise function in both directions.
In further analyses, we used the selected variables by the stepwise function. We constructed two groups from the land cover categories of the CLC database on the basis of GLM results, namely, preferred (significant positive relation) and nonpreferred (significant negative relation) land cover types.
Mean patch size and number of patches of all land cover types have been calculated to compare the landcover categories and to help understand the differences between the study areas and the results.
We estimated the habitat change of the skylark based on the CLC datasets from 2000 and 2018 in ArcGis 10.3. We generated a 5 × 5 km grid over all Europe where the CLC datasets available.
We calculated changes in land cover types that were related to the skylark’s abundance based on the GLMs, and the estimated habitat change was mapped in each grid cell. The following equation represents the calculation of the summarized skylark’s habitat change in the grid cells (SHc):
(1) 𝑆𝑆𝑆𝑆𝑆𝑆 =−(∑ 𝑆𝑆𝑐𝑐𝑆𝑆) +∑ 𝑆𝑆𝑆𝑆
where cNH represents total changes non-habitat LULC types inside the grid and cH represents total changes in the habitat LULC types areas inside each grid cells respectively.
We used the Jenks natural breaks method (Jenks, 1967) to classify the summarized habitat changes into five classes: strong negative changes (from -2500 to -1123 ha), intermediate negative changes (from -1122 to -314 ha), minor negative changes (from -313 to 281 ha), intermediate positive changes (from 282 to 1067 ha) and strong positive changes (from 1068 to 2500 ha).
The relation between the bird population change (percent) and the habitat and non-habitat change (percent) by countries were calculated.
Spearman’s rank correlation analysis has been applied. The European common farmland bird index including the skylark trend was calculated by the data of Organisation for Economic Cooperation and Development (OECD); National BirdLife organisations. We analysed the correlation between the skylark’s population trend and habitat decrease (HD), total habitat decrease and non-habitat increase (THD), total habitat increase and non-habitat decrease (THI). Following equations were used for the habitat change calculations:
(2)𝑆𝑆𝐻𝐻 =∑ 𝑆𝑆𝐻𝐻 (3)𝑇𝑇𝑆𝑆𝐻𝐻=∑ 𝑆𝑆𝐻𝐻+∑ 𝑐𝑐𝑆𝑆𝑁𝑁
(4)𝑇𝑇𝑆𝑆𝑁𝑁=∑ 𝑆𝑆𝑁𝑁+∑ 𝑐𝑐𝑆𝑆𝐻𝐻
where HD represents the total negative changes of habitat LULC types in each country; NHI represents the total positive changes of habitat LULC types in each country; HI represents the total positive changes of habitat LULC types and NHD represents the total negative changes of non-habitat LULC types in each country.
3. RESULTS
3.1. Relations between skylark abundance data and land cover types in the study areas
We investigated the relations between skylark abundance data and land cover types in Hungary.
Table 2 shows a summary of the results based on GLM models after the stepAIC function. Two land cover types were negatively correlated with skylark abundance at the 0.05 significance level: Fruit trees and berry plantations) and Complex cultivation patterns. Five land cover types were negatively correlated (p < 0.001) with skylark abundance:
Construction sites, Green urban areas Broad-leaved forest), Coniferous forest and Inland marshes). Only one land cover type was positively correlated with skylark abundance (p < 0.05): Natural grassland.
Table 2 also shows the relations between skylark abundance and land cover categories in Schleswig-Holstein on the basis of GLM models after
the stepAIC function. We obtained results at different levels of significance. The Discontinuous urban fabric land cover type was negatively correlated with skylark abundance at p < 0.001, and two land cover types were negatively correlated with skylark abundance at p < 0.05: Mixed Forest and Water bodies. Three land cover types were positively correlated with skylark abundance: Pastures (code 231, p < 0.05), Natural grassland (p < 0.01) and Inland marshes (p < 0.05).
The fourth column of Table 2 shows the land cover categories (green and red colours) that we have taken under consideration in the further European-scale analysis. The category of Inland marshes was positively correlated in Schleswig- Holstein and negatively correlated in Hungary with skylark abundance, and therefore we removed this category from further analysis.
3.2. Calculation of Eurasian skylark’s habitat change in European scale between 2000 and 2018
Based on the results of the land cover type analysis and the habitat and non-habitat area calculations in
the grids, we made a European-scale map of the skylark’s habitat changes. The five LULC types show perfectly the changes in every country, and based on visual interpretation, we can identify the hot spots of habitat change. The countries most negatively affected by the skylark’s habitat changes were Finland (–9.09%), the United Kingdom (–4.24%), Greece (–3.42%), Andorra (–3.35%), Slovakia (–
3.2%), the Netherlands (–2.95%), Denmark (–2.65%), Switzerland (–2.27%) and Hungary (–2.2%). The changes are better described according to the components of habitat change. There are four components: habitat areas decrease, non-habitat areas increase, habitat areas increase and non-habitat areas decrease. The positive CLC categories changed the most in the negative direction in the United Kingdom (–9.91%), Andorra (–6.6%), Switzerland (–5.07%), Denmark (–4.99%), Germany (–4.97%), Ireland (–
4.59%), Spain (–4.5%), Slovakia (–3.7%), Hungary (–3.68%) and the Netherlands (–3.5%). A high proportion of the LULC changed into habitat in Ireland (10.23%), the United Kingdom (5.23%), Romania (4.42). The values of the four components for each country are shown in Figure 2.
Table 2. Summary table of CLC categories (in ha) showing the GLM results, estimated parameter values ± SD of each explanatory variable on skylark abundance
CLC name,
Hungary Schleswig-Holstein In Eu-scale
prediction Estimate SE 95% CI Estimate SE 95% CI
Discontinuous urban
fabric No significant relation –0.027*** 0.007 –0.04 to
–0.014 –
Construction sites –0.413* 0.186 –0.776 to
–0.043 No significant relation – Green urban areas –0.316* 0.135 −0.606 to
–0.055 No significant relation – Fruit trees and berry
plantations –0.089** 0.029 –0.149 to
–0.027 No significant relation – Pastures No significant relation 0.006* 0.002 0.002 to
0.01 +
Complex cultivation
patterns –0.07** 0.022 –0.112 to
–0.028 No significant relation – Broad-leaved forest –0.012* 0.005 –0.021 to
–0.002 No significant relation – Coniferous forest –0.099* 0.042 –0.179 to
–0.018 No significant relation – Mixed forest No significant relation –0.049* 0.022 –0.092 to
–0.002 –
Natural grassland 0.008* 0.004 –0.001 to
0.017 0.073** 0.027 0.009 to
0.145 +
Inland marshes –0.098* 0.039 –0.174 to
–0.017 0.111* 0.053 –0.014 to 0.276 Water bodies No significant relation –0.016* 0.007 –0.029 to
–0.002 –
Observations: 175;
R2 Nagelkerke: 0.386
Observations: 207;
R2 Nagelkerke: 0.371
*p < 0.05, **p < 0.01, *** p < 0.001.
See Table A2 in the Appendix for detailed description of the Corine Land Cover categories.
Figure 2. Changes in the habitat and non-habitat areas of the Eurasian skylark
The results map (Fig. 3) shows the hotspots of habitat change at the country level. Many habitat declines can be found from east to west in the outer eastern Carpathians (Romania); in Finland close to the Russian border and the Lapland region; in Sweden, mostly in the Svealand region; in Schleswig-Holstein, Lower Saxony and Saxony in Germany; in the neighbourhood of Oxford and the south-west part of Scotland in the United Kingdom;
between Bern and Zürich in Switzerland and in Catalonia and the Sevilla-Cordoba axis in Spain.
The skylark’s habitat increased in several regions in Europe: the Transylvania region in Romania, eastern Croatia, eastern Austria, southern Germany, southern England, southern (Cork) and northern Ireland and Gascogne National Park in France.
The result of correlation test between the skylark population changes and the estimated habitat change shows significant negative correlations, if the habitat areas decrease and the non-habitat areas increase (Table 3). The increase of habitat areas and decrease of non-habitat areas show a significant positive correlation with the skylark abundance data.
4. DISCUSSION
This study underpins the importance of general open-habitat changes of Eurasian skylark in Europe, suggesting that on-going land cover and habitat changes may strongly affect the distribution in most of its European range. We investigated the relations between land cover types and the abundance data of the skylark in two study areas in Europe. In the Hungarian study areas, the GLM based model between the skylark abundance data and LULC types in case of eight LULC types showed significant statistical connections. The skylark population data has significant relation with six LULC categories in Schleswig-Holstein (Germany). Habitat changes of the skylark in Europe has been modelled based on our results. The summarised LULC based habitat changes by countries are in accordance with the trends of the skylark population in each country. The habitat decline of the skylark was the strongest in the United Kingdom, Ireland, Germany, Denmark, Hungary, Slovakia and Spain.
4.1. Land cover types which show significant positive statistical relations with the skylark population
In case of the Hungarian study area, the Natural grassland LULC type was positively connected with skylark abundance. This LULC type is an important habitat area for farmland birds (Morelli, 2013). In central and eastern Europe, land abandonment has caused an increase in grassland, which is an important habitat for the skylark when it has not changed into scrub or bushy areas (Tryjanowski et al., 2011). There was no significant relation between skylark abundance and the Pastures category, because intensive grassland management in Hungary can be directly damaging to breeding skylarks (Koleček et al., 2015). Heldbjerg et al., 2017 found that the change from grazing to mowing caused significant decline in the trend of skylark in Denmark (Heldbjerg et al., 2018).
The results of German study area (Schleswig- Holstein) showed significant statistical connections s between skylark data and land cover categories in five LULC types. One of the most typical habitat of the skylark is pasture, because they are exposed to grazing, which maintains a low vegetation and homogeneous structure (moderate grazing does not disturb the skylark) (Cramp, 1988; Hoffmann, et al., 2016;
Koleček et al., 2015; Nagy, et al., 2009). The Pastures and Natural grassland LULC types are suitable habitats if the height of the cover is less than 40 cm (Suárez et al., 2003).
Figure 3. Estimated changes in habitat of the Eurasian skylark in 36 European countries between 2000 and 2018 based on GLM results and CLC 2000 and 2018 datasets.
Table 3. Spearman’s rank correlation between the estimated habitat changes and skylark population trend Habitat
decrease
Habitat decrease and non- habitat increase
Habitat increase and non- habitat decrease Trend of skylark
population by countries -0.528** -0.553** 0.455*
Number of pairs 25 25 25
*p < 0.05, **p < 0.01 We obtained different results in the selected
two European study areas in Europe. Based on other studies (Tryjanowski et al., 2011), the differences are due to the different locations of the study areas in western and central-eastern Europe. There are differences between western and central-eastern Europe in the role of agriculture in the level of intensification (Tryjanowski et al., 2011). In Hungary, agriculture follows a mixed system, where intensive and traditional farming exist side by side (Báldi & Faragó, 2007). In Schleswig-Holstein, the size of the agricultural parcels differs in different parts of the state. The eastern part of the state is a traditional agricultural area with relatively large parcels. Land in the middle part is traditionally used as meadow and pastureland for livestock farming in small separated parcels, and the west has medium- and large-size arable land or grassland fields.
4.2. Land cover types which show significant negative statistical relations with the skylark population
We observed negative statistical connections between skylark abundance and seven CLC land cover categories in Hungarian study areas. The construction sites and Green urban LULC types.
These two LULC category are part of the artificial surfaces first level CLC class. Construction sites are similar LULC categories to built-up areas, which also not habitat areas for the skylark because of the lack of natural features (Szilassi, 2015; Szilassi et al., 2019). Fruit trees and berry plantation LULC categories were also negatively correlated with skylark abundance, because this categories have dense vegetation coverage, which are properties that do not provide a suitable habitat for the skylark (Hoffmann et al., 2018, Praus & Weidinger, 2015).
The skylark abundance significant negative relation with the Complex cultivation pattern may be due to the fact that the skylark does not prefer heterogeneous landscapes (Berg et al., 2015; Csikós
& Szilassi, 2020; Gottschalk et al., 2010; Guerrero et al., 2012; Szilassi et al., 2019). Berg et al., (2015), Gottschalk et al., (2010) and Szilassi et al., (2019) also established that there is a significant negative
relation between the abundance data of skylark and the Forests LULC category (Broad-leaved and Coniferous). The dense forests areas decrease the openness of the landscape and has a negative association with the skylark population. Many studies highlight the importance of the landscape openness for the skylark (Morelli, 2013, Pedersen &
Krøgli, 2017). The Water bodies category was also negatively correlated with skylark abundance, and it is well-known that this LULC category is not a preferred land cover type for the skylark.
In Schleswig-Holstein, the Discontinuous urban fabric LULC category was negatively correlated with skylark abundance. This land cover type is part of the artificial surfaces first level CLC class, and it is not a habitat area of the skylark because of the lack of natural features and the very fragmented landscape (Filippi-Codaccioni et al., 2008, Loretto et al., 2019). Filippi-Codaccioni et al., (2008) found a negative correlation between the proportion of urbanised area in 1 × 1 km grids and skylark abundance data. Skylark abundance was also negatively correlated with the Mixed forest LULC type, the reason is same as in case of other types of forests. The inland marshes category shows significant positive relation in Schleswig-Holstein because around the inland marshes there are lot of natural grassland area.
The proportions, number of patches and mean patch size of the land cover categories also differ, which can cause differences in the model results (Table A1). In Schleswig-Holstein there are more patches of Discontinuous urban fabric area with smaller mean patch size value and skylark do not prefer the fragmented landscapes by non-habitat areas. The same findings can be stated in the case of the forests.
4.3. European changes of Eurasian skylarks’ habitat, and its relations with the skylark population
We could compare the summarized habitat and abundance changes of skylark in country level (Fig 2). Based on the calculated changes of the habitat and non-habitat land cover categories of the
skylark, we could map the total summarized changes of skylarks’ habitat in Europe (Fig 3). Figure 3 identifies the most significant spatial changes in skylark habitat at continental scale and highlights the habitat change hotspots in Europe. These hotspots may require further research, as United Kingdom, Ireland, Germany, Denmark, Hungary, Slovakia and Spain. For example, in northern Germany (Schleswig-Holstein and Hessen) there are confirmed changes in land cover that have a negative effect on the skylark population density (Csikós & Szilassi, 2020, Lüker-Jans et al., 2017).
Heldbjerg et al., 2018 found that in Denmark, the population density of the skylark declined because of the new agri-environmental schemes (AES, 2001 - 2014) caused land cover changes (Heldbjerg et al., 2018). Daskalova et al., 2019 report the same phenomenon in Scotland, that the introduction of the new AES cause decline in farmland bird abundance trends (Daskalova et al., 2019). In Hungary, there is also a declining trend in abundance because of the reforestation of the grasslands and meadows (Szilassi, 2019).
The result of Spearman’s rho correlation test between the skylark abundance changes and the calculated habitat change between 2000 and 2018 shows significant positive statistical connections with each other (Table 3). It means that the recent habitat change of skylark shows significant statistical correlations with the population of the skylark. This result validates our results, but the
extension of the input data with other parameters (landscape indices) could be improve the model accuracy of the recent skylark abundance changes.
5. CONCLUSION
Land cover types, which have positive and negative effects on skylark abundance, have been identified in both study areas, Hungary and Schleswig-Holstein. Based on the model results, we can divide the CORINE land cover categories into two groups, habitat and non-habitat categories. The habitat categories are Non-irrigated arable land (based on other studies), Natural grassland and Pastures. The non-habitat categories are Discontinuous urban fabric, Construction sites, Green urban areas, Fruit trees and berry plantations, Complex cultivation patterns, Broad-leaved forest, Coniferous forest, Mixed forest and Water bodies.
The habitat changes in the grid cells have been calculated, for an a European-wide map with 5 × 5 km grid cells. This map represents the habitat changes in the European scale, and based on this map, can be identify the hotspots of the positive and negative habitat changes. This study establishes the importance the openness of the-landscapes for this species in Europe, suggesting that on-going land cover and habitat changes may strongly affect the spatial distribution (density) of skylark in most of the European country.
APPENDIX
Table A1 Distribution of grid cells and CLC categories in the study areas
CLC CODE
HUNGARY SCHLESWIG-HOLSTEIN
Grids1 Grids
%2
CLC
%3
Number of patches
Mean Patch Size
Grids1 Grids
%2
CLC
%3
Number of patches
Mean Patch Size
112 142 79.33 6.66 240 122 199 96.14 11.61 536 71
133 10 5.59 0.10 19 35 1 0.48 0.02 2 28
141 6 3.35 0.11 15 44 17 8.21 0.24 24 33
211 174 97.21 48.09 297 455 207 100.00 18.27 707 311
222 52 29.05 1.16 54 40 1 0.48 0.01 2 57
231 160 89.39 8.46 300 51 207 100.00 24.40 1053 104
242 113 63.13 2.55 237 52 3 1.45 0.10 5 38
311 146 81.56 11.30 301 101 179 86.47 12.40 584 67
312 27 15.08 0.50 35 32 111 53.62 4.34 224 115
313 41 22.91 0.88 62 40 95 45.89 2.82 178 41
321 56 31.28 8.33 33 160 42 20.29 1.56 38 40
411 44 24.58 0.85 40 34 13 6.28 0.46 10 36
512 50 27.93 1.08 43 67 91 43.96 3.12 125 88
1Number of grids that contain the CLC category; 2percentage of grids that contain the CLC category; 3 percentage of the CLC category.
Table A2. Names and descriptions of Corine Land Cover categories, Source: Bossard et al., 2000; Kosztra et al., 2019
Code Name Description
112 Discontinuous urban fabric
The discontinuous urban fabric class is allocated when urban structures and transport networks associated with vegetated areas and bare surfaces are present and keep significant amounts of surface in a discontinuous spatial pattern. Impermeable features such as roads, buildings, and artificially surfaced areas range from 30% to 80% land coverage.
133 Construction sites
Lands under construction development, soil or bedrock excavations and earthworks. This class is assigned to areas where the landscape is distressed by human activities, changed or modified into artificial surfaces, being in a state of anthropogenic transition.
141 Green urban areas
Areas with vegetation within or partly conquered by urban fabric. This class is assigned to urban greenery, which usually has recreational or ornamental character and is usually available to the public.
211 Non-irrigated arable land
Cultivated land units under rain-fed agricultural use for annually harvested non- permanent crops, normally under a crop rotation system, including fallow lands within such crop rotation. Parcels with sporadic sprinkler irrigation with non-permanent devices to support dominant rain-fed cultivation are included.
222 Fruit trees and berry plantations
Cultivated lands planted with fruit trees and shrubs, intended for fruit production, including nuts. The planting pattern can be by single or mixed fruit, both in association with permanently grassy surfaces.
231 Pastures
Permanent grassland characterized by agricultural use or strong human interference.
Floral composition dominated by graminaceae and affected by human activity. Typically used for grazing or mechanical harvesting of grass to meadows.
242
Complex cultivation patterns
Mosaic of small cultivated land fields with different cultivation types -annual crops, pasture and/or permanent crops-, eventually with scattered houses or gardens.
311 Broad-leaved forest
Vegetation formation formed principally of trees, including shrub and bush, where broad-leaved species predominate.
312 Coniferous forest Vegetation formation formed principally of trees, including shrub and bush understorey, where coniferous species predominate.
313 Mixed forest Vegetation formation composed principally of trees, including shrub and bush understorey, where neither broad-leaved nor coniferous species predominate.
321 Natural grassland
Grasslands under no or moderate human affect. Low-productivity grasslands. Often situated in areas of rough, uneven ground and steep slopes; frequently including rocky areas or patches of other (semi-)natural vegetation.
411 Inland marshes Low-lying land usually flooded in winter, and with ground more or less saturated by fresh water all year round.
512 Water bodies Natural or artificial water bodies with presence of standing water surface during most of the year.
Funding:
This work was supported by the NEW NATIONAL EXCELLENCE PROGRAM OF THE MINISTRY FOR INNOVATION AND TECHNOLOGY FROM THE SOURCE OF THE NATIONAL RESEARCH, DEVELOPMENT AND INNOVATION FUND [grant number UNKP-20-3-SZTE- 515]
Acknowledgments
We express our sincere thanks to Ornithologische Arbeitsgemeinschaft für Schleswig-Holstein und Hamburg and MME/BirdLife Hungary for providing the abundance data of the Eurasian skylark. We also thank the anonymous referees for their valuable recommendations and suggestions.
Conflicts of interest
The authors declare no conflict of interest.
References
Báldi, A., & Faragó, S. 2007. Long-term changes of farmland game populations in a post-socialist country (Hungary). Agriculture, Ecosystems and Environment, 118(1–4), 307–311.
https://doi.org/10.1016/j.agee.2006.05.021
Barton, K. 2015. Package MuMIn (R Package version 1.15. 1.; p. 75). R Foundation for Statistical Computing. https://cran.r- project.org/package=MuMIn
Berg, Å., Wretenberg, J., Zmihorski, M., Hiron, M., &
Pärt, T. 2015. Linking occurrence and changes in
local abundance of farmland bird species to landscape composition and land-use changes.
Agriculture, Ecosystems and Environment, 204, 1–
7. https://doi.org/10.1016/j.agee.2014.11.019 Bossard, M., Feranec, J., Otahel, J., & Steenmans, C.
2000. CORINE land cover technical guide- Addendum 2000. www.eea.eu.int
Cramp, Stanley. 1988. The Birds of the Western Palearctic (Volume 5). Oxford University Press.
Csikós, N., & Szilassi, P. 2020. Impact of Energy Landscapes on the Abundance of Eurasian Skylark (Alauda arvensis), an Example from North Germany. Sustainability, 12(2), 664.
https://doi.org/10.3390/su12020664
Csörgo, T., Karcza, Z., Halmos, G., Magyar, G., Gyurácz, J., Szép, T., Bankovics, A., Schmidt, A.,
& Schmidt, E. 2009. Hungarian Bird Migration Atlas. Kossuth Kiadó.
Daskalova, G. N., Phillimore, A. B., Bell, M., Maggs, H. E., & Perkins, A. J. 2019. Population responses of farmland bird species to agri‐environment schemes and land management options in Northeastern Scotland. Journal of Applied Ecology, 56(3), 640–650. https://doi.org/10.1111/1365- 2664.13309
EEA. 2006. The Thematic Accuracy of CLC 2000.
Assessment Using LUCAS (Land Use/cover Area Frame Statistical Survey).
http://land.copernicus.eu/user-corner/technical- library/technical_report_7_2006.pdf
EEA and ETC-TE. 2017. CLC Update CLC 2000 Project. Technical Guidelines. Final Version.
http://land.copernicus.eu/user-corner/technical- library/techrep89.pdf
European Environment Agency. 2017. Landscapes in transition — An account of 25 years of land cover change in Europe.
https://www.eea.europa.eu/publications/landscapes- in-transition
Fao. n.d. World reference base for soil resources 2014 International soil classification system for naming soils and creating legends for soil maps Update 2015 WORLD SOIL RESOURCES REPORTS.
Retrieved February 25, 2019, from http://www.fao.org
Farkas, J. Z., & Lennert, J. 2015. Modelling and predicting of the land use change in Hungary. In M.
Czirfusz, E. Hoyk, & A. Suvák (Eds.), Climate change — society — economy: Long-term processes and trends in Hungary (pp. 193–221). Publikon.
Filippi-Codaccioni, O., Devictor, V., Clobert, J., &
Julliard, R. 2008. Effects of age and intensity of urbanization on farmland bird communities.
Biological Conservation, 141(11), 2698–2707.
https://doi.org/10.1016/j.biocon.2008.08.006 Gil-Tena, A., De Cáceres, M., Ernoult, A., Butet, A.,
Brotons, L., & Burel, F. 2015. Agricultural landscape composition as a driver of farmland bird diversity in Brittany (NW France). Agriculture, Ecosystems and Environment, 205, 79–89.
https://doi.org/10.1016/j.agee.2015.03.013
Gottschalk, T. K., Dittrich, R., Diekötter, T., Sheridan, P., Wolters, V., & Ekschmitt, K. 2010. Modelling land-use sustainability using farmland birds as indicators. Ecological Indicators, 10(1), 15–23.
https://doi.org/10.1016/j.ecolind.2009.05.008 Guerrero, I., Morales, M. B., Oñate, J. J., Geiger, F.,
Berendse, F., Snoo, G. de, Eggers, S., Pärt, T., Bengtsson, J., Clement, L. W., Weisser, W. W., Olszewski, A., Ceryngier, P., Hawro, V., Liira, J., Aavik, T., Fischer, C., Flohre, A., Thies, C., &
Tscharntke, T. 2012. Response of ground-nesting farmland birds to agricultural intensification across Europe: Landscape and field level management factors. Biological Conservation, 152, 74–80.
https://doi.org/10.1016/j.biocon.2012.04.001 Heldbjerg, H., Sunde, P., & Fox, A. D. 2018.
Continuous population declines for specialist farmland birds 1987-2014 in Denmark indicates no halt in biodiversity loss in agricultural habitats.
Bird Conservation International, 28(2), 278–292.
https://doi.org/10.1017/S0959270916000654 Hoffmann, J., Wittchen, U., Berger, G., & Stachow, U.
2018. Moving window growth—A method to characterize the dynamic growth of crops in the context of bird abundance dynamics with the example of Skylark (Alauda arvensis). Ecology and Evolution, 8(17), 8880–8893.
https://doi.org/10.1002/ece3.4398
Hoffmann, J., Wittchen, U., Stachow, U., & Berger, G.
2016. Moving Window Abundance - A method to characterise the abundance dynamics of farmland birds: The example of Skylark (Alauda arvensis).
Ecological Indicators, 60, 317–328.
https://doi.org/10.1016/j.ecolind.2015.06.037 Home | EBCC - EBCC. n.d. Retrieved September 23,
2020, from https://www.ebcc.info/
Jenks, G. 1967. The Data Model Concept in Statistical Mapping. International Yearbook of Cartography.
Koleček, J., Reif, J., & Weidinger, K. 2015. The abundance of a farmland specialist bird, the skylark, in three European regions with contrasting agricultural management. Agriculture, Ecosystems and Environment, 212, 30–37.
https://doi.org/10.1016/j.agee.2015.06.018
Kosztra, B., Büttner, G., Hazeu, G., & Arnorld, S.
2019. Updated CLC illustrated nomenclature guidelines.
Kuznetsova, A., Brockhoff, P. B., & Christensen, R. H.
B. 2020. Package ‘lmerTest.’ R Foundation for Statistical Computing, 3.1.
Loretto, M. C., Schöll, E. M., & Hille, S. 2019.
Occurrence of Eurasian Skylark Alauda arvensis territories in relation to urban area and heterogeneous farmland. Bird Study, 66(2), 273–
278. https://doi.org/10.1080/00063657.2019.1637816 Lüker-Jans, N., Simmering, D., & Otte, A. 2017. The impact of biogas plants on regional dynamics of permanent grassland and maize area—The example of Hesse, Germany (2005–2010). Agriculture,
Ecosystems & Environment, 241, 24–38.
https://doi.org/10.1016/J.AGEE.2017.02.023
Moreira, F., Beja, P., Morgado, R., Reino, L., Gordinho, L., Delgado, A., & Borralho, R. 2005.
Effects of field management and landscape context on grassland wintering birds in Southern Portugal.
Agriculture, Ecosystems and Environment, 109(1–2), 59–74. https://doi.org/10.1016/j.agee.2005.02.011 Morelli, F. 2013. Relative importance of marginal
vegetation (shrubs, hedgerows, isolated trees) surrogate of HNV farmland for bird species distribution in Central Italy. Ecological Engineering.
https://doi.org/10.1016/j.ecoleng.2013.04.043 Morelli, F., Benedetti, Y., & Callaghan, C. T. 2020.
Ecological specialization and population trends in European breeding birds. Global Ecology and
Conservation, 22, e00996.
https://doi.org/10.1016/j.gecco.2020.e00996 Nagy, S., Nagy, K., & Szép, T. 2009. Potential Impact of
EU Accession on Common Farmland Bird Populations in Hungary. Acta Ornithologica, 44(1), 37–44. https://doi.org/10.3161/000164509X464867 Orłowski, G., & Ławniczak, D. 2009. Changes in
breeding bird populations in farmland of south- western Poland between 1977-1979 and 2001. Folia Zoologica -Praha, 58(2), 228–239.
Pedersen, C., & Krøgli, S. O. 2017. The effect of land type diversity and spatial heterogeneity on farmland birds in Norway. Ecological Indicators, 75, 155–
163. https://doi.org/10.1016/j.ecolind.2016.12.030 Piha, M., Pakkala, T., & Tiainen, J. 2003. Habitat
preferences of the Skylark Alauda arvensis in southern Finland. In Ornis Fennica (Vol. 80).
https://www.researchgate.net/publication/23227154 5
Praus, L., & Weidinger, K. 2015. Breeding Biology of Skylarks Alauda arvensis in Maize and Other Crop Fields . Acta Ornithologica, 50(1), 59–68.
https://doi.org/10.3161/00016454ao2015.50.1.007 Redlich, S., Martin, E. A., Wende, B., & Steffan-
Dewenter, I. 2018. Landscape heterogeneity rather than crop diversity mediates bird diversity in agricultural landscapes. PLOS ONE, 13(8), e0200438.
https://doi.org/10.1371/journal.pone.0200438 Suárez, F., Garza, V., & Morales, M. B. 2003. The role
of extensive cereal crops, dry pasture and shrub- steppe in determining skylark Alauda arvensis densities in the Iberian Peninsula. Agriculture,
Ecosystems and Environment, 95(2–3), 551–557.
https://doi.org/10.1016/S0167-8809(02)00175-5 Südbeck, P., Andretzke, H., Fischer, S., Gedeon, K.,
Schikore, T., Schröder, K., & Sudfeldt, C. 2005.
Methodenstandards zur erfassung der Brutvögel Deutschlands.
Szép, T., & Gibbson, D. 2000. Monitoring of common breeding birds in Hungary using a randomised sampling design. RING, 45–55.
Szép, T., & Nagy, K. 2001. The GIS UTM Quadrants based Hungarian Bird Monitoring database of the BirdLife Hungary. Természetvédelmi Közlemények, 9, 31–37.
Szép, Tibor, Nagy, K., Nagy, Z., & Halmos, G. 2012.
Population trends of common breeding and wintering birds in hungary, decline of long-distance migrant and farmland birds during 1999–2012.
Ornis Hungarica, 20(2), 13–63.
https://doi.org/10.2478/orhu-2013-0007
Szilassi, Péter. 2015. The land cover pattern and land cover area change as the indicator of anthropogenic environmental changes. In J.
Rakonczai, V. Blanka, & Z. Ladányi (Eds.), Forward in a greener way: Activities of the University of Szeged, Geography and Geology Departments in the ZENFE programme (pp. 154–
163). SZTE TTIK Geography and Geology Departments, Szeged.
Szilassi, Peter, Csikos, N., Galle, R., & Szep, T. 2019.
Recent and Predicted Changes in Habitat of the Eurasian Skylark Alauda arvensis Based on the Link between the Land Cover and the Field Survey Based Abundance Data. Acta Ornithologica, 54(1), 59.
https://doi.org/10.3161/00016454ao2019.54.1.006 Tryjanowski, P., Hartel, T., Bldi, A., Szymański, P.,
Tobolka, M., Herzon, I., Goławski, A., Konvička, M., Hromada, M., Jerzak, L., Kujawa, K., Lenda, M., Orłowski, G., Panek, M., Skórka, P., Sparks, T. H., Tworek, S., Wuczyński, A., &
Ámihorski, M. 2011. Conservation of farmland birds faces different challenges in Western and Central-Eastern Europe. Acta Ornithologica, 46(1), 1–12. https://doi.org/10.3161/000164511X589857 Wretenberg, J., Lindström, Å., Svensson, S., & Pärt,
T. 2007. Linking agricultural policies to population trends of Swedish farmland birds in different agricultural regions. Journal of Applied Ecology, 44(5), 933–941. https://doi.org/10.1111/j.1365- 2664.2007.01349.x
Received at: 04. 03. 2021 Revised at: 23. 05. 2021
Accepted for publication at: 07. 06. 2021 Published online at: 14. 06. 2021


![adistincttypeofenergyproductionsystem,nowadaysmainlyrenewableenergy.Similartoother energysourcescanbefoundinmanycountries,fromtheUSAtoChinaandacrossEurope[ – ]. energylandscape;Eurasianskylark;landcover;landuse;land-coverheterogeneity; withtheareaoftheinl](data:image/gif;base64,R0lGODlhAQABAIAAAP///wAAACH5BAEAAAAALAAAAAABAAEAAAICRAEAOw==)