In: Journal of Neuroscience Methods, 316: 58-70 (2019) 10.1016/j.jneumeth.2018.08.020 Manuscript as accepted.
This work is licensed under the Creative Commons Attribution-NonCommercial- NoDerivatives 4.0 International License (CC BY-NC-ND 4.0).
SI: Methods in Sleep Research
Fine-scale mapping of cortical laminar activity during sleep slow oscillations using high- density linear silicon probes
Richárd Fiátha,b,*, Bogdan Cristian Raducanuc,d, Silke Musac, Alexandru Andreic, Carolina Mora Lopezc, Marleen Welkenhuysenc, Patrick Ruthere,f, Arno Aartsg, István Ulberta,b
a Institute of Cognitive Neuroscience and Psychology, Research Centre for Natural Sciences, Hungarian Academy of Sciences, Budapest, Hungary
b Faculty of Information Technology and Bionics, Pázmány Péter Catholic University, Budapest, Hungary
c Interuniversity Microelectronics Center (IMEC), Heverlee, Belgium
d Electrical Engineering Department (ESAT), KU Leuven, Leuven, Belgium
e Microsystem Materials Laboratory, Department of Microsystems Engineering (IMTEK), University of Freiburg, Freiburg, Germany
f BrainLinks-BrainTools Cluster of Excellence at the University of Freiburg, Freiburg, Germany
g ATLAS Neuroengineering, Leuven, Belgium
*Correspondence:
Richárd Fiáth
email: fiath.richard@ttk.mta.hu
Institute of Cognitive Neuroscience and Psychology, Research Centre for Natural Sciences, Hungarian Academy of Sciences, Magyar tudósok körútja 2, H-1117 Budapest, Hungary
2 Abstract
Background: The cortical slow (~1 Hz) oscillation (SO), which is thought to play an active role in the consolidation of memories, is a brain rhythm characteristic of slow-wave sleep, with alternating periods of neuronal activity and silence. Although the laminar distribution of cortical activity during SO is well-studied by using linear neural probes, traditional devices have a relatively low (20-100 µm) spatial resolution along cortical layers.
New method: In this work, we demonstrate a high-density linear silicon probe fabricated to record the SO with very high spatial resolution (~6 µm), simultaneously from multiple cortical layers. Ketamine/xylazine-induced SO was acquired acutely from the neocortex of rats, followed by the examination of the high-resolution laminar structure of cortical activity.
Results: The probe provided high-quality extracellular recordings, and the obtained cortical laminar profiles of the SO were in good agreement with the literature data. Furthermore, we could record the simultaneous activity of 30-50 cortical single units. Spiking activity of these neurons showed layer-specific differences.
Comparison with existing methods: The developed silicon probe measures neuronal activity with at least a three-fold higher spatial resolution compared with traditional linear probes. By exploiting this feature, we could determine the site of up-state initiation with a higher precision than before. Additionally, increased spatial resolution may provide more reliable spike sorting results, as well as a higher single unit yield.
Conclusions: The high spatial resolution provided by the electrodes allows to examine the fine structure of local population activity during sleep SO in greater detail.
3 Keywords
high-density silicon probe; laminar recording; neocortex; single-unit activity; slow oscillation;
slow-wave activity
Highlights
• A high-density, linear silicon-based probe was developed for in vivo laminar recordings.
• The array of 256 closely-packed titanium nitride microelectrodes provides a high (~6 µm) spatial resolution.
• The high spatial sampling was beneficial to obtain a high single unit yield and well- separated unit clusters.
• The laminar structure of neuronal activity during the cortical sleep slow oscillation could be investigated with great detail.
4 1. INTRODUCTION
The low-frequency (~ 1 Hz) slow oscillation (SO) is a brain rhythm characteristic of slow-wave sleep, the deepest stage of natural non-rapid eye movement (NREM) sleep (Neske, 2015;
Steriade et al., 1993a). Since its discovery about a quarter century ago, the SO was detected in the brain of various animal species, both during natural sleep and anesthesia (Chauvette et al., 2011; Crunelli et al., 2012; Fiath et al., 2016; Neske, 2015; Steriade et al., 1993b), as well as in brain slices (Favero and Castro-Alamancos, 2013; Rigas and Castro-Alamancos, 2009;
Sanchez-Vives and McCormick, 2000; Wester and Contreras, 2012, 2013) and in cortical slabs (Timofeev et al., 2000). SO was also found during natural sleep of humans (Achermann and Borbely, 1997), and is subject to extensive research since it was discovered (Csercsa et al., 2010; Dang-Vu, 2012; Dang-Vu et al., 2008; Massimini et al., 2004; Nir et al., 2011). One of the striking features of slow waves is the rhythmic fluctuation of two fundamentally different phases: active (“up”) states with massive persistent network activity and inactive (“down”) states with almost complete neuronal silence (Wilson and Kawaguchi, 1996). Possible functions of this brain rhythm include the consolidation of memory traces acquired during waking, as well as cellular restoration (Neske, 2015; Rasch and Born, 2013). As slow oscillations induced by various anesthetic agents (e.g. urethane, isoflurane or ketamine/xylazine) have similar properties than natural slow waves, anesthesia-induced slow waves obtained in acute experiments are widely used as an experimental model of slow waves emerging during natural deep sleep (Chauvette et al., 2011; Crunelli and Hughes, 2010).
Since the neocortex is one of the principal brain structures which generates the SO, slow waves were extensively studied in this part of the brain (Crunelli et al., 2015; Crunelli and Hughes, 2010; Neske, 2015). The neocortex is composed of a complex and strongly interconnected network of neurons, and can be subdivided into six, anatomically separable layers, each having different input and output characteristics, cell types and distribution of neurons. Both in humans
5
and in animal models, fundamental neuronal mechanisms underlying the generation of cortical SO were investigated principally either by recording the activity of all cortical layers simultaneously using linear neural probes (e.g. Cash et al., 2009; Chauvette et al., 2010; Csercsa et al., 2010; Fiath et al., 2016; Sakata and Harris, 2009) or by measuring extracellular signals from a single layer (most frequently from layer (L) 5) with tetrodes or high-density silicon probes (e.g. Luczak and Bartho, 2012; Luczak et al., 2007). Studies using these types of probes led to interesting new findings related to the laminar distribution of neural generators of slow waves. For instance, analysis of cortical laminar recordings obtained in rats and cats showed the instrumental role of cortical L5 in the initiation, as well as for the propagation of up-states (Beltramo et al., 2013; Chauvette et al., 2010; Fiath et al., 2016; Sakata and Harris, 2009; Stroh et al., 2013; Wester and Contreras, 2012).
Although laminar neural probes are highly useful experimental tools and may provide data simultaneously from all cortical layers, most of these devices have a low vertical sampling coverage. That is, with the common inter-electrode spacing (20-100 µm) between recording sites, important information corresponding to neuronal activity located between electrodes might be lost (e.g. spikes of neurons having a small size). Furthermore, some of the cortical layers (e.g. L2 or L4) are thinner than the spatial resolution of these probes, therefore only a few or no electrodes will record the activity of these layers. Thus, traditional linear probes lack an adequate spatial resolution to examine the fine-scale laminar structure of neuronal activity during sleep slow oscillations.
To increase the spatial resolution of neocortical SO recordings along cortical layers, we developed a high-density linear silicon-based probe with 256 close-packed titanium-nitride recordings sites. To validate the functionality and the performance of the probe, it was implanted in acute experiments into the neocortex of rats anesthetized with ketamine/xylazine.
Spontaneous wideband electrical activity was recorded from multiple layers of somatosensory
6
and association cortices. Then, high-resolution up-state onset-locked depth profiles of local field potentials and multi-unit activity were calculated and examined. In addition, after determining the position of electrodes in the brain tissue, we investigated the distribution of up- state onsets across cortical layers. Besides a high spatial resolution, the probe also has adequate single unit recording capabilities; up to 50 simultaneously recorded neurons could be separated from cortical recordings acquired at a single implantation site. After spike sorting, basic analysis of the activity of these single units was performed to examine layer-specific spiking activity during up-states. Our results suggest that the developed high-density laminar probe might be a useful tool to investigate the fine-scale laminar dynamics of neuronal activity during cortical slow oscillations.
7 2. MATERIALS AND METHODS
2.1 Probe fabrication and packaging
The linear silicon probe (Figs. 1 and 2) developed in this study was fabricated using a commercial 0.13-µm complementary metal-oxide-semiconductor (CMOS) process, with a three-metal-layer (AlCu) back-end-of-line (BEOL) on 200-mm-diameter silicon wafers. The fabrication process allows to realize feature sizes in the metal layers down to 0.13 µm, which is beneficial for creating high-density neural probes with densely-packed recording sites and interconnecting lines. The steps of the fabrication process are described in detail in Fiath et al.
(2018). In short, the CMOS process allowed the fabrication of three metal layers: the top metal layer was used to define bonding pads and pads corresponding to titanium nitride (TiN) electrodes, while the other two metal layers were used for signal routing. The latter provided electrical connections between the electrodes and the contact pads on the base of the probe.
After CMOS fabrication, the silicon wafers have been post-processed to define the TiN electrodes and to release the final devices.
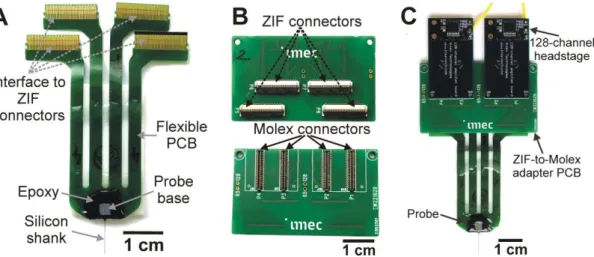
The neural probe consists of an 8-mm-long, 100-µm-wide, 50-µm-thick implantable shank, and a base (4.3 × 5.3 mm2) containing contact pads to interface the probe with the electrophysiological recording system (Fig. 1A). The tapered neck of the silicon shank is 975 µm long and 1630 µm wide at the probe base. At the bottom of the shank, the probe has a chisel- shaped tip with a 300-µm-long tapered section. The 256 TiN microelectrodes located above this tapered section form a two-dimensional high-aspect-ratio array covering a total area of 11
× 1536 µm2. The electrode array comprises two columns with each column containing 128 electrodes and with the first electrode placed 300 microns from the probe tip (Fig. 1A, B). The square-shaped recording sites have a side length of 5 µm and are placed with a vertical inter- electrode pitch of 12 µm and a distance of 1 µm between the columns, resulting in an overall
~6 µm spatial sampling grid (Fig. 1B). To reduce the electrical impedance of electrodes by
8
increasing their effective recording surface, each recording site contains two rectangular vias interfacing the TiN metallization with the top-most CMOS metal layer (Fig. 1B).
After release from the silicon wafer, each probe was wire-bonded onto a four-wing flexible printed circuit board (PCB) which comprises four interface sections for zero insertion force (ZIF) connectors, each with 70 metal contacts (Fig. 2A). The area around the probe base and the bond wires was coated with epoxy resin to protect the interconnections from contact with fluids. The flexible PCB is about 59 mm long and 19.2 mm wide at the probe base. The assembled probe weighs 0.33 grams and can be connected to two 128-channel amplifiers of the electrophysiological recording system using a ZIF-to-Molex adapter PCB (4.2 g; 1 mm thick;
31 x 52 mm2; Fig. 2B, C).
The magnitude of the electrical impedance of TiN electrodes was measured using the built-in impedance measurement function of the Intan RHD-2000 electrophysiological recording system (Intan Technologies LLC., Los Angeles, CA, USA). Prior to their in vivo use, we determined the impedance magnitude of the electrodes of two probes (n = 512 electrodes) at 1 kHz, in physiological saline solution against an Ag/AgCl electrode. The impedance magnitude of the TiN electrodes was 672.58 ± 52.24 kΩ (average ± standard deviation). Recording sites showing high impedance values (> 5 MΩ; n = 24) were considered as non-functional and excluded from the calculation.
2.2 Animal surgery and electrophysiological recordings
The fabricated silicon probes (n = 2) were implanted acutely into the neocortex of Wistar rats (n = 6; 5 females and 1 male; 270 – 650 g). All experiments were performed according to the EC Council Directive of September 22, 2010 (2010/63/EU), and all procedures were reviewed and approved by the local ethical committee and the National Food Chain Safety Office of Hungary (license number: PEI/001/2290-11/2015).
9
The surgical and recording procedures were performed as previously described (Fiath et al., 2016; Fiath et al., 2018). Briefly, the animals were anesthetized with a mixture of ketamine (37.5 mg/ml) and xylazine (5 mg/ml) injected intramuscularly at 2 ml/kg body weight injection volume. If necessary, supplementary doses of ketamine/xylazine (~0.3 ml/h) were given to maintain the depth of anesthesia during surgery and recordings. After the animals reached the level of surgical anesthesia, they were placed in a commercially available stereotaxic frame (David Kopf Instruments, Tujunga, CA, USA). Body temperature of the animals was maintained with a homeothermic heating pad connected to a temperature controller (Supertech, Pécs, Hungary).
A small craniotomy (3 × 3 mm2) was drilled either over the trunk or the hindlimb region of the somatosensory cortex (S1Tr/S1HL; n = 4 rats; anterioposterior (AP): -1.6 mm to -2.9 mm;
mediolateral (ML): 2 mm to 3 mm; with respect to the bregma according to the rat brain atlas;
Paxinos and Watson, 2007), or over the parietal association cortex (PtA; n = 2 rats; AP: -3.3 mm to 3.6 mm; ML: 2 mm to 3mm; with respect to the bregma). Then, using a 30-gauge needle, a small slit was made in the dura mater above the targeted cortical area to avoid excessive brain dimpling during probe insertion. For post-mortem histological verification of the recording location (DiCarlo et al., 1996), the backside of the silicon shank was painted with red- fluorescent dye (DiI, D-282, ~10% in ethanol, Thermo Fischer Scientific, Waltham, MA, USA) before penetration. Then, the neural probe was mounted on a motorized stereotaxic micromanipulator (Robot Stereotaxic, Neurostar GmbH, Tübingen, Germany) and driven into the brain tissue at a slow insertion speed (~2 μm/sec), perpendicularly to cortical layers. In total, nine penetrations were made in the cortex of the six animals (S1Tr, n = 4; S1HL, n = 2; PtA, n
= 3). During the piercing of the dura, as well as during probe insertion, care was taken to avoid damaging large blood vessels located on the brain surface. Room temperature physiological saline solution was dripped into the cavity of the craniotomy to prevent dehydration of the
10
cortex. A stainless steel needle inserted in the nuchal muscle of the animals served as the external reference electrode during recordings.
The somatosensory cortex is usually thicker (~1700 – 2000 µm; Fiath et al., 2016) than the vertical area covered by the linear electrode array (1536 µm) which prevents the simultaneous recording from all cortical layers. Therefore, neuronal activity in the somatosensory cortex was recorded at multiple cortical depths. In case of the parietal association cortex (~1400 – 1500 µm thickness), simultaneous recording of the activity of all cortical layers was possible.
Spontaneously occurring cortical activity (Fig. 3) was recorded on 256 channels using an Intan RHD-2000 electrophysiological recording system comprising two 128-channel amplifiers.
Wideband signals (0.1 – 7500 Hz) were recorded with a sampling frequency of 20 kHz/channel at a resolution of 16 bit. Data files containing continuous recordings were saved to hard drives for offline data analysis. Usually, 2-3 hours of cortical data were collected from a single animal.
In case of two experiments, somatosensory stimulation was applied, as described previously (Fiath et al., 2016). In short, a thin stick applied to a custom-made mechanical stimulator rhythmically (~1 Hz) touched the skin of the animal where the most intense response to stimulation was found. This spot was identified by listening to the recorded signal in the 500–
5000 Hz band through a loudspeaker. The device used for stimulation is based on a stepper motor with one end of a thin, ~10-cm-long wooden stick glued to the motor. The other end of the stick was placed about 5 mm from the skin of the rat for tapping stimulation. The parameters of the stimulator were controlled externally through a custom-made LABVIEW software. The duration of the pulses was 50 ms, which represents the period of time during which the stick reaches the skin of the animal, touches it, then returns to its starting position. The angular velocity corresponding to the stimulus duration was 400 °/s. Stimulus delivery times were recorded parallel with the neuronal activity, on a separate analog channel.
11
After the recording session, the probe was withdrawn and cleaned by immersing it into 1%
Tergazyme solution (Sigma-Aldrich, St. Louis, MO, USA) for at least 30 minutes followed by rinsing with distilled water for 2 minutes.
2.3 Histology
To detect the tracks of the silicon probe in the brain tissue, we used a histological procedure described in Fiath et al. (2018). Briefly, the animals (n = 4) were transcardially perfused after the experiment with physiological saline solution followed by a fixative containing 4%
paraformaldehyde in 0.1 M phosphate buffer (PB). From the fixed brain, 60-µm-thick coronal sections were cut with a vibratome (Leica VT1200, Leica Microsystems, GmbH, Wetzlar, Germany), mounted from gelatin to microscope slides and air dried. To identify sections containing fluorescent marks of DiI corresponding to the probe track, the dried brain sections were examined under a light microscope (Leica DM2500, Leica Microsystems GmbH) equipped with a fluorescence LED illumination source (SFL4000, Leica) and with a digital camera (DP73, Olympus, Tokyo, Japan). After that, the brain sections were processed for cresyl violet (Nissl) staining and sections containing the track of the silicon probe were photographed under the microscope to verify the recording location based on the rat brain atlas (Paxinos and Watson, 2007) and to determine the borders of cortical layers in a similar way as described in Fiath et al. (2016).
2.4 Data analysis
2.4.1 State detection in the neocortex
In recent years, multiple methods were developed to detect the two phases of the slow oscillation in extracellular recordings (Csercsa et al., 2010; Fiath et al., 2016; Mukovski et al., 2007; Sakata and Harris, 2009; Saleem et al., 2010; Tsakanikas et al., 2017). We used a multi- unit activity(MUA)-based method to identify the onset of up- and down-states (Fig. 4A), a
12
modified version of the procedure described in our previous study (Fiath et al., 2016). In short, first, we removed low frequency components corresponding to local field potentials from the wideband recordings with a bandpass filter (third-order Butterworth bandpass filter, 500 – 5000 Hz, zero-phase shift) and rectified the filtered signal (Fig. 4A; MUA). Then, the MUA was downsampled from 20 kHz to 2 kHz for faster processing. After that, the samples of the downsampled MUA were summed up across the 256 channels resulting in a single time series representing the instantaneous intensity of population activity in the examined cortical area.
Next, this signal was smoothed with an additional lowpass filter (third-order Butterworth filter, zero-phase shift, 30 Hz) to obtain the smoothed population activity (SPA; Fig. 4A). In most of the cases, the amplitude histogram of the SPA showed a clear bimodal distribution (Fig. 4B).
Finally, a threshold level was calculated to determine the onset of up- and down-states. First, the average (AVG) and standard deviation (SD) of activity measured during down-states (lack of action potential firing) was estimated on the SPA signal. Based on empirical observations, a threshold level of AVG + (2 * SD) was usually sufficient to precisely determine the start of up- and down-states. Furthermore, the minimum duration of up-states was set to 50 ms in the state detection algorithm (30 ms in case when short, but clearly distinguishable up-states were present in the recordings), while the duration of down-states was chosen to be minimum 100 ms. The onset of an up (down)-state was defined as the time point at which the value of the SPA signal exceeded (fell below) the calculated threshold level. This time point had to be preceded by an opposite state with a length equal to or longer than the defined minimal state duration. The extracted up- and down-state onset times were saved to files. In addition, up- states with a duration between 200 and 400 ms, which are the most typical active state durations during ketamine/xylazine anesthesia (Fiath et al., 2016), were extracted separately to create the up-state onset-locked cortical depth profiles (Fig. 5).
2.4.2 Detection of up-state onsets at individual recording channels
13
For each detected up-state, we estimated on which channel the spiking activity started (Fig. 6).
To achieve that, we calculated the average (AVG) and standard deviation (SD) of the rectified MUA activity in a 50-ms-long window located before the previously determined up-state onset, that is, at the end of the down-state preceding the particular up-state. Data of all channels were used in the computation. Finally, we calculated at which sample point (starting from 50 ms before the up-state onset) the MUA exceeded the predefined threshold level (usually set to AVG + (8 * SD) here) at least on two channels simultaneously and also on at least three channels during the next sample point. This particular sample point was considered as the refined up- state onset time and the channel with the highest value out of the two channels exceeding the threshold level was regarded as the channel where the up-state started.
2.4.3 Spike sorting
Single units were isolated using automatic spike sorting performed with a software developed in MATLAB (Kilosort; Pachitariu et al., 2016). This step was followed by manual revision of the neuron clusters in Phy, an open source neurophysiological data analysis package written in Python (https://github.com/kwikteam/phy). Quality of neuron clusters was evaluated using the isolation distance (Schmitzer-Torbert et al., 2005). Only single unit clusters with an isolation distance value greater than 20 (Luczak and Bartho, 2012; Luczak et al., 2007; Sakata and Harris, 2009), and with an autocorrelogram showing a clear refractory period (percentage of spikes in the 0-2 ms interval was lower than 1% of the total number of spikes in the cluster) were used in the single unit analysis (Figs. 7, 8).
2.4.4 Analysis of single-unit activity
After the revision of spike sorting results, wideband spike waveforms of each unit cluster were averaged together to obtain the average spike waveform for each neuron (Fig. 7A). Then, custom-written MATLAB (MathWorks, Natick, MA, USA) scripts were used to calculate the peak-to-peak amplitude, the half-amplitude duration and the trough-to-peak duration of average
14
spike waveforms. Since the action potentials of a neuron were usually recorded by multiple, adjacent recording sites, the attributes listed above were obtained from the recording channel on which the average spike waveform of the particular single unit was detected with the largest peak-to-peak amplitude. Single units having an average spike waveform with a peak-to-peak amplitude below 50 µV were excluded from further analysis. Neurons with a spike waveform having a trough-to-peak time below 0.6 ms were classified as putative interneurons (narrow spiking units), while remaining neuron clusters were considered as putative principal cells (wide spiking units; Fig. 7C; Bartho et al., 2004; Luczak et al., 2007). To analyze the firing patterns of single units during up-states, the perievent time histogram (PETH) was calculated for each neuron in a 1600-ms-long window, with a bin size of 5 ms, followed by smoothing by a ten-point moving average (Fig. 8B-D).
15 3. RESULTS
3.1 High-density laminar recording of the cortical slow oscillation
To investigate the cortical laminar activity during slow oscillation (SO) with high spatial resolution, we developed a silicon-based neural probe comprising a high-density linear array of microelectrodes. With this device, local field potentials (LFPs) and spiking activity of neurons were recorded acutely either from the primary somatosensory (S1Tr or S1HL) or from the parietal association (PtA) cortex of rats anesthetized with ketamine/xylazine. The fabricated Michigan-style probe has a slender probe shaft (50 × 100 µm2) carrying 256 close-packed quadratic electrodes (Fig. 1A, B). The electrodes made of titanium nitride have a side length of 5 µm and provide a total vertical coverage of 1536 µm for neural recordings. In rats, this means that the linear arrangement of recordings sites allows recording the activity of multiple (4-6) cortical layers at the same time. The potential number of simultaneously measured layers will mainly depend on the thickness of the investigated cortical area. The electrodes are interfaced via thin metal lines to a respective number of contact pads integrated on the probe base (Fig.
1A, B; Fiath et al., 2018). Through these contact pads, the silicon probe is wire bonded to a flexible and light-weight PCB (Fig. 2A) which can be connected to the external recording instrumentation via a rigid adapter PCB (Fig. 2B, C).
16
Figure 1. – High-density 256-site linear silicon probe. (A) Schematic illustration of the shank and base of the silicon probe. (B) Scanning electron microscope images of the square-shaped TiN electrodes (side length 5 µm) and via grids.
Figure 2. – The silicon probe after packaging. (A) Photograph of the fabricated silicon probe with flexible printed circuit board (PCB) after wire-bonding and packaging. (B) Backside (top) and frontside (bottom) of the ZIF(zero insertion force)-to-Molex adapter board developed to connect the probe with the electrophysiological recording system. (C) The adapter PCB attached to the probe and to two 128-channel amplifiers.
The slow oscillation emerging during ketamine/xylazine anesthesia is commonly used as a model for slow waves appearing during natural slow-wave sleep (Chauvette et al., 2011;
Crunelli and Hughes, 2010; Fiath et al., 2016; Luczak and Bartho, 2012). In rats, this particular brain rhythm has a peak frequency of ~1.5 Hz and is usually more regular and rhythmic than slow waves observed during natural sleep (David et al., 2013; Fiath et al., 2016; Sharma et al., 2010). After implanting the developed silicon probe into brain tissue, high-quality wideband cortical recordings were acquired demonstrating the rhythmic alternation of up- and down- states during SO (Fig. 3A, B). Each of the two probes tested had only a few (< 10) non- functional recording sites. In case all recordings sites were located in the cortex, local field potentials (0.1 – 500 Hz frequency band) during up-states appeared usually with negative amplitude on most channels, while the polarity of LFP during down-states was positive (Fig.
3A, B). Furthermore, neuronal spiking activity (multi-unit activity, MUA; 500 – 5000 Hz
17
frequency band) was present on most of the recording channels, with high-amplitude (> 100 µV) action potentials recorded on dozens of channels (Fig. 3A, B). The depth profile of spiking activity during individual up-states recorded at a single cortical location varied only slightly between consecutive up-states but was noticeably different between recordings obtained from the somatosensory and the association cortex, presumably due to the anatomical differences between the two cortical areas (Fig. 3B). Tens of minutes of stable continuous recordings were obtained from a certain cortical depth without noticeable electrode drift or deterioration of cortical signals. Thus, based on the observed physiological properties of the recorded neuronal activity and the quality of the acquired data, the developed silicon probe is capable to reliably record the slow oscillation simultaneously in multiple cortical layers with high spatial resolution.
Figure 3. – Ketamine/xylazine-induced slow oscillation recorded with the laminar probe in the rat neocortex. (A) Representative 3-sec-long wideband (0.1 – 7500 Hz; black) and multi- unit activity (MUA; 500 – 5000 Hz; green) traces showing the cortical activity during multiple consecutive up- and down-states. A sample up- and down-state is highlighted with a blue and a red rectangle, respectively. Recordings obtained on every 25th channel are shown. Recording sites corresponding to these channels are indicated by small red squares on the probe schematic shown on the left. (B) Color maps constructed from 3-sec-long wideband (left) and MUA (right)
18
recordings obtained on all probe channels in the parietal association cortex (top) and the somatosensory cortex (bottom) of two different rats. Before plotting, the MUA was rectified, then smoothed with a 50 Hz lowpass filter (third-order Butterworth). Data of non-functional channels were excluded (nine and seven channels, respectively). Lower channel numbers correspond to the top part of the cortex while channels with higher numbers contain the activity of deeper cortical layers. Blue and red horizontal bars located above the color maps indicate up- and down-states, respectively.
3.2 High-resolution laminar profile of the slow oscillation in the rat neocortex
To examine the cortical depth profile of the slow oscillation, using a MUA-based state detection algorithm, we extracted the time points corresponding to the onset of recorded up- and down- states, that is, we tried to precisely determine when a certain state started (Fig. 4A, see Materials and Methods for details). To achieve that, first we computed the smoothed population activity (SPA) from filtered neocortical recordings (Fig. 4A). The amplitude distribution of the SPA samples was in most cases bimodal with the two modes corresponding to the two states of slow oscillation (Fig. 4B). Then, by calculating a threshold level for the SPA signal, we determined the state onset times. In general, cortical up- and down-states recorded in ketamine/xylazine anesthesia had a duration between 50 and 500 ms, with an average duration of ~300 ms (Fiath et al., 2016); however, up-states longer than one second could be recorded as well (Fig. 4C-E).
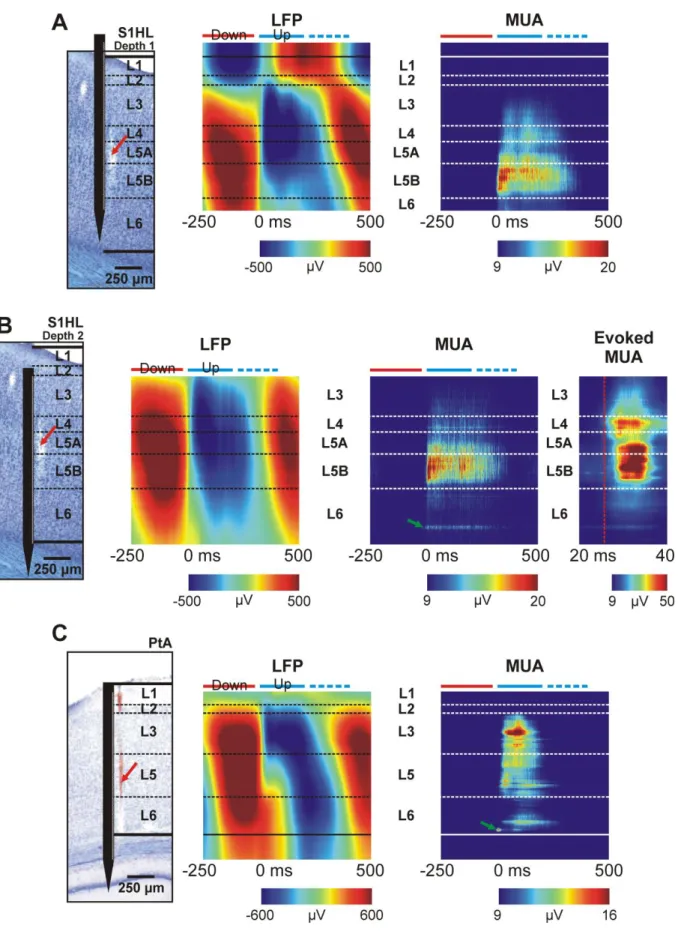
Borders of cortical layers, as well as the position of the silicon probe in the brain tissue were determined by post-mortem histological examinations (Fig. 5). Furthermore, to complement the anatomical results, somatosensory stimulation was applied in case of experiments conducted in the somatosensory cortex to determine the location of L4 (Fig. 5B; “Evoked MUA”). Then, based on the histological assessment, recording sites were assigned to cortical layers. Finally, we computed the up-state onset-locked cortical LFP and MUA depth profiles, that is, short (~2 s) epochs of LFP or MUA data containing up-states with preselected durations were aligned to the detected state onsets, then averaged across epochs (Fig. 5).
19
Figure 4. – Detecting the onset of up- and down-states. (A) The method used to detect state onset times. From top to bottom: the wideband signal was filtered and rectified to obtain the multi-unit activity (MUA). After that, the MUA has been summed up across channels. Then, the summed MUA was smoothed with a 30 Hz lowpass filter to acquire the smoothed population activity (SPA). Finally, a threshold level was calculated from the SPA signal to determine the onset of up- and down-states (au; arbitrary unit). (B) The amplitudes of samples of the SPA demonstrated on panel A show a bimodal distribution. Lower values correspond to down-states, while amplitudes are higher during up-states. The threshold level calculated for this particular example is indicated with a green dashed line. Distribution of the duration of cortical up- (C) and down-states (D) detected in a 20-min-long recording (n = 2047 of each state). (E) Color map constructed from the SPA signal showing the detected up-states (yellow-red color) which are ordered by their duration and aligned to the up-state onset (time point zero).
Depth profiles of spontaneous, 200-400-ms-long up-states recorded in the somatosensory cortex were similar to those reported in previous studies examining the laminar structure of up- states in rat sensory cortices (Fig. 5A and B; Fiath et al., 2016; Sakata and Harris, 2009). For example, in up-states, the polarity of the LFP changed from positive to negative roughly in L2 (Fig. 5A). Furthermore, spiking activity during up-states was the most robust in L5 (more precisely in L5B), while unit activity was sparse in L3 and L6 (Fig. 5B), and basically no activity was visible in L1 and L2 (Fig. 5A). In contrast, in the MUA recorded from the parietal association cortex, neuronal firing during up-states was found the strongest in L3 (Fig. 5C).
However, it should be noted that the activity of certain neurons (i.e. high-amplitude fast-firing neurons or neurons with their activity locked to a particular phase of up-states) might significantly affect the MUA depth profile averages, that is, their activity might also be
20
discerned in the laminar profiles by visual inspection (Fig. 5). Thus, the differences observed between the two cortical areas might be slightly biased by some of these neurons and also by other factors. Further experiments in the future might provide more detailed results on cortical area-specific differences in the fine-scale laminar structure of activity during the slow oscillation. In this study, our main objective was only to demonstrate the applicability of the developed high-density probe in the investigation of slow waves.
21
Figure 5. – Up-state onset-locked local field potential (LFP) and multi-unit activity (MUA) depth profiles from different cortical regions. (A) Up-states were recorded in the hindlimb region of the somatosensory cortex (S1HL). The Nissl-stained coronal brain section on the left shows the estimated depth position of the silicon probe and the border of cortical layers (dashed black lines). The dimensions of the probe schematic are to scale. The track of the probe is indicated with a red arrow. Only up-states with a duration between 200 and 400 ms (n = 173)
22
were averaged to obtain the laminar profiles. This way down-states following shorter up-states will not mask the up-state-related activity during the first 200 ms of the depth profile average.
Time point zero corresponds to the up-state onset. Blue and red horizontal bars located above the color maps indicate up- and down-states, respectively. Data of non-functional channels were excluded. (B) Depth profiles obtained from the same penetration after the probe was moved 400 µm deeper into the cortex (average of n = 145 up-states). On the right, evoked MUA depth profile average to hindlimb stimulation (n = 714 stimulus). Neuronal activity started first in L4 (red dashed line). (C) Up-state onset-locked LFP and MUA depth profiles obtained from cortical activity recorded in the parietal association cortex (PtA; n = 1128 up-states with a duration between 200-400 ms averaged). Green arrows in the MUA depth profiles of the figure point to the activity of individual single units which can be discerned in the averages.
3.3 Laminar distribution of up-state onsets in the neocortex
The high spatial resolution of recordings allowed us to precisely detect in which cortical layer the activity during up-states started. We developed a method which was used to determine for each detected up-state the recording channel on which the first spikes appeared after the preceding down-state. In most cases, activity during spontaneous up-states started in L5 of the somatosensory cortex, which is in agreement with the findings of our previous study (Fig. 6;
Fiath et al., 2016) and with other research groups which reported that cortical L5 might have a significant role in the initiation of up-states (Beltramo et al., 2013; Chauvette et al., 2010;
Lorincz et al., 2015; Sakata and Harris, 2009; Sanchez-Vives and McCormick, 2000).
Interestingly, in some cases, we found isolated high peaks on the histograms showing the spatial distribution of up-state onsets (Fig. 6A). Such a peak usually corresponded to the activity of a single neuron which was likely to fire first during up-states. A subset of these neurons might be equivalent to L5 pyramidal cells found in mice which tend to fire early during up-states (Lorincz et al., 2015). In other cases, up-state onsets detected on channels located in L5 showed a broader spatial distribution suggesting that multiple neurons located in different parts of L5 started most up-states (Fig. 6B). In our previous study, we have also shown that during somatosensory stimulation the number of up-states with L4 onset increases compared with that obtained during spontaneous slow-wave activity (Fiath et al., 2016). These up-states, starting in the thalamorecipient L4, likely correspond to up-states evoked by sensory stimuli (Hasenstaub et
23
al., 2007). Thus, evoked up-states might be initiated through the thalamus which brain structure was proposed to have an important role in the generation and maintenance of slow waves (Crunelli et al., 2015; Crunelli and Hughes, 2010; David et al., 2013; Lemieux et al., 2014).
Here, using somatosensory stimulation, we could replicate these findings: more up-states were detected with a start of spiking activity on channels located in L4 when the hindlimb of the animal was rhythmically (~1 Hz) touched with the stimulator device (Fig. 6C).
Figure 6. – Distribution of up-state onsets across cortical layers. (A) Laminar distribution of up-state onsets detected on different channels of a recording containing spontaneous activity (left; trunk region of the somatosensory cortex; n = 2047 up-states). Dashed horizontal lines indicate cortical layer boundaries. Most of the up-states started at the same channel, located in L5 (red arrows). A sample up-state beginning at this particular channel is shown on the right (multi-unit activity; MUA). Channels recording neuronal activity outside the cortex were omitted. (B) Laminar distribution of up-state onsets in a different animal (spontaneous activity;
hindlimb region of the somatosensory cortex; n = 2139 up-states). Most up-states were initiated
24
in L5 but the distribution was broader compared with data presented in panel A. A representative up-state with L5 onset (red arrows) is shown on the right. No activity was recorded from the bottom part of L6 and no up-state started in L1 and L2 (channels 1-49). (C) Laminar distribution of up-state onsets in the same animal during ~1 Hz hindlimb stimulation (n = 1581 up-states). During stimulation, more up-states started in L4 (putative evoked up- states) compared with spontaneous activity (see panel B). A sample up-state with a L4 initiation (red arrows) is indicated on the right.
3.4 Cortical single-unit activity recorded with high spatial resolution
Activity of individual single units was isolated from the recorded MUA using spike sorting.
From the data of nine cortical penetrations made in six animals, 335 well-separated single units were obtained (average ± standard devation; 37.22 ± 11.61 units per implantation site; range:
11 – 51 units). The average peak-to-peak amplitude of the average spike waveform of isolated neurons was 217.81 ± 149.09 µV (range: 52.68 – 1060.21 µV). Single units were detected in every cortical layer, although the neuron yield was low in superficial layers (L1, n = 1; L2, n = 1; L3, n = 29; L4, n = 15; L5, n = 80; L6, n = 71; below the cortex, n = 13; calculated from the unit data of six penetrations with post-mortem histology). Due to the high-density sampling of cortical activity, the action potential waveform of a single neuron was detected on multiple, adjacent channels (Fig. 7A). The spike waveform of some of the units was distributed on a large number of recording sites (putative large-size neurons, e.g. pyramidal cells), while the action potential waveform of other neurons was visible only on one or two electrodes (putative small- size interneurons; Fig. 7A). Furthermore, high-resolution recordings allowed to observe the backpropagation of action potentials on several spike waveforms, a phenomenon characteristic of pyramidal cells (Fig. 7B; Buzsaki and Kandel, 1998; Fiath et al., 2018).
The two main types of cortical neurons, namely inhibitory interneurons and excitatory neurons, have different roles in neural computations, therefore it is important to identify and isolate them in extracellular recordings. We can distinguish between these two types of cells based on the duration of their extracellular spike waveforms (Bartho et al., 2004). Action potentials with a short duration (narrow spikes) are usually fired by GABAergic interneurons, while wide spikes
25
correspond to principal cells (mostly to pyramidal cells). By plotting the trough-to-peak time and half amplitude duration of the spike waveforms of all units, we can, by visual inspection, distinguish between the two clusters corresponding to these two neuron types (Fig. 7C). For further analysis, we classified the single units into putative principal cells (n = 267; 79.7%) and interneurons (n = 68; 20.3%) based on the trough-to-peak time of their spike waveforms (Fig.
7C).
Figure 7. – Cortical single-unit activity recorded with the laminar probe during slow oscillations. (A) Representative single-unit activity traces showing the action potentials of a single, fast-firing neuron located in L6 of the rat somatosensory cortex (top). The average spike waveform of the neuron is shown below (black arrow). Next to this unit, average spike waveforms of three neurons from other cortical layers (L3 and L5) are presented. The action potential waveform of a single unit could be recorded on multiple, adjacent recording sites.
Autocorrelograms corresponding to the single units (bin size, 1 ms) are demonstrated at the bottom. (B) Color maps constructed from the average spike waveform of a putative pyramidal cell by plotting the potential values on 69 electrodes at every second sample point (or at every 0.1 ms) of a 1-ms-long interval (inset at the bottom right). Each color map corresponds to one
26
time point. Time point zero corresponds to the negative peak of the AP waveform. Note the propagation of the spike in the upward direction which matches the apical dendritic region of the neuron (red arrow). The average spike waveforms of the neuron on the 69 channels are shown on the left. (C) The half-amplitude duration and the trough-to-peak time calculated from the average spike waveform (inset on the left) of each single unit isolated from recordings of nine penetrations (n = 335 single units). Note that putative interneurons (narrow spikes, red) and putative principal cells (wide spikes, blue) form separate clusters on the plot.
3.5 Diverse firing patterns of cortical single units during up-states
By observing the activity of individual neurons located in various layers, it is apparent that different single units participate differently in the cortical population activity during up-states (Fig. 8A). Based on the examination of their fine-scale firing patterns, we found that some neurons were likely to fire uniformly during up-states, whereas other cells were most active at the start of up-states (Fig. 8B). Another group of neurons showed increased levels of firing particularly during the later phases of active states (Fig. 8B). Furthermore, the firing pattern of neurons might depend also on the duration of up-states (Fig. 8B). For example, a neuron might fire infrequently in short up-states, while it increases its firing rate in longer up-states.
Moreover, as shown by Luczak and colleagues (Luczak et al., 2007), neurons are activated sequentially during up-states. We observed a similar sequential pattern of activation in the recorded cortical column (Fig. 8C, D). To demonstrate this pattern, first we calculated the smoothed and normalized perievent time histogram (PETH) for each neuron. Then, the latency of the peak of their firing relative to the up-state onset was determined (Fig. 8C). Finally, we ordered and plotted the smoothed PETHs of neurons based on the calculated peak-latencies (Fig. 8D).
In previous studies it was shown that in anesthetized rats neuronal activity in L3 of sensory cortices is sparse, and the spiking activity of L6 is similarly lower compared with the activity of L5 (Fiath et al., 2016; Sakata and Harris, 2009). The observed sparse activity may be the result of multiple factors, some of which can be investigated using the developed high-density probe. For example, during ketamine/xylazine induced up-states, less neurons were active in
27
L3 and L6 of the somatosensory cortex compared with L5 (Fig. 8E). In addition, active L3 and L6 neurons were engaged only in a smaller subset of up-states (Fig. 8F) and, on average, these also had lower firing rates compared with neurons located in L5 (Fig. 8G). However, more experiments need to be conducted to determine whether the results of the presented single case study (Fig. 8E-G) can be generalized. In summary, our recordings suggest that the probe is capable to simultaneously record the activity of more than thirty high-quality neurons located in different cortical layers, thus providing a detailed picture of the layer-specific dynamics of up-states in a local cortical network.
Figure 8. – Fine-scale structure of firing patterns of cortical single units during up-states.
(A) Raster plot of the spiking activity of simultaneously recorded single units (n = 51) during six consecutive up-states (indicated with blue rectangles) recorded from the somatosensory cortex of an anesthetized rat. Four wideband traces recorded from different cortical depths are shown at the top (Ch, channel) and the smoothed population activity (SPA) is presented at the bottom. The spikes of narrow spiking single units (putative interneurons; n = 11) are colored red. Single units are ordered according to their cortical depth (from top to bottom: L3 to L6;
no single units were detected in L2 and activity of L1 was not recorded). Somatic location of units was estimated at the recording site where their average spike waveform had the maximum
28
peak-to-peak amplitude. (B) Raster plots showing the spiking activity of four neurons with different firing preferences during up-states. Up-states are ordered according to their durations. Smoothed perievent time histograms (PETH; 5-ms bin size; red traces) showing the instantaneous firing rate of neurons are superimposed on the raster plots. Time point zero corresponds to the up-state onset. (C) The latency between the up-state onset and the peak value of the smoothed and normalized PETH was computed for each single unit (n = 51). (D) The normalized PETH of simultaneously recorded neurons ordered according to the peak latency.
Note that different neurons prefer different phases of up-states for firing. Putative interneurons are marked with white asterisks. The white dashed line indicates the up-state onset. (E) Number of separable neurons in each cortical layer (L3-L6) normalized according to the thickness of the layer. (F) The proportion of up-states in which a separated neuron fired at least one spike, presented for L3-L6 (average ± standard deviation). (G) The firing rate of neurons across layers (L3-L6; average ± standard deviation). All data presented on the figure are from a single animal.
3.6 Benefits of the high spatial resolution in cortical recordings
To examine whether the high spatial resolution provided by the developed 256-channel silicon probe is beneficial compared to linear probes with a lower spatial resolution, we artificially constructed lower-resolution recording files (containing 128, 64, 32 or 16 channels) by removing a subset of the channels from six, 256-channel recordings (Fig. 9A). Then, spike sorting was performed on these files separately (Fig. 9B). Only single units with a clear refractory period (see Materials and Methods) and with an average spike waveform having a peak-to-peak amplitude over 50 µV were used in the analysis. No criterion regarding the isolation distance was used in this case.
We found that the single unit yield was markedly decreasing with the decrease of the spatial resolution (Fig. 9B). The highest single unit yield was found in the case of the 256-channel recordings with single unit numbers usually over 50, while in case of the 16-channel files (lowest resolution) only ~10 units could be isolated (Fig. 9B). The single unit numbers between the two 128-channel recordings (left and right column of electrodes) were similar. The observed differences in the unit yield might be the results of multiple factors. Based on our experiences, the spike sorting process (automatic sorting and the following manual verification of unit clusters) might account for a few percent of the differences. The higher channel count and the
29
higher spatial resolution provides additional information for the spike sorting software. This helps to isolate units with lower spike amplitudes, which could not be isolated in lower resolution recordings. For example, 51 units out of the 87 units separated in one of the 256- channel recordings were also found in the 128-channel version of this recording (Fig. 9C). The remaining units were of lower amplitude (average ± standard deviation; 135.03 ± 74.88 µV vs.
261.65 ± 185.65 µV) but also had clear waveform shapes. The spikes of some of these units were only recorded by a few electrodes, thus these smaller units will most likely not be detected in recordings with a lower spatial resolution.
To examine the spatial expanse of the spikes, we calculated the action potential (AP) spread of those units which were separated from the six, 256-channel recordings (n = 368 units). The AP spread indicates the number of channels on which the average spike waveform of a particular single unit has a peak-to-peak amplitude larger than 50 µV (Fig. 9D). More than half of the units had an AP spread less than 16 channels (198/368 units). Thus, a high number of these neurons will not be detected in the recordings with the lowest spatial resolution (16-channels) which partly accounts for the lower single unit yield. Furthermore, at lower channel counts, the clusters provided by the spike sorter had usually a low quality. For instance, it merged multiple neuron clusters, which were clearly separate clusters in the 256-channel recordings, into a single cluster because the spike waveforms of the merged units were highly similar and could be discerned only on one or two channels.
Finally, we plotted the AP spread simultaneously with the spike duration (Fig. 9E). This showed that putative interneurons with narrow spikes have usually a smaller AP spread compared with putative principal cells. About 45% of the interneurons had an AP spread less than 6 channels, while in case of principal cells this number was only ~10% (Fig. 9F). This suggests that by using probes with a low spatial resolution we may not record the activity of a considerable number of nearby interneurons. Furthermore, the spike waveform of a substantial part of the
30
single units (~5 %) was recorded only on a single channel of the 256-channel recordings (Fig.
9D).
Figure 9. – Advantages of the high spatial resolution in single unit recordings. (A) Recording files with lower channel counts were constructed from six, 256-channel cortical recordings to artificially decrease the spatial resolution. The arrangement of electrodes in these recordings is shown here (ch, channel). (B) Box-and-whisker plots showing the number of single unit clusters separated in the original, 256-channel recordings and in recordings with lower spatial resolution. On the box-and-whisker plots, the middle line indicates the median, while the boxes correspond to the 25th and 75th percentile. Whiskers mark the minimum and maximum values.
Green dots correspond to single unit yields obtained for individual files (l, left; r, right). (C) Detailed results of the spike sorting of a single recording. The single units separated in lower resolution recordings which were also found in the original, 256-channel measurement are presented with black color. Units detected only in files with lower channel counts are shown in gray. (D) Distribution of the action potential (AP) spread of single units separated from the six 256-channel recordings (n = 368 units). The AP spread indicates the number of channels on which the average spike waveform of a particular single unit had a peak-to-peak amplitude larger than 50 µV (inset on the top right). Three example units with a different AP spread are
31
shown. (E) Scatter plot of the AP spread and the spike duration (trough-to-peak time) of the single units (n = 368). Putative interneurons (trough-to-peak time < 0.6 ms) are colored red, while putative principal cells are colored blue (the horizontal dashed green line is located at 0.6 ms). The vertical dashed black line separates units with an AP spread > 5 from units having an AP spread <= 5. (F) The number of putative interneurons (IN) and principal cells (PC) with an AP spread > 5 (black) and <= 5 (gray).
Spiking activity picked up by silicon probes originates from a couple of hundred neurons located close to the probe (< 100 µV; Buzsaki, 2004). In contrast, local field potentials measured in the lower (< 500 Hz) frequency band are generated by the combined activity of large populations of neurons. To examine whether such a high spatial resolution is advantageous for the recording of the LFP, we analyzed a recording performed in vitro in physiological saline solution, as well as an in vivo cortical recording (Fig 10). A three-second- long, artifact free segment of both recordings was filtered in the 0.6 – 500 Hz range (third-order order Butterworth bandpass filter; zero-phase-shift), then the samples (n = 60000/channel) were mean-centered by subtracting the mean of the sample points calculated along channels. After that, we computed the average absolute difference in the amplitude between the samples on the first (reference channel) and the other 255 channels (Fig. 10A). In case of the in vitro recording, where the electrical noise dominates the measurements, the average amplitude difference was around 8 µV, even for the most distant electrode pairs (i.e. channel 1 and channel 256). In case of the in vivo recording, the average absolute amplitude difference between the first and the second channel was around 13.8 µV, close to level of the in vitro recording (Fig. 10A; blue).
With electrodes located farther from each other, the amplitude difference increased substantially (Fig. 10A; red). The shape of the amplitude difference curve depends on the cortical depth position of the electrodes and on the chosen reference channel.
Similarly, as done also in the case of the single unit analysis, from the two 256-channel recordings we constructed recording files with a lower spatial resolution, then calculated the average absolute amplitude difference between the adjacent channels of these recordings (Fig.
32
10B, C). In case of the in vitro measurement (Fig. 10B), the average amplitude difference was similar for all the recordings (~4 µV), while for the in vivo case (Fig. 10C), the difference decreased exponentially with the increase of the spatial resolution. For the 128 and 256-channel recordings, the average difference was similar (12 µV vs. 13.85 µV), although still slightly higher than for the in vitro case. Thus, with the spatial resolution provided by the probe we are approaching the optimum level for LFP recordings. However, there is still some place for a slight improvement which might be beneficial to examine the LFP corresponding to spatially- restricted neuronal events (e.g. current source density analysis of spike waveforms).
Figure 10. – Redundancy of local field potentials in high-density cortical recordings. (A) Average absolute difference in the amplitude of the local field potential (LFP; 0.6 – 500 Hz) between the first and the other 255 channels calculated from a three-second-long segment of an in vitro (blue) and an in vivo (red) recording. (B-C) The average absolute difference in the amplitude of the LFP between adjacent channels of in vitro (B) and in vivo (C) recordings with different channel counts. Recording files with a lower spatial resolution were constructed from the original, 256-channel measurement similarly as shown in panel A of Figure 9. Dots indicate the average, while whiskers correspond to the standard deviation.
33 4. DISCUSSION
Here, using CMOS technology, we have designed and manufactured a silicon-based neural interface comprising a linear array of closely-packed microelectrodes. Our aim was to investigate the sleep slow oscillation in the neocortex of anesthetized rats with a higher spatial resolution as recent commercially available laminar probes can provide. With the developed device, we were able to record high-quality wideband activity from the somatosensory and association cortices of rats, from multiple layers simultaneously. With an average yield of 37 single units in a single implantation site, it was possible to investigate layer-specific firing patterns in a local cortical network during spontaneously occurring up-states. Moreover, the high spatial resolution enables a detailed laminar examination in the variability of individual up-states; for instance, regarding their initiation site, spatial distribution or the propagation of activity across layers. Our preliminary findings presented here were in good agreement with literature data. The possibilities of high-resolution electrophysiology might give new insights into the neuronal mechanisms underlying sleep slow oscillation, for example, into the sources of variability of up-state dynamics.
Using the developed silicon probe, we recorded the activity of cortical neurons from multiple cortical layers. Commercially available linear probes (e.g. NeuroNexus silicon probes) have a maximal vertical resolution of about 20 µm (center-to-center distance of recording sites). Since common probes comprise 32 or 64 electrodes on a single shank, the maximal vertical coverage using the best resolution will be around 1.3 mm or below. Thus, in rats, current high-resolution linear probes are not suited to record the activity of all cortical layers simultaneously. Our probe has a vertical coverage of ~1.5 mm and a significantly higher spatial resolution (~6 µm) than commercial probes, thus, in rats, we can measure the simultaneous electrical activity from almost the entire cortical thickness.
34
Although the results obtained from our high-density recordings are promising, it is important to note some of the limitations of this study. As already stated above, the distance between the first and last recording site is ~1.5 mm. Thus, in case of cortical areas thicker than 1.5 mm, we will not be able to record the activity of all layers simultaneously. Although this seems problematic, fortunately, in case of the ketamine/xylazine-induced up-states there is virtually no spiking activity in the upper two cortical layers (only one neuron was detected in each layer in six penetrations). Since the total thickness of these two layers is around ~300 µm and cortical areas in rats are usually no more than 1.8 mm thick, lowering the recording sites below layers 1 and 2 will be in most cases sufficient to record simultaneously from the remaining layers of the cortex. Furthermore, fabricating similar laminar probes with slightly bigger electrodes or with larger site spacing might also solve this issue. Moreover, placing more electrodes on the silicon shank should also be feasible without increasing the width (100 µm) of the shank.
However, more recording sites would also complicate the packaging of the probe, as well as data acquisition, since most commercially available in vivo recording systems are not suited to record from more than 256 channels at once.
In the cortical recordings presented here, spike waveforms of a single neuron were frequently located on multiple recording channels. By exploiting this additional spatial information, high- density recordings might increase the single unit yield and the reliability of spike sorting compared with common extracellular recordings (Blanche et al., 2005; Harris et al., 2000).
However, since high-density electrophysiology is a relatively young field, spike sorting performed on high-channel-count recordings is also in its infancy. Several spike sorters were developed in recent years to extract single-unit activity from high-density recordings (e.g.
Kilosort, MountainSort, JRCLUST, SpyKING CIRCUS, YASS; Chung et al., 2017; Jun et al., 2017; Lee et al., 2017; Pachitariu et al., 2016; Yger et al., 2018). Although the results provided by these software are promising, most of these programs are still under active development or
35
need to be improved for a reliable daily use in neuroscience laboratories. For instance, at this stage of development, high-end computer hardware is needed to efficiently use most of these spike sorters, or they still lack some important features necessary for an adequate separation of single-unit activity (e.g. taking into account the electrode drift or burst firing). Nevertheless, the single unit yield obtained from our data using Kilosort may increase significantly in the near future with the improvement of the performance of spike sorters. Besides the performance of spike sorters, single unit yield might also depend on the type of the anesthesia or on the actual brain state. For example, a previous study showed that a lower number of single units can be separated during ketamine/medetomidine anesthesia compared with urethane anesthesia (Hildebrandt et al., 2017).
Based on our findings, the spatial resolution provided by the probe is beneficial to record also from neurons with spatially-restricted spike waveforms (i.e. small neurons), which will also increase the gain in the single unit yield. To further improve the reliability of spike sorting, the spatial resolution could be increased even more by covering the entire silicon shaft of the probe with small recording sites, similarly to recently developed CMOS probes (Fiath et al., 2018;
Raducanu et al., 2017; Scholvin et al., 2016). Furthermore, the high spatial sampling of spike waveforms provided by these probes might improve the electrophysiology-based identification of different neuron types in the future. The additional spatial features provided by high-density probes (e.g. AP spread, distance or direction of AP propagation) may help to more reliably differentiate between putative interneurons and principal cells, or to even classify different subtypes of these neuron groups (Delgado Ruz and Schultz, 2014; Fiath et al., 2018).
Although the cortical thickness is an issue in case of rats, the probe might also be used in mice which have a thinner cortex (~1 mm). In the latter species, we will able to record activity from all cortical layers simultaneously; however, since some of the recording sites will be located outside of the cortex, the cortical single unit yield will be lower compared with that obtained in
36
rats (~10-20 separated units per penetration vs. ~35 units). Furthermore, both in rats and mice, the length of the silicon shank (8 mm) allows to examine the activity of the thalamus, the other brain structure involved in the generation of the slow oscillation (Crunelli et al., 2015; Crunelli and Hughes, 2010).
37 Acknowledgements
The research leading to these results has received funding from the European Union’s Seventh Framework Programme (FP7/2007–2013) under grant agreement no. 600925 (NeuroSeeker) and from the Hungarian Brain Research Program Grant (Grant No. 2017-1.2.1-NKP-2017- 00002). The research within project No. VEKOP-2.3.2-16-2017-00013 by I. Ulbert was supported by the European Union and the State of Hungary, co-financed by the European Regional Development Fund. R. Fiáth is thankful to the Hungarian National Research, Development and Innovation Office (PD124175).
Disclosure
The authors declare no conflict of interests. Arno Aarts and Patrick Ruther are co-founders of ATLAS Neuroengineering.
38 References
Achermann, P., Borbely, A.A., 1997. Low-frequency (< 1 Hz) oscillations in the human sleep electroencephalogram. Neuroscience 81 (1), 213-222.
Bartho, P., Hirase, H., Monconduit, L., Zugaro, M., Harris, K.D., Buzsaki, G., 2004.
Characterization of neocortical principal cells and interneurons by network interactions and extracellular features. J. Neurophysiol. 92 (1), 600-608.
Beltramo, R., D'Urso, G., Dal Maschio, M., Farisello, P., Bovetti, S., Clovis, Y., et al., 2013.
Layer-specific excitatory circuits differentially control recurrent network dynamics in the neocortex. Nat. Neurosci. 16 (2), 227-234.
Blanche, T.J., Spacek, M.A., Hetke, J.F., Swindale, N.V., 2005. Polytrodes: high-density silicon electrode arrays for large-scale multiunit recording. J. Neurophysiol. 93 (5), 2987-3000.
Buzsaki G., 2004. Large-scale recording of neuronal ensembles. Nat. Neurosci. 7 (5), 446-451.
Buzsaki, G., Kandel, A., 1998. Somadendritic backpropagation of action potentials in cortical pyramidal cells of the awake rat. J. Neurophysiol. 79 (3), 1587-1591.
Cash, S.S., Halgren, E., Dehghani, N., Rossetti, A.O., Thesen, T., Wang, C., et al., 2009. The human K-complex represents an isolated cortical down-state. Science 324 (5930), 1084-1087.
Chauvette, S., Crochet, S., Volgushev, M., Timofeev, I., 2011. Properties of slow oscillation during slow-wave sleep and anesthesia in cats. J. Neurosci. 31 (42), 14998-15008.
Chauvette, S., Volgushev, M., Timofeev, I., 2010. Origin of active states in local neocortical networks during slow sleep oscillation. Cereb. Cortex 20 (11), 2660-2674.
Chung, J.E., Magland, J.F., Barnett, A.H., Tolosa, V.M., Tooker, A.C., Lee, K.Y., et al., 2017.
A Fully Automated Approach to Spike Sorting. Neuron 95 (6), 1381-1394.e6.