all gambling harms: Results from a Finnish population-representative survey
MATTHEW BROWNE
1p, RACHEL VOLBERG
2,
MATTHEW ROCKLOFF
1and ANNE H. SALONEN
3,41Central Queensland University Bundaberg, Australia
2School of Public Health and Health Sciences, University of Massachusetts Amherst, USA
3Finnish Institute for Health and Welfare, Department of Public Health Solutions, Helsinki, Finland
4University of Eastern Finland, Faculty of Health Sciences, Finland
Received: February 07, 2020 • Revised manuscript received: April 01, 2020 • Accepted: April 22, 2020 • Published online: July 7, 2020
ABSTRACT
Background and aims:The Prevention Paradox (PP) suggests that a large proportion of aggregate harm from gambling occurs to people who do not have a gambling disorder. However, it has not yet been tested using a population-representative sample. We aimed to test whether the PP applies to gambling in Finland. The prevalence rates of diverse harmful consequences from gambling were surveyed amongst a population-representative sample of past-year gamblers.Methods:The study used first wave data (N57,186) of Finnish Gambling Harms survey, collected via online and postal surveys in 2017. A subset of 3,795 adults (≥18 years), who had gambled at least monthly in 2016, were selected for analysis.
Measurements:Gambling-related harms were evaluated with the 72-item Harms Checklist. Problem and Pathological Gambling Measure (PPGM) measured respondents’probable disordered gambling from the subset of items for impaired control (4 questions) and other issues (3 questions).Findings:
Consistent with previous findings, the majority of harms were reported by those in the less severe PPGM categories (i.e. scoring <5). However, considering each domain separately, this was true only for financial, emotional/psychological, and work/study harms. The PP was not supported for health, relationship, or social deviance harms.Conclusions: The population prevalence of the most serious harms (e.g. unsafe living conditions) is concentrated among those with severe impaired control issues.
However, even excluding the ∼15% of harms occurring to occasional gamblers, most financial, emotional and work/study impacts occur to those with lower levels of control issues. Efforts at harm reduction should focus on the entire spectrum of issues that people experience from their gambling.
KEYWORDS
gambling harms, population survey, problem gambling, prevention paradox
INTRODUCTION
Gambling problems have been largely defined with respect to a diagnosable mental health condition, variously known as compulsive gambling, pathological gambling, and most recently, disordered gambling. The Problem Gambling Severity Index (PGSI;Ferris & Wynne, 2001) and the Problem and Pathological Gambling Measure (PPGM;Williams & Volberg, 2010, 2014) are examples of population survey measures (or screens) that have the primary purpose of iden- tifying people who are likely to be suffering from a gambling-related mental health condition.
The presumption of such identification is that gambling harm can be minimised by treating those with mental health problems, or by preventing people from progressing to this disease state. However, recently it has become commonplace to take a broader view on the impacts of gambling (Abbott et al., 2018; Browne, Bellringer et al., 2017; Langham et al., 2016; Shannon,
Journal of Behavioral Addictions
9 (2020) 2, 371-382 DOI:
10.1556/2006.2020.00018
© 2020 The Author(s)
FULL-LENGTH REPORT
*Corresponding author’s e-mail:m.browne@cqu.edu.au
Anjoul, & Blaszczynski, 2017), and the focus has shifted to- wards harm prevention and harm reduction rather than solely on treatment or prevention of a mental health condition (Baxter, Hilbrecht, & Wheaton, 2019; McMahon, Thomson, Kaner, & Bambra, 2019). Impacts of gambling may occur not only to the individual gambler, but also to family members and wider society, potentially long after the gambling has ceased (Langham et al., 2016; Dowling, Smith, & Thomas, 2009; Jeffrey et al., 2019; Goodwin, Browne, Rockloff, & Rose, 2017). However, even among gamblers themselves, there is debate as to the degree to which harms extend beyond the sub-population of pathological or‘problem’ gamblers (Del- fabbro & King, 2019).
Gambling and the prevention paradox
The Prevention Paradox (PP) for gambling describes a situation in which a greater number of cases experiencing gambling- related harm come from low-risk gamblers because they are more prevalent than high-risk gamblers in the population (Browne & Rockloff, 2018; Browne, Greer, Rawat, & Rockloff, 2017). The“paradox”is evident in the observation that more aggregate harm is suffered by the low-risk population even though, individually, people in the high-risk population (e.g., problem gamblers) are suffering the greatest amount of per- person harm. Whether or not the PP is supported for a given topic depends a great deal on how the high-risk population is defined, what harms are‘counted’, and how impact is measured (Delfrabbro & King, 2017). Nevertheless, the PP can be a useful lens with which to explore the distribution of impacts in a population, and the degree to which various forms of harm are concentrated in high risk groups.
Of all health-related conditions, alcohol use arguably provides the closest analogue to gambling, being a legal he- donic behaviour with high population prevalence in legal ju- risdictions, that is also associated with propensity for addiction and harm.Kreitman (1986) first reported evidence that the prevention paradox applies to alcohol, with most individuals reporting harm related to intoxication not meeting thresholds for hazardous drinking. Subsequent literature largely sup- ported this initial finding. Alcohol-related injuries are more commonly associated with those who are not alcohol-depen- dent (Spurling & Vinson, 2005). Similarly, a study of 7,288 Swedish adolescents found that the bottom 90% of consumers by alcohol intake accounted for the large majority of alcohol- related problems among boys and girls of all ages (Romelsj€o &
Danielsson, 2012). In a population representative study, O’Dwyer et al. (2019)considered a variety of forms of alcohol- related harm:finances, health, work or study, friendships or social life, home life or marriage, been in a physicalfight, been in an accident, and stopped by the police. They found that high-risk drinkers (7% of the population) accounted for only about one-quarter (27%) of harms experienced by survey re- spondents. The relative proportions attributable to each risk category were approximately commensurate for the various forms of harm, although work/study harms and harms to friendships/social life were slightly more concentrated among more severe risk categories. Thus, in the case of alcohol, low-
risk categories do not equate to no-risk, and do in fact contribute the larger quantum of harm at the population level.
There is evidence indicating that the PP is relevant to gambling (Browne & Rockloff, 2018; Canale, Vieno, &
Griffiths, 2016; Raisamo, M€akel€a, Salonen, & Lintonen, 2015). However, due to the diverse nature and wide-ranging severity of gambling harms, some debate surrounds the application of PP to this condition (e.g.,Delfabbro & King, 2017). It has been suggested that some harms might be better thought of as natural economic opportunity costs;
others have argued that some harms are not serious enough to be comparable to the impacts captured by traditional problem-gambling measures. For this reason, there is some benefit to considering the PP separately for each specific harmful outcome – and therefore avoiding the potential confound of milder outcomes (e.g., difficulty in paying bills) with those that are more severe (e.g., bankruptcy).
Browne and Rockloff (2018)evaluated the PP with respect to Langham et al.’s (2016) taxonomy of gambling harms, which organises specific harmful symptomatology into six harm domains: financial, health, relationship, emotional/
psychological, work/study and social deviance harms. Social deviance harms include a variety of forms of non-normative and maladaptive behaviour arising from excessive gambling involvement or gambling losses; and include criminal activity, cultural disengagement and neglect of children. They found that the PP was generally supported in the case of gambling, except for social deviance harms (in aggregate), and the most severe specific harms from other domains (e.g., neglecting one’s medical needs). However, an important limitation of Browne and Rockloff’s (2018)study is that they had recourse only to non-population representative data sourced from commercial internet panel providers, and therefore could only infer the population prevalence of harms by weighting con- dition estimates relative to PGSI risk categories, with respect to prior estimates of the prevalence of these risk categories in the population. Furthermore, the PGSI itself is not ideal for the purpose of defining the high- and low-risk populations.
As well as for assessing behavioural dependence, the PGSI also places approximately equal emphasis on assessing harms associated with problem gambling. Thus, there is a conceptual tautology in using the PGSI, a measure partially defined by harm, as a risk factor for a broader spectrum of harms.
So far, this outcome-focused taxonomy has been employed in non-population representative studies in Australia (Browne, Greer, et al., 2017; Browne et al., 2016) and New Zealand (Browne, Bellringer et al., 2017) and for creating low-risk gambling guidelines in Canada (Currie et al., 2018). To our knowledge, the population-based Finnish Gambling Harms survey is the first to use such a comprehensive taxonomy of gambling-related harms (Salonen, Hellman, Latvala, &
Castren, 2018; Salonen, Latvala, Castren, Selin, & Hellman, 2017; Salonen et al., 2019).
Gambling problems and harm in Finland
Finns are very active gamblers, which highlight the need for harm prevention and reduction in the country. In Finland,
gambling expenditure per capita is the highest in Europe and fourth highest in the world (The Economist, 2017). The past-year gambling participation rate has been estimated at 80% (Salonen & Raisamo, 2015). Gambling opportunities and advertisements in Finland are widespread and highly visible. More than 18,000 slot machines are scattered around the country, including grocery stores, kiosks, petrol stations, cafeterias and restaurants. Until December 2016, Finland had a three-party monopoly for gambling. In January 2017, these companies were forcibly merged to create a single monopoly supplier. The main justification given for the Finnish gambling monopoly was to provide centralised control with the aim to prevent and reduce gambling-related harm. The Lotteries Act refers tofinancial, social and health harms that the monopoly supplier might better minimise.
However, in addition, Finns are permitted to gamble online with foreign-based operators due partly to treaty obligations.
Since 2003, problem gambling has been monitored previ- ously in Finland using cross-sectional population surveys. The South Oaks Gambling Screen (SOGS;Lesieur & Blume, 1987, 1993) has been used as the primary instrument. In 2015, the past-year problem gambling (SOGS ≥3) prevalence rate was 3.3% (Salonen & Raisamo, 2015); a typical rate based on in- ternational comparisons (Williams, Volberg, & Stevens, 2012).
The problem gambling prevalence rate in Finland has not changed significantly between 2007 and 2015 (Castren, Heis- kanen, & Salonen, 2018; Castren, Perhoniemi, Kontto, Alho, &
Salonen, 2018). The Finnish Gambling Harms survey found that 11% of the population living in the selected regions (Uusimaa, Pirkanmaa and Kymenlaakso) had experienced at least one gambling-related harm during 2016. When con- verted into a numerical share of the population base, this figure corresponds to a total of 190,928 residents (Salonen et al., 2018). Nevertheless, evidence from help-seeking gam- blers –who likely reflect a subset of more severely affected problem gamblers – indicates that there is a much smaller group of gamblers that experience both more harms and more severe harms (Salonen et al., 2019; Silvennoinen et al., 2019).
The present study
The measurement of gambling harm and the assessment of its distribution in the population is the subject of much debate and ongoing research. This has included the devel- opment of dedicated measures such as the Short Gambling Harms Screen (SGHS;Browne, Goodwin, & Rockloff, 2017), as well as population-based research utilizing the PGSI as a proxy to identify harms (Canale et al. 2016; Raisamo et al., 2015). Other work has combined items from several prob- lem gambling instruments (e.g. PGSI and SOGS; Salonen, Alho, & Castren, 2017; Salonen, Castren, Latvala, Heiskanen,
& Alho, 2017; Castren, Heiskanen, et al., 2018; Castren, Perhoniemi, et al., 2018). Given the diverse range and the greatly varying severity of gambling harms, the Finnish Gambling Harms Survey took the conservative approach of assessing population prevalence using the comprehensive checklist of harms that Browne et al. (2016) derived from Langham et al.’s (2016)framework and taxonomy.
Undertaking similar PP analyses as those conducted by Browne and Rockloff (2018), this study aims to test whether the prevention paradox applies to gambling in Finland among regular gamblers. Similar to the prior work, we assess the PP with respect to each specific aspect of harm symp- tomatology, as well as undertaking aggregate analyses. In addition to examining the question in a different cultural and regulatory context, this study builds on the prior work in two important ways. First, by using population repre- sentative data, we are able to calculate population prevalence of harms conditional on risk directly, rather than inferring them from a combination of cross-sectional and population data. Second, we employ a measure of risk that captures only impaired control and behavioural dependence–rather than the PGSI, that measures the more general construct of
‘problems’, which encompasses both dependence and harm.
METHOD
This study is based on a population-based Finnish Gambling Harms survey. It was originally launched to evaluate gambling, gambling-related harm, and opinions on gambling marketing in connection with the reform of the Finnish gambling monopoly.
This study employs data from the first wave, which was con- ducted before the structural reforms. The Finnish Institute for Health and Welfare was responsible for conducting the study.
Participants
The data (N 5 20,000) were collected by Statistics Finland between January and March 2017 (Salonen et al., 2018; Sal- onen, Latvala, et al. 2017). The study was conducted among adults in three Finnish regions: Uusimaa, Pirkanmaa and Kymenlaakso. Overall, the residents in these areas account for about 42% of the Finnish population. Participants were randomly selected from the population information system: a national database of Finns. Finns between 18- and 24-years- olds were oversampled: 15% of this age group was sampled for the survey while they represent only 10% of the population.
Inclusion criteria included: 1) 18 years old or over (the min- imum age to gamble is 18), and 2) the ability to understand Finnish or Swedish. Institutionalized persons, such as pris- oners, mental health patients and the infirm, were excluded.
The data were collected using online and postal surveys.
The invitation letter for the potential participants was sent to their home address retrieved from the population informa- tion system. Both the invitation letter and the first reminder included a link to the online questionnaire and a personal participation code. The next two reminder letters also included the postal questionnaire and a prepaid return en- velope. The survey was available in Finnish and Swedish.
After excluding non-eligible individuals (N567), the study sample size was 19,933 persons. Overall, 7,186 adults who were contacted ultimately participated in the study, yielding a response rate of 36.1%. Of the respondents, 71% (N 55,084) participated using the online survey while 29% (N 5 2,102) completed the postal survey. Gambling participation,
particularly online gambling, as well as at-risk gambling and problem gambling were more common among those who participated using the online survey compared with those using the postal version (Salonen, Latvala, et al. 2017). The study sample was individually linked to administrative socio-de- mographic data from Statistics Finland to obtain information of both respondents and non-respondents. Overall, women and older respondents were more willing to participate compared with men and younger respondents (Salonen, Latvala, et al.
2017). Most active respondents were 65–74-year-olds and the second most active 55–64-year-olds. The least actives were 18– 24-year-olds, particularly men in this age group. In the oldest age group, the response rate was 13% points higher among men compared with women, which was the most significant gender difference. Married respondents were more active compared with single or divorced individuals. Those with higher educa- tion were more active compared with those with lower educa- tion.
We assumed that only those who reported regular gambling, i.e. at least once a month, were at risk of signifi- cant gambling-related harm, and therefore only these cases were selected for analysis. A total of 3,795 regular gamblers (56.7% male; median age551.0 years), representing 54.5%
of the study sample were analysed. The estimated population represented by this sample is 939,706 regular adult gamblers living in Uusimaa, Pirkanmaa and Kymenlaakso.
Dependence and impaired control
Past-year (in 2016) gambling severity was assessed using the 14-item Problem and Pathological Gambling Measure (PPGM;Williams & Volberg, 2010; 2014). The PPGM covers three categories: Problems (7 questions), Impaired Control (4 questions), and Other Issues (3 questions). In the full instru- ment, gambling severity is categorized into recreational gambling, at-risk gambling, pathological gambling and prob- lem gambling (Williams & Volberg, 2010). The PPGM has been shown to be a sensitive and accurate screen for identi- fying problem gambling (Williams & Volberg, 2014). In this study, the problem and pathological gambling rate was 2.3%
(Salonen, Latvala, et al. 2017). To shorten the average survey completion time, the PPGM was asked only from those in- dividuals who had gambled at least once a month and, therefore, respondents gambling less than monthly were cat- egorised as recreational gambling category while the popula- tion prevalence rate was calculated. When past-year problem gambling is measured using the SOGS (score ≥3), problem gambling prevalence rate is 1.4 times higher than the PPGM (Williams & Volberg 2010; Williams, West, & Simpson, 2012).
Therefore, PPGM problem gambling prevalence rate of 2.3%
reflects the SOGS rate of 3.2%. For the purposes of this paper, only items measuring Impaired Control (4 questions) and Other Issues (3 questions) were used to define the at-risk populations. This was done in order to measure only behav- ioural dependence and impaired control, and to avoid construct overlap with the outcome of harmful impacts. The scores for these two sub-categories were recoded as: None, 1– 2, 3–4 and 5 or more. The 5þthreshold corresponds closely to
the PPGM category of pathological gambler, and defines the high-risk group for the purposes of evaluating the PP. Notably, a score of 1þ(on any of the PPGM items) puts a person into the At-Risk Gambling category, all of the Finnish survey participants who scored 1þwould align with that category in the original PPGM. Our sample comprised 2,992 individuals with no control issues (81.0%), 525 scoring 1–2 (14.2%), 117 scoring 3–4 (3.16%), and 58 scoring 5þ(1.5%).
Gambling-related harms
Gambling-related harms during the past year (in 2016) were evaluated using the harms checklist (Browne et al., 2016;
Langham et al., 2016). This checklist organises 72 specific aspects of harm symptomatology into six domains:financial, health, relationship, emotional/psychological, work/study and social deviance harms. The checklist has been employed in Australia (Browne et al., 2016; Browne, Rawat, et al., 2017bib_Browne_and_Rockloff_2017; Li et al., 2016), and in New Zealand (Rawat et al., 2018), in the context of capturing symptomatology for the purpose of eliciting health utility weights for gambling. It has not previously been deployed in its entirety in a population-representative survey. Each harm symptom is scored dichotomously (0,1) in terms of whether the symptom was present or absent.
Both the PPGM and the harms checklist were translated into Finnish and back-translated into English and then checked by the instrument developers.
The harms checklist was completed by all past-year gamblers, including those who gambled less than monthly (27.4%), and accordingly were not administered the PPGM.
These occasional gamblers were most often women, 50- years-olds or younger, and had personal monthly net in- come 1,000Vor less. A total of 388 (14.5%) of harms out of 2,680 total, were reported by participants in this category.
Because these harms were not associated with a PPGM score, they did not form part of the present analysis.
Data analysis
Descriptive analyses were conducted to summarise the preva- lence of harms reported by different at-risk groups, as captured by the relevant subscales of the PPGM. Summaries were calculated for each specific item of harm symptomatology. The population prevalence of harms was also summarised within each domain, and across all domains. The calibrated weights were calculated to decrease the error due to non-response and improve the estimation by correction for the coverage error.
All analyses used population weights based on gender, age, education and region of residence. Sample weights were pro- duced for respondents to reflect total population. For graphical visualisation of the results, we relied primarily on mosaic plots.
Mosaic plots provide a way to visualise relative frequencies, conditional on two factors (categories), in which the area of each rectangle is proportional to the probability that it will be observed. Mosaic plots can also be thought of as a stacked bar chart, in which the width of each bar is determined by the relative prevalence of that group. In the present case, the fac- tors involved some grouping of harms (e.g. 1þ harms
reported, a delineation of specific harms, aggregate harms within domains) and our PPGM defined categories. Further explanatory notes on how to interpret the mosaic plots are provided below. All analyses were conducted in R (R Core Team, 2019).
Ethics
The research protocol was approved by the Ethics Com- mittee of the Finnish Institute for Health and Welfare (Statement THL/1390/6.02.01/2016). Core principles of the research ethics, including giving written information about
the study, and ensuring voluntary participation, were fol- lowed throughout the research process (The World Medical Association’s Declaration Helsinki 2004). The survey data is openly available for research purposes from the Finnish Social Science Data Archive (https://www.fsd.uta.fi/en/).
RESULTS
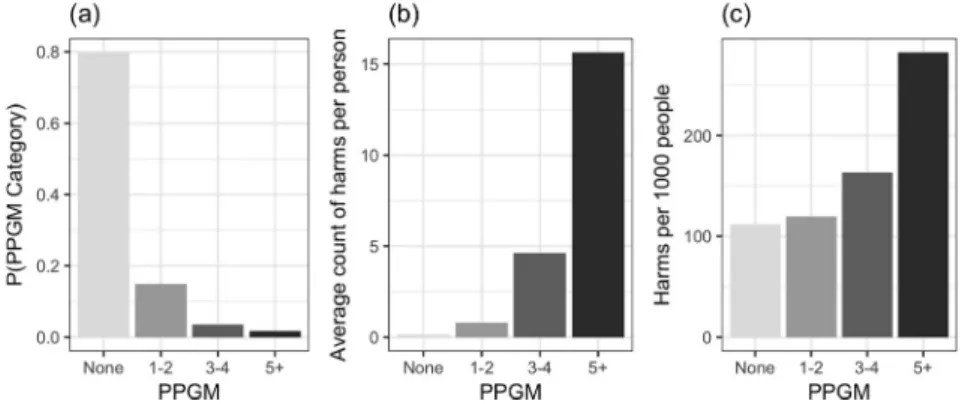
Fig. 1illustrates the inverse relationship between severity of harm and prevalence, relative to the PPGM, and how these combine to contribute to aggregate impact of each group.
Figure 1.(a) Prevalence of PPGM categories, (b) average number of harms per person within PPGM categories, and (c) number of harms per 1,000 people
Figure 2.Mosaic plot with areas denoting the proportion of individuals in the population with at least one harm, by PPGM category
Figure 3.Prevalence individuals reporting differing numbers of harms by PPGM category
Panel (a) gives the prevalence of individuals in each of the PPGM categories in the selected Finnish regions. Prevalence decreases markedly with respect to increasing risk. Panel (b) gives the average count of harms (across all domains), conditional on membership in each risk group. Severity of
impact increases markedly with PPGM risk category. Across all individuals, the Pearson rank-order correlation between the PPGM scores and the count of harms was 0.49. Panel (c) aggregates all harms in the sample within each PPGM category that relate directly to the PP. The total weighted number of harms reported in the highest (PPGM 5þ) risk category was 282 (41.7%), compared to 395 (59.3%) across the three lower risk categories.
Fig. 2presents a mosaic plot of the number of individuals experiencing at least one harm across each of the PPGM categories. The relative area of each dark shaded rectangle describes the probability that a member of the sample will report 1þharms and be a member of a given PPGM risk category. It illustrates that while almost all individuals in the highest risk category will report 1þharms, any given indi- vidual reporting 1þharms is more likely to be in a lower risk category. However, an important limitation of such a figure is that it ignores differing degrees of harm severity, and it should not be assumed that an individual reporting just one harm is necessarily experiencing a meaningfully largedegreeof gambling harm.
A more nuanced view of the distribution of population impact across risk categories is provided by Fig. 3. This figure presents the prevalence, per 1,000 individuals, of monthly gamblers reporting different number of harms, broken down by PPGM risk category. Keeping in mind the Figure 4.Mosaic plot with areas denoting the proportion of harms
arising from each harm domain by PPGM categories
Figure 5.Proportion of specific financial harms with respect to PPGM categories
Figure 6.Proportion of specific emotional/psychological harms with respect to PPGM categories
differing scales on the y-axis for panels (a) and (b), it il- lustrates that most harmed gamblers report relatively few (1–8) harms from the total checklist of 72 harms. The shading of each bar illustrates the number of gamblers from each PPGM category reporting a particular number of harms. Those in the most severe risk category (PPGM 5þ) make up a very small proportion of gamblers reporting few (e.g. 1–4) harms. However, those in the most severe risk category represent the overwhelming majority of individuals reporting many harms (e.g. 20þ).
A limitation of examining the aggregate count of harms is that this approach ignores differences in the type and severity of harms experienced.Fig. 4 illustrates the relative proportion of harms reported, broken down by harm domain and risk category. Financial and emotional/psy- chological harms are both more common and more broadly distributed across PPGM risk groups. Work/study harms are not commonly reported but have a similar distribution by risk group. The PP is supported for these harm domains. In contrast, health, relationships, and social deviance harms are more restricted to the highest PPGM category, with over 50% of reported impacts attributable to the high-risk group.
The PP is therefore not supported for these domains.
Figs. 5–10show mosaic plots for each specific harm, for each of the harm domain. In each figure, the harms are ordered with respect to population prevalence, with more
prevalent harms towards the bottom of each figure. Note that harms in some domains (e.g., social deviance) are less prevalent than other domains (e.g.,financial). Thus, because eachfigure is scaled to the same size, the visual indication of the relative prevalence of specific harms should not be compared acrossfigures.
The least severe and most prevalent financial harms, e.g., reduction of available spending money and spending on recreational expenses, were more likely to occur among gamblers experiencing no impaired control/issues or just some (Fig. 5). The PP was also supported for the rest of the more prevalentfinancial harms, with the majority of cases of some quite severe harms, such as dependence on welfare, taking on additional employment, and reduced spending on essential expenses, occurring outside of the highest risk PPGM group. However, in general, more severe harms tended to have greater representation among those groups indicating some degree of control issues (i.e., PPGM control issues scores of 1–2, 3–4, or 5þ). This pattern is even clearer in the case of emotional and psychological harms (Fig. 6).
More than 50% of the cases of most emotional impacts, ranging from regret (mildest) to hopelessness (most severe), were reported by those outside of the highest risk category.
However, very few cases of moderately severe symptom- atology, such as feelings of hopelessness or shame, arose from those with zero control issues. More than 50% of the
Figure 7.Proportion of specific work/study harms with respect to PPGM categories
Figure 8.Proportion of specific health-related harms with respect to PPGM categories
most severe emotional impacts, including feeling worthless and a desire to escape, tended to arise from the high-risk group.
Work and study harms (Fig. 7) did not follow such a clear pattern. This is partly due to the fact that they had a relatively low prevalence overall in our sample, and are therefore subject to greater uncertainty/noise. The most common impacts from gambling were taking time from work or study to gamble, and reduced performance at work or study due to gambling. Nevertheless, the PP was sup- ported for most work/study harms, although this was mar- ginal in some cases, with those in the high-risk group contributing close to 50% of the cases for 4 of the 10 harms in this domain.
The pattern is simpler and more clear-cut for health harms (Fig. 8) and relationship harms (Fig. 9). The pro- portion of harms arising from the high-risk group is relatively consistent, at about 50%. Thus, the PP is not clearly supported for either domain. Social deviance harms (Fig. 10) present a more complex pattern, with the PP tending to be supported for half (6/12) of these harms.
Somewhat surprisingly, there appeared to be little associ- ation between severity and overall prevalence of the harm, and the degree to which it was concentrated in the high- risk group. As in the case of work/study harms, it should be borne in mind that this domain has the lowest overall
prevalence, and therefore estimates are subject to greater uncertainty.
DISCUSSION
This paper addressed the population prevalence of gambling-related harms, and specifically the number of harms attributable to differing levels of risk as assessed by the PPGM. Using the lens of the PP, we aimed to determine whether the majority of cases arose from the highest risk category: those displaying control issues and behavioural dependence at a pathological level. In contrast to a previous attempt to address the PP (Browne & Rockloff, 2018), the present study employed a direct randomly selected sample and population-weighted dataset. Furthermore, we defined the high-risk group purely in terms of control/dependence issues –thus avoiding conceptual overlap between the risk factor and the outcome.
Overall, we found the PP to be modestly supported, with approximately 60% of all harms arising from the lower risk groups (Fig. 1c). However, as shall be discussed in the Limitations, this is conservative, and likely to be an under- estimate, due to the exclusion of participants who gambled less than monthly. The large majority of respondents Figure 9.Proportion of specific relationship harms with respect to
PPGM categories
Figure 10.Proportion of specific social deviance harms with respect to PPGM categories
reporting gambling harms reported less than eight harms, and these participants were unlikely to be the in the highest risk category (Fig. 2). Nevertheless, those persons reporting many harms (e.g. 20þ) were very likely to be in the highest risk category. Perhaps most interesting is our finding that the PP depends greatly on which domain of harm is being considered, which can be understood in terms of the pro- gression of gambling problems. From a theoretical perspective, gambling causes harm primarily via unsustain- ablefinancial losses, and–to a lesser extent–excessive time investment. As shown by our breakdown by harm domain (Fig. 4), the PP is supported for these initial ‘primary im- pacts’, in which up to 75% of financial, work/study, and emotional/psychological symptomatology occurs outside of the high-risk group. Our interpretation is that the emotional impacts, such as feelings of shame, or feeling like a failure are bound up and experienced concurrently with the expe- rience offinancial harms arising from excessive losses. Our results suggest that for the most part, these impacts are not restricted to the small group experiencing control issues or dependence at a pathological level. On the other hand, im- pacts to health, relationships, and the fostering of socially deviant activity may be thought of as ‘secondary impacts’, and the PP is notsupported for these domains. These im- pacts tend to be more severe and also tend to arise from an advanced state of the condition; that is, a persistent inability to control one’s gambling, despite mounting negative con- sequences. This interpretation posits that harm associated with relationships with other people tends to occurafterthe condition has progressed to a point at which impacts can no longer be absorbed or internalised by the individual. This perspective is congruent with the presentfinding that harms from these domains are largely concentrated in those with a pathological degree of control issues.
Comparison with prior PP analysis
As noted, the methodology of the present study differed from that of Browne and Rockloff’s (2018) analysis in important respects. The present analysis is stronger in terms of requiring fewer assumptions and being based on directly measured population data. The use of the PPGM-based control and dependence categorisation of the high-risk group is also theoretically more consistent than their use of the PGSI problem gambling category. However, one disad- vantage of the present approach is that, because members of the higher risk categories are relatively rare, there are rela- tively few cases in the higher risk categories (N 5 58). By combining stratified data on harms in relation to risk cate- gories, and population estimates of the risk categories, Browne and Rockloff’s (2018)analysis is subject to less noise in estimating the number of harms arising from the highest risk category. It is also worth reiterating that there are substantial differences in culture and product availability between the target populations of Finland and Australia.
With these methodological differences in mind, it is useful to delineate the ways in which the current results are similar and dissimilar from the prior study. At a broad scale,
the relative contributions of each risk category to cases of symptomology and harmed individuals are very similar (Figs. 1–3). Both studies found that the bulk of harms for the population are paradoxically associated with individuals reporting relatively few harms (e.g. <8), and the large ma- jority of individuals reporting harms are not in the highest risk category. Both studies also found that >50% of harms arise from individuals outside of the highest risk category, due to the far greater number of individuals in these groups.
Aggregate estimates of harm to individuals were also on a similar scale, with between 100 and 300 harms per 1,000 people in both jurisdictions, depending on risk group.
Browne and Rockloff (2018)also found thatfinancial harms were the most common form of harm reported, followed by emotional and psychological harms. However, the Finnish results showed a greater proportion of this kind of affective harm than the Australian study–which may reflect cultural differences in propensity to admit to such impact. Apart from this, the relative contributions of each domain were consistent across the studies. The relative contributions of the risk categories by domain were similar in some respects, for example with financial harms more distributed across lower risk categories, and social deviance harms being concentrated in the highest risk category. Overall, Browne and Rockloff’s (2018)study more fully supported the PP. For example, the Australian analysis showed that only 10% of financial harms arose from (PGSI) problem gamblers.
However, the present survey showed that about 20% of financial harms arose from the highest risk (5þ) group. This is probably largely due to differences in the definition of the high-risk group, which we will discuss further below.
Limitations
As noted in the Method, only those who gambled at least once a month were assessed for gambling-related harm.
Thus, any harms experienced by significant others, and those who gambled occasionally – including those who attempt to practice abstinence with infrequent relapse – were excluded from the calculations. Further, as mentioned in the Introduction, this study was limited to harms reported by (current) gamblers themselves, and therefore did not account for legacy harms or harms to others. Calculations involving the aggregate count of harms are inherently problematic. On one hand, harms vary in severity, which is not taken into account when each harm is treated equally.
However, harms may also overlap in terms of their construct coverage. For example, emotional harms involving anger, shame, and hopelessness and distress could be said to all reflect a single construct of negative affect. Thus, when aggregated, this can lead to a multiplicative effect, where a single instance of impact is counted multiple times through similar items. This will tend to inflate the‘burden of harm’
attributable to high risk gamblers in high risk gamblers, who are much more likely to report multiple harms. Considering these limitations together, it is likely our analysis yielded an under-estimate of the degree to which the PP applies to gambling.
An important limitation is the exclusion of occasional (less than monthly) from the analysis, due to these partici- pants not being administered the PPGM. This decision was made in the interests of lightening the burden of filling the questionnaire and improving the response rate. However, given that 15.5% of all harms recorded arose from this group, and that it is reasonable to assume that occasional gamblers would be much less likely to have control issues, the results are likely to be biased in a conservative direction.
That is, the true proportion of harms arising from low risk categories may be as high as 75%.
For gambling, the PP is sensitive to definitional conven- tions. Whether or not it is supported depends partly on which harm (or type of harm) is being considered, but most crucially, on how the high-risk group is defined. A catego- risation of individuals in high risk groups is relatively un- ambiguous and straightforward for most physical risk factors, for example whether one is a smoker or not, or has diabetes or not. However, gambling dependence and loss of control is a more complex risk factor, which does not always allow for unambiguous classification of individuals (Blaszczynski &
McConaghy, 1989; Blaszczynski & Nower, 2002). Further- more, relapse and transitions between risk categories are known to occur frequently, and therefore may not be captured by a past-year screen (Ledgerwood & Petry, 2006).
Similarly, gambling harms are diverse and numerous. Thus, the PP applied to gambling admits multiple answers, depending on the threshold used to define the at-risk group, and the harmful outcome(s) that are considered. These con- siderations highlight the need for more nuanced population health approaches to assessing harm as a decrement to health utility (see e.g. Browne, Greer, Rawat & Rockloff, 2017;
Browne, Rawat, et al., 2017). Nevertheless, as long as one keeps this strong caveat in mind, posing the PP question provides a useful lens with which to describe the distribution of various specific consequences across the continuum of risk.
Although population prevalence data is superior in many ways to the hybrid approach used previously, one disadvan- tage is that the sampling relies on the (infrequent) natural occurrence of high-risk individuals in the population. This necessarily results in lower resolution of the prevalence rates of harm among the much rarer, high risk group. Although the hybrid approach used by Browne and Rockloff (2018) in- cludes a necessary assumption about the correspondence of cross-sectional to population data, it does allow for over- sampling – and therefore better resolution – in estimating prevalence of harms among the high-risk group. As has been mentioned, the studies also differed in terms of how the high- risk group was defined, as well as in terms of cultural, com- mercial and regulatory features of the two jurisdictions.
CONCLUSION
We conclude that the PP is broadly supported, when considered with respect to Finnish population data, and using a dedicated measure of control issues/dependence to define the high-risk group. However, the balance of impact
was less strongly weighted in favour of the low risk group, when compared to the prior analysis (Browne & Rockloff, 2018). Nevertheless, in common withBrowne and Rockloff (2018), we found that the inverse relationship between prevalence and severity tends to have a counteracting effect, leading to a broadly commensurate level of impact across the spectrum of problem gambling severity, inclusive of non-problem gamblers. This reinforces a principle of the public health approach: that assessment and amelioration of gambling harm should occur across the entire continuum of gambling involvement.
Funding sources:The Finnish Gambling Harms survey was funded by the Ministry of Social Affairs and Health, Finland, within the objectives of the x52 Appropriation of the Lot- teries Act. Daily work of the author AHS at the Finnish Institute for Health and Welfare, Finland, was also funded by the Ministry. The Ministry has had no role in the study design, analysis, or interpretation of the results of the manuscript or any phase of the publication process.
Authors’contribution:MB, RV and AHS conceived, designed, and planned the study following the example of previous work by MB and MR. The data were analysed by MB. MB, RV, MR and AHS interpreted the results. MB and AHS wrote the first draft of the article. MB, RV, MR and AHS critically revised the article for important intellectual content.
Conflict of interest: The authors declare no potential finan- cial or other relationship relevant conflicts of interest with respect to the research, authorship, and/or publication of this article. Future opportunities of the authors are not contingent upon the results of the research.
REFERENCES
Abbott, M., Binde, P., Clark, L., Hodgins, D., Johnson, M., Manitowabi, D. et al. (2018). Conceptual framework of harmful gambling: An international collaboration (3rd ed.). Guelph, Ontario, Canada: Gambling research exchange Ontario (GREO).https://doi.org/10.33684/CFHG3.en.
Baxter, D. G., Hilbrecht, M., & Wheaton, C. T. J. (2019). A map- ping review of research on gambling harm in three regulatory environments. Harm Reduction Journal, 16(1), 12. https://doi.
org/10.1186/s12954-018-0265-3.
Blaszczynski, A. P., & McConaghy, N. (1989). The medical model of pathological gambling: Current shortcomings. Journal of Gambling Behavior, 5(1), 42–52. https://doi.org/10.1007/
BF01022136.
Blaszczynski, A., & Nower, L. (2002). A pathways model of prob- lem and pathological gambling. Addiction, 97(5), 487–499.
https://doi.org/10.1046/j.1360-0443.2002.00015.x.
Browne, M., Bellringer, M., Greer, N., Kolandai-Matchett, K Rawat, V., Langham, E. et al. (2017). Measuring the burden of gambling harm in New Zealand.Wellington: Ministry of Health.
Browne, M., Goodwin, B. C., & Rockloff, M. J. (2017). Validation of the Short gambling harm screen (SGHS): A tool for assessment of harms from gambling.Journal of Gambling Studies, 34(2), 499–512.https://doi.org/10.1007/s10899-017-9698-y.
Browne, M., Greer, N., Armstrong, T., Doran, C., Kinchin, I., Langham, E. et al. (2017). The social cost of gambling to Vic- toria. Melbourne.
Browne, M., Greer, N., Rawat, V., & Rockloff, M. (2017). A pop- ulation-level metric for gambling-related harm.International Gambling Studies,17(2), 163–175.
Browne, M., Langham, E., Rawat, V., Greer, N., Li, E., Rose, J. et al.
(2016). Assessing gambling-related harm in Victoria: A public health perspective. Melbourne: Victorian Responsible Gambling Foundation.https://doi.org/10.11575/PRISM/9419.
Browne, M., Rawat, V., Greer, N., Langham, E., Rockloff, M., &
Hanley, C. (2017). What is the harm? Applying a public health methodology to measure the impact of gambling problems and harm on quality of life. Journal of Gambling Issues, 0(36).
https://doi.org/10.4309/jgi.2017.36.2.
Browne, M., & Rockloff, M. J. (2017). The dangers of conflating gambling-related harm with disordered gambling: Commentary on: Prevention paradox logic and problem gambling (Delfabbro
& King, 2017).Journal of Behavioral Addictions,6(3), 317–320.
Browne, M., & Rockloff, M. J. (2018). Prevalence of gambling- related harm provides evidence for the prevention paradox.
Journal of Behavioral Addictions,7(2), 410–422.https://doi.org/
10.1556/2006.7.2018.41.
Canale, N., Vieno, A., & Griffiths, M. D. (2016). The extent and distribution of gambling-related harms and the prevention paradox in a British population survey.Journal of Behavioral Addictions,5(2), 204–212.https://doi.org/10.1556/2006.5.2016.
023.
Castren, S., Heiskanen, M., Salonen, A.H. (2018) Trends in gambling participation and gambling severity among Finnish men and women: Cross-sectional population surveys in 2007, 2011 and 2015.BMJ Open,8.https://doi.org/10.1136/bmjopen- 2018-022129.
Castren, S., Perhoniemi, R., Kontto, J., Alho, H., & Salonen, A.H.
(2018). Association between gambling involvement by game type and gambling harms: Finnish population study.Interna- tional Gambling Studies, 18(1), 124–142. https://doi.org/10.
1080/14459795.2017.1388830.
Currie, S. R., Currie, S., Flores-Pajot, M.-C., Hodgins, D., Nadeau, L., Paradis, C. et al. (2018). A research plan to define Canada’s first low-risk gambling guidelines.Health Promotion Interna- tional, 34(6), 1207–1217. https://doi.org/10.1093/heapro/
day074.
Delfabbro, P., & King, D. (2017). Prevention paradox logic and problem gambling: Does low-risk gambling impose a greater burden of harm than high-risk gambling?Journal of Behavioral Addictions, 1–5. https://doi.org/10.1556/2006.6.
2017.022.
Delfabbro, P., & King, D. L. (2019). Challenges in the con- ceptualisation and measurement of gambling-related harm.
Journal of Gambling Studies, 1–13.
Dowling, N., Smith, D., & Thomas, T. (2009). The family func- tioning of female pathological gamblers.International Journal of Mental Health and Addiction,7(1), 29–44.
Ferris, J., & Wynne, H. (2001).The Canadian problem gambling Index: Final report. Ontario (CAN).
Goodwin, B. C., Browne, M., Rockloff, M., & Rose, J. (2017). A typical problem gambler affects six others. International Gambling Studies,17(2), 276–289.
Jeffrey, L., Browne, M., Rawat, V., Langham, E., Li, E., & Rockloff, M. (2019). Til debt do us part: Comparing gambling harms between gamblers and their spouses. Journal of Gambling Studies,35(3), 1015–1034.
Kreitman N. (1986). Alcohol consumption and the preventive paradox.British Journal of Addiction,81, 353–363.
Langham, E., Thorne, H., Browne, M., Donaldson, P., Rose, J., &
Rockloff, M. (2016). Understanding gambling related harm: A proposed definition, conceptual framework, and taxonomy of harms.BMC Public Health,16(1), 80.https://doi.org/10.1186/
s12889-016-2747-0.
Ledgerwood, D. M., & Petry, N. M. (2006). What do we know about relapse in pathological gambling? Clinical Psychology Review,26(2), 216–228.
Lesieur, H. R., & Blume, S. B. (1987). The South Oaks gambling screen (SOGS): A new instrument for the identification of pathological gamblers.American Journal of Psychiatry,144(9), 1184–1188.https://doi.org/10.1176/ajp.144.9.1184.
Lesieur, H.R., & Blume, S. B. (1993). Revising the South Oaks gambling screen in different settings. Journal of Gambling Studies,9(3), 213–223.https://doi.org/10.1007/BF01015919.
Li, E., Browne, M., Rawat, V., Langham, E. & Rockloff, M. (2016).
Breaking bad: Comparing gambling harms among gamblers and affected others.Journal of Gambling Studies,33(1), 223–
248.https://doi.org/10.1007/s10899-016-9632-8.
McMahon, N., Thomson, K., Kaner, E., & Bambra C. (2019). Ef- fects of prevention and harm reduction interventions on gambling behaviours and gambling related harm: An umbrella review. Addictive Behaviors 90, 380–388. https://doi.org/10.
1016/j.addbeh.2018.11.048.
O’Dwyer, C., Mongan, D., Millar, S.R., Rackard, M., Galvin, B., Long, J. et al. (2019). Drinking patterns and the distribution of alcohol-related harms in Ireland: Evidence for the prevention paradox.BMC Public Health 19, 1323.https://doi.org/10.1186/
s12889-019-7666-4.
R Core Team (2019). R: A language and environment for statistical computing. Vienna, Austria: R Foundation for Statistical Computing. URL:httpss://www.R-project.org/.
Raisamo, S. U., M€akel€a, P., Salonen, A. H. & Lintonen, T.P. (2015).
The extent and distribution of gambling harm in Finland as assessed by the Problem Gambling Severity Index. The Euro- pean Journal of Public Health,25(4), 716–722.
Rawat, V., Browne, M., Bellringer, M., Greer, N., Kolandai- Matchett, K., & Rockloff, M., et al. (2018). A tale of two countries: Comparing disability weights for gambling problems in New Zealand and Australia.Quality of Life Research,27(9), 2361–2371.https://doi.org/10.1007/s11136-018-1882-8.https://
link.springer.com/article/10.1007/s11136-018-1882-8.
Romelsj€o, A., & Danielsson, A. K. (2012). Does the prevention paradox apply to various alcohol habits and problems among Swedish ad- olescents?.The European Journal of Public Health,22(6), 899–903.
Salonen, A., Castren, S., Latvala, T., Heiskanen, M., & Alho, H.
(2017). Rahapelikysely 2016: Rahapelaaminen, rahapelihaitat
jarahapelien markkinointiin liittyv€at mielipiteet rahape- liongelmaan apua hakevien Peliklinikan asiakkaiden n€ak€okulmasta. [Gambling Harms Survey 2016. Gambling, gambling-related harm and opinions on gambing among Gambling Clinic clients]. Helsinki, Finland: National Institute for Health and Welfare (THL). Report 8/2017.
Salonen, A. H., Hellman, M., Latvala, T., Castren, S. (2018) Gambling participation, gambling habits, gambling-related harm, and opinions on gambling advertising in Finland in 2016.
Overview.Nordic Studies on Alcohol and Drugs,2, 1–10.https://
doi.org/10.1177/1455072518765875.
Salonen, A., Latvala, T., Castren, S., Selin, J., & Hellman, M. (2017).
Rahapelikysely 2016: Rahapelaaminen, rahapelihaitat ja raha- pelien markkinointiin liittyv€at mielipiteet Uudellamaalla, Pir- kanmaalla ja Kymenlaaksossa. Helsinki, Finland. [Gambling Harms Survey 2016. Gambling, gambling-related harm and opinions on gambling marketing in Uusimaa, Pirkanmaa and Kymenlaakso]: National Institute for Health and Welfare.
(THL). Report 9/2017.
Salonen, A., Lind, K., Castren, S., Lahdenkari, M., Kontto, J., Selin, J. et al. (2019). Rahapelaaminen, rahapelihaitat ja rahapelien markkinointiin liittyv€at mielipiteet kolmessa maa- kunnassa: Rahapelikyselyn 2016-2017 perustulokset yksinoikeusj€arjestelm€an uudistuksessa. Helsinki: Terveyden ja hyvinvoinnin laitos (THL). Raportti 4/2019.
Salonen, A. H., & Raisamo, S. (2015). Suomalaisten rahapelaami- nen 2015. Rahapelaaminen, rahapeliongelmat ja rahapelaa- miseen liittyv€at asenteet ja mielipiteet 15–74-vuotiailla [Finnish gambling 2015. Gambling, gambling problems, and attitudes and opinions on gambling among Finns aged 15–74]. Helsinki:
National Institute for Health and Welfare (THL). Report 16/
2015.
Shannon, K., Anjoul, F., & Blaszczynski, A. (2017). Mapping the proportional distribution of gambling-related harms in a clin- ical and community sample. International Gambling Studies, 17(3), 366–385. https://doi.org/10.1080/14459795.2017.
1333131.
Silvennoinen, I., R€anninranta, R., & Vuorento, H. (2019). Peluurin vuosiraportti 2018. [Annual report of the national helpline Peluuri]. Helsinki: Peluuri.
Spurling, M. C., & Vinson, D. C. (2005). Alcohol-related injuries:
Evidence for the prevention paradox. The Annals of Family Medicine,3(1), 47–52.httpss://doi.org/10.1370/afm.243.
The Economist. (2017). The world’s biggest gamblers: Daily Chart.
February 9th, 2017. httpss://www.economist.com/graphic- detail/2017/02/09/the-worlds-biggest-gamblers.
Williams, R. J., & Volberg, R. A. (2010) Best practices in the population assessment of problem gambling. Guelph: Ontario Problem Gambling Research Centre.
Williams, R., & Volberg, R. (2014). The classification accuracy of four problem gambling assessment instrument in population research.International Gambling Studies,14(1), 15–28.https://
doi.org/10.1080/14459795.2013.839731.
Williams R., Volberg R., & Stevens R. (2012) The population prevalence of problem gambling: Methodological influences, standardized rates, jurisdictional differences, and worldwide trends. Report prepared for the Ontario Problem Gambling Research Centre and the Ontario Ministry of Health and Long Term Care; 2012: 1–273.
Williams, R. J., West, B. L., & Simpson, R. I. (2012). Prevention of problem gambling. A comprehensive review of the evidence, and identified best practices. Report prepared for the Ontario Problem Gambling Research Centre and the Ontario Ministry of Health and Long Term Care. October 1, 2012.
Open Access statement.This is an open-access article distributed under the terms of the Creative Commons Attribution-NonCommercial 4.0 International License (https://creativecommons.org/licenses/by-nc/4.0/), which permits unrestricted use, distribution, and reproduction in any medium for non-commercial purposes, provided the original author and source are credited, a link to the CC License is provided, and changes–if any–are indicated.