1Laboratory of Neuronal Network and Behavior, Institute of Cognitive Neuroscience and Psychology, Research Center for Natural Sciences, Budapest, Hungary. 2Roska Tamás Doctoral School of Sciences and Technology, Faculty of Information Technology and Bionics, Pázmány Péter Catholic University, Budapest, Hungary. 3János Szentágothai Doctoral School of Neurosciences, Semmelweis University, Budapest, Hungary. 4Doctoral School of Psychology, Cognitive Sciences, Budapest University of Technology and Economics, Budapest, Hungary. 5Faculty of Information Technology and Bionics, Pázmány Péter Catholic University, Budapest, Hungary. 6Comparative Psychophysiology Research Group, Institute of Cognitive Neuroscience and Psychology, Research Center for Natural Sciences, Budapest, Hungary. 7Department of Neurobiology, Weizmann Institute of Science, Rehovot, Israel. 8Department of Anatomy and Histology, University of Veterinary Medicine, Budapest, Hungary. 9These authors contributed equally: Boglárka Barsy, Kinga Kocsis.
✉e-mail: matyas.ferenc@ttk.mta.hu
E nvironmental cues that become affectively salient during learning must be processed with high efficacy to promote adaptation and survival. However, the circuit mechanisms for evolutionarily conserved and subconscious processing of these stimuli have not yet been fully established. The LA is considered to be the key brain region that processes associative fear memories by coupling a neutral sensory cue (a CS; for example, tone) with an affective (unconditioned) stimulus (US; for example, foot shock) during fear learning1–3. This association then drives the formation of a memory about the CS via synaptic changes in the LA
4. As a consequence, the presentation of the same CS at a later time point elicits consistent fear responses. Contrary to current models, the source of the CS and US signals driving the memory processes are still unknown, and convincing evidence for signal association in the LA is lacking
5,6.
Given that in vivo recordings suggest that CS-related informa- tion reaches the amygdala with a short latency (<20 ms)
7, this pro- cess requires fast, probably subcortical, inputs to the LA. LT regions, namely the posterior intralaminar (PIL) and suprageniculate (SG) thalamic nuclei as well as the medial and dorsal parts of the medial geniculate thalamic nucleus (MGN (also called the medial geniculate body)), form direct functional connections with the LA
8. However, because the medial part of the MGN (MGM) is part of the auditory thalamus, LT input to the LA is traditionally accepted as the major source of auditory CS
7,9. Nevertheless, lesioning of these thalamic areas yielded contradictory findings regarding fear learning
9–11.
The source of US information in the LA that temporally matches the CS signal is also debated. Neurons in the parabrachial nucleus (PB)
12and periaqueductal gray (PAG)
13,14are activated by a US and affect fear learning. However, these nuclei cannot provide the LA with the short-latency US signal that is necessary for signal association
(10–20 ms)
7, which is due to the lack of monosynaptic connections between the PB, PAG and the LA. The dorsomedial thalamic nuclei, including the paraventricular thalamus, can control fear memory formation and retrieval
15,16by encoding arousal information
17and stimulus salience
18. Yet, this medial thalamic population mostly tar- gets the basal amygdala (BA) and the central amygdala (CeA) and not the LA. Thus, it is still unclear how fast sensory (CS and US) input arrives to the LA and triggers association-driven learning.
Alternatively, the LA could receive US-related information directly from the above-mentioned lateral thalamic regions, which potentially convey a CS
19,20. Although thalamic integration of a CS and a US was previously hypothesized
5, it has been mostly over- looked. Nevertheless, there is evidence to indicate that plasticity induced by auditory fear conditioning is present in these lateral thalamic regions
5,21.
On the basis of an anatomical exploration of direct midbrain inputs that predicted the responsiveness of these LT cells to audi- tory, visual and somatosensory signals
22,23, our aim was to assess whether the LT is able to integrate CS and US signals before the LA and transfer the association to its targets. In this study, we inves- tigate the cellular origin, the modality of the encoded signal, the effector mechanism and the behavioral effects of LT projection to the LA during associative fear-learning in mice. Using a com- bination of cell-type-specific anatomical, optogenetic and in vivo electrophysiological approaches in an auditory fear-learning para- digm, we identified a direct glutamatergic LT pathway to the LA originating from Calr
+LT cells. These cells can form short-latency (<20 ms) CS–US associations upstream from the LA. This ability emerges from the ensemble of collicular, PAG and spinal trigeminal inputs that carry information about sensory and valence features of the environment. The Calr
+LT route transfers this associative
Associative and plastic thalamic signaling to the lateral amygdala controls fear behavior
Boglárka Barsy
1,9, Kinga Kocsis
1,2,9, Aletta Magyar
1,3, Ákos Babiczky
1,4, Mónika Szabó
1,3, Judit M. Veres
1, Dániel Hillier
5,6, István Ulbert
5,6, Ofer Yizhar
7and Ferenc Mátyás
1,8✉
Decades of research support the idea that associations between a conditioned stimulus (CS) and an unconditioned stimulus
(US) are encoded in the lateral amygdala (LA) during fear learning. However, direct proof for the sources of CS and US infor-
mation is lacking. Definitive evidence of the LA as the primary site for cue association is also missing. Here, we show that
calretinin (Calr)-expressing neurons of the lateral thalamus (Calr
+LT neurons) convey the association of fast CS (tone) and US
(foot shock) signals upstream from the LA in mice. Calr
+LT input shapes a short-latency sensory-evoked activation pattern of
the amygdala via both feedforward excitation and inhibition. Optogenetic silencing of Calr
+LT input to the LA prevents auditory
fear conditioning. Notably, fear conditioning drives plasticity in Calr
+LT neurons, which is required for appropriate cue and con-
textual fear memory retrieval. Collectively, our results demonstrate that Calr
+LT neurons provide integrated CS–US representa-
tions to the LA that support the formation of aversive memories.
signal monosynaptically and effectively to the LA and to a newly identified GABAergic amygdala population. By driving a complex intra-amygdala activity pattern, Calr
+LT cells play an instrumental role in the establishment of CS+US signals and the formation of fear memories in the LA. Furthermore, these thalamic cells alter their activity during memory trace formation and can discriminate between US-paired and unpaired signals during retrieval. Together, our study indicates that the LT pathway to the amygdala, composed of Calr
+LT neurons, provides associated and plastic signals for the acquisition of cue-related fear behavior.
results
Calr+LT cells project to the LA and are activated during fear learning. First, we identified which thalamic populations are con-
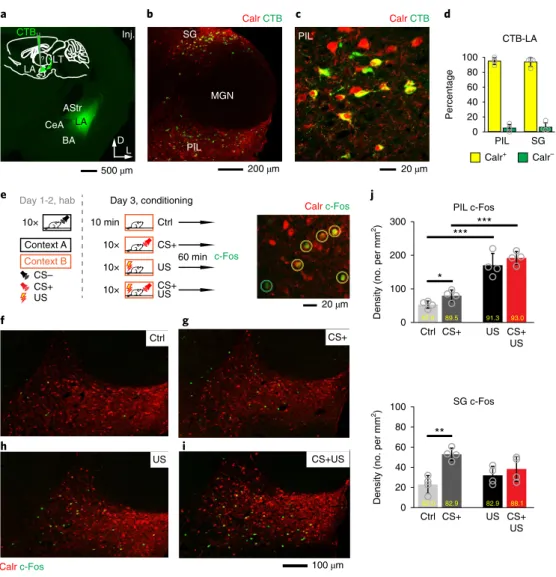
nected to the LA. Thalamic cells retrogradely labeled from the LA with cholera toxin B subunit (CTB; Fig. 1a–c) were mainly located around the auditory thalamus (the MGN) in the PIL and the SG regions (Fig. 1b; Supplementary Fig. 1a–c). Since Calr
+cells were specifically abundant in these lateral thalamic regions (Fig. 1b;
Supplementary Fig. 1), we analyzed the Calr content of the CTB- labeled cells. The majority of them expressed Calr (Fig. 1c,d), which indicates that the thalamo–LA pathway is primarily formed by Calr
+PIL and SG populations, hereafter collectively referred to as Calr
+LT neurons (Supplementary Information).
Next, we used an activity-dependent immediate early gene assay to investigate the involvement of the Calr
+LT neurons in transferring CS and/or US signals during fear learning (Fig. 1e;
Supplementary Fig. 2). Expression of the immediate early gene c-Fos was analyzed in four groups of mice that received either a condi- tioning tone (7.5 kHz, 30 s; CS+) or a US (foot shock, 1 mA, 1 s; US), or a US-associated tone (CS+US). Naive mice were used as controls.
While CS+ markedly increased c-Fos expression in the PIL and SG areas, US and CS+US further increased the number of activated neurons in the PIL region relative to what was observed in control mice (Fig. 1f–j; Supplementary Table 1). Since the majority of c-Fos- labeled cells were also Calr
+(Fig. 1j; Supplementary Table 2), it was concluded that the LA can receive all relevant sensory information necessary for associative learning from Calr
+LT cells.
Calr+LT cells transfer short-latency signals related to fear learn- ing. The expression of c-Fos provided spatially precise data about
the cellular origin of CS, US and CS+US information (Fig. 1) for the LA. However, it did not reveal whether these neurons can convey and integrate a CS and a US within a short time window
19and supply the LA with a salient cue within 20 ms
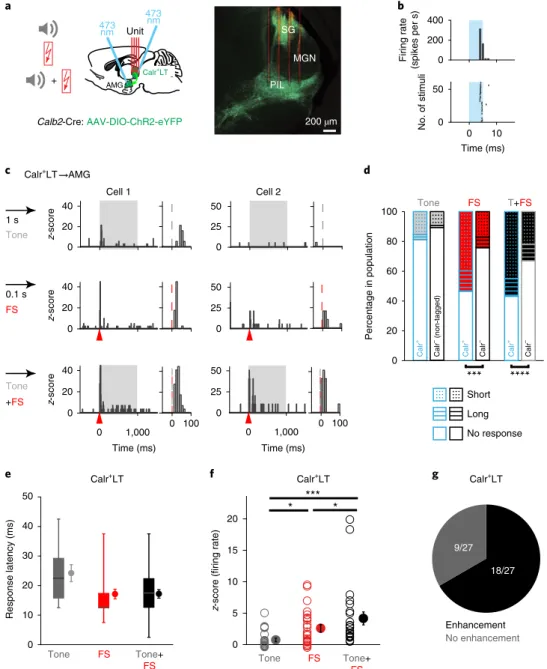
7. Thus, we performed extra- cellular in vivo recordings from Calr
+LT cells to investigate the time course of activation to short tone and footshock stimuli, as well as their possible potentiation to an associated footshock-coupled tone.
Calb2-Cre mice (Calb2 encodes Calr; Supplementary Fig. 1k–n)
were injected with conditional Cre-dependent recombinant adeno- associated virus (AAV) expressing Channelrhodopsin 2 (ChR2);
this model allowed us to optogenetically identify Calr
+LT cells in an orthodromic and amygdala-projecting cells (Calr
+LT→AMG) in an antidromic manner (Fig. 2a,b; n
= 10 mice; N = 60 cells Calr+; N = 42 cells identified as Calr
+LT→AMG;
N = 247 non-tagged, putativeCalr
–LT cells, including those located in the MGN). Single LT neu- rons showed activation to tone, footshock and/or tone+footshock signals with primarily short (5–50 ms; N
= 32 out of 37 tone-responsive cells; N = 61 out of 85 footshock-responsive cells; N = 81 out of 115 tone+footshock-responsive cells) but also with long (50–500 ms) (Fig.
2c–e; Supplementary Fig. 3; SupplementaryTables 3 and 4) latencies, indicating direct subcortical and broader network-involving sensory effects, respectively.
Significantly more Calr
+LT neurons were activated by foot shock and associative stimuli than Calr
–cells (Fig. 2d). Furthermore, foot shock and footshock-associated tone stimuli activated significantly
more Calr
+cells (including Calr
+LT→AMG) than tone alone (Supplementary Tables 3 and 5), which is consistent with our c-Fos data (Fig. 1j). Multisensory enhancement was also present in the majority of Calr
+LT cells (18 out of 27), resulting in a larger short-latency activation to footshock-associated tone stimuli at the population level compared with unimodal tone or footshock cues (Fig.
2f,g). The majority of the enhanced cells (15 out of 18) didnot show a unimodal response to tone, which suggests that auditory stimulation mostly evoked subthreshold activation in Calr
+LT neu- rons. Still, this could further potentiate the footshock signals. These data provide direct evidence to indicate that association of tone and foot shock can already take place at the level of the thalamus, before the amygdala. This associative signal drives the strongest short- latency activation (~17 ms on average) of Calr
+LT neurons, and this information is directly transferred to the amygdala.
The brainstem inputs to Calr+LT neurons. Next, we investigated
the possible upstream origins of the direct, short-latency cue- evoked signals to Calr
+LT cells using mono-trans-synaptic rabies tracing. To this end, we injected Cre-dependent helper virus and G-protein-deleted rabies virus (rabiesΔG) into the LT of Calb2- Cre mice (Fig. 3a–c). Calr
+LT neurons received major inputs from trans-synaptically labeled neurons in the inferior colliculus (IC) and the superior colliculus (SC) (Fig. 3d,f). The rabies-labeled neurons in the IC were preferentially located in the external and dorsal mul- tisensory layers
24and were sparsely distributed in primary auditory central regions (Fig. 3d). In the SC, the visual ‘wide field’ neurons in the superficial and the multisensory neurons in the intermedi- ate and deep layers were similarly infected
25(Fig. 3f). In addition, rabies-labeled cells were found in the PAG (Fig. 3e) and in the prin- cipal sensory trigeminal nucleus (Pr5) in lower quantities (Fig. 3g).
Neurons in these locations can transfer monosynaptic and short- latency activation for auditory (IC), visual (SC) and nociceptive (SC, PAG and Pr5) cues
23,26to the Calr
+LT cells.
To confirm the monosynaptic glutamatergic innervation of Calr
+LT neurons from the IC and the SC, we injected Cre-dependent enhanced yellow fluorescent protein (eYFP)-expressing AAV into the IC or SC of vGlut2-Cre mice (Fig. 3h,i,q,r). Transduced excitatory IC neurons (Fig. 3i) formed two types of synaptic connections in the LT
27(Fig. 3j): large-sized axon terminals (~3–5 µm in diameter) were distributed in the Calr
–MGN region (Fig. 3k,l), whereas small bou- tons (~1
µm) targeted the regions of Calr+LT neurons (Fig. 3m–o).
The existence of synaptic contact between the IC input and the Calr
+LT cells was confirmed by electron microscopy (Fig. 3p).
Glutamatergic SC neurons sent axon terminals exclusively to Calr
+LT territories (Fig. 3s,t) and formed asymmetrical synapses with Calr
+elements (Fig. 3u–w). Altogether, these anatomical data provide further support that Calr
+LT cells integrate fast sensory and associated (tone+footshock) signals that originate from the brain- stem and transfer these to the LA during fear conditioning.
Calr+LT inputs target fear-learning-activated amygdala subnuclei.
Next, we investigated the targets of Calr
+LT neurons in the amygdala.
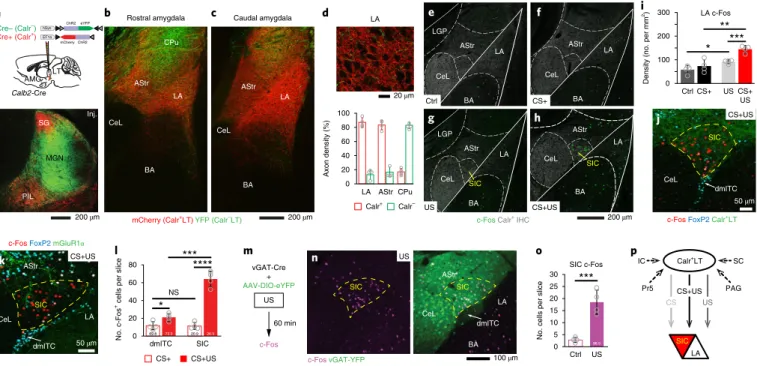
Using a novel viral strategy, we simultaneously transduced Calr
+and Calr
–populations in the LT of Calb2-Cre mice with a mixture of two AAVs. One transduced the Calr
+LT cells in a Cre-dependent man- ner with mCherry, while the other labeled only Cre
–cells with eYFP (Fig.
4a). The majority of the lateral thalamic inputs in the LA wascomposed of mCherry-labeled Calr
+LT axons (~85%; Fig. 4b–d).
Together with our retrograde tracing (CTB) data (Fig. 1), we con- cluded that Calr
+LT cells provide the major thalamic input to the LA.
In addition, the centromedial (CeM) and the basomedial amygdala (BMA) also received Calr
+LT inputs (Supplementary Fig. 4a).
Just as selective activation of Calr
+LT cells was found dur-
ing fear conditioning, an elevated c-Fos activation pattern was
observed in the Calr
+LT-innervated amygdala regions, including
the LA, the CeM and the BMA (Fig. 4e–i; Supplementary Fig. 4b;
Supplementary Table 6a,b). Notably, the strongest c-Fos activation was found in a previously unspecified region dorsal to the dorsome- dial intercalated cell mass of the amygdala (dmITC) (indicated by yellow arrows in Fig. 4g,h). Neurons in this region, hereby named supra-intercalated cluster of neurons (SIC), also received Calr
+LT input (Fig. 4j). However, the majority of these cells did not express either mGluR1α or FoxP2 (Fig. 4k,l), which are characteristic of the noxious-stimulus-activated ITC
28. To identify their neurotransmit- ter profile, we transduced all GABAergic neurons in this region with a Cre-dependent eYFP-encoding AAV in vGat-Cre mice. After recovery, mice were exposed to foot shock (US) (Fig. 4m), which greatly increased c-Fos expression in SIC (Fig. 4n). The majority of the c-Fos
+cells were co-labeled with YFP (Fig. 4n,o), which sug- gests that a previously unidentified GABAergic population in the
amygdala, the SIC, dominates in noxious sensory processes via Calr
+LT inputs (Fig. 4p).
Calr+LT inputs strongly shape the activity of LA and SIC neu- rons. To test the functional impact of Calr+
LT innervation on the LA and the SIC, we transduced Calr
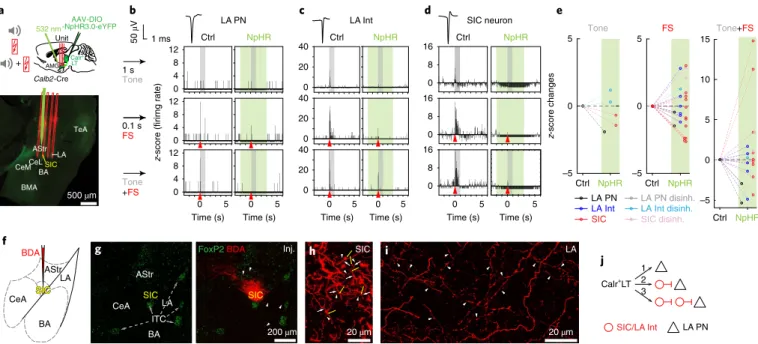
+LT neurons with a Cre- dependent halorhodopsin (NpHR3.0)-expressing AAV and per- formed in vivo extracellular recordings from the amygdala (Fig. 5a;
see Methods). Optogenetic inhibition of Calr
+LT→AMG axons significantly decreased or increased the spontaneous firing of a subset of neurons. These modulations were present among both the principal and putative GABAergic neurons of the LA as well as the SIC (Supplementary Fig. 5a–e), which demonstrates that there are Calr
+LT-driven feedforward excitatory and inhibitory mecha- nisms in the LT–amygdala pathway. In addition, we investigated the
j
0 20 40 60 80 100 0 100 200 300
Density (no. per mm2)Density (no. per mm2)
*
*** ***
**
Ctrl CS+ US CS+
US PIL c-Fos
SG c-Fos
82.0 82.9
87.8 89.5 91.3 93.0
82.9 88.1
Ctrl CS+ US CS+
US
e
c
a b Calr CTB
CTB-LA
Calr+ Calr–
d
0 20 40 60 80 100
PIL SG
Percentage
20 µm 500 µm
AStr CeA
BA LA
200 µm MGN SG
PIL Inj.
Calr CTB
DL
PIL
60 min c-Fos 10 min
Day 1-2, hab Day 3, conditioning
CS–
CS+
US
Ctrl CS+
US CS+US
Calr c-Fos 100 µm
f g
h i
CS+US Ctrl CS+
US LA? LT
20 µm Calr c-Fos 10×
10×
10×
10×
Context B Context A CTB
Fig. 1 | calr+Lt cells project to the LA and are activated by cS, US and US-associated cS stimuli. a, A retrograde tracer, CTB (green) injection (Inj.) site restricted to the LA. Inset: experimental design for identifying the source of thalamic inputs to the LA (green arrow and question mark). Arrows in the right corner indicate the dorsal (D) and lateral (L) orientation of the coronal section. b, Retrogradely labeled LA-projecting cells (CTB-LA) are dominantly present in the Calr-labeled (red) PIL and SG regions. Also see Supplementary Fig. 1. c, CTB-LA cells (green) expressing Calr+ in the PIL region. d, The majority of CTB-LA cells are Calr+ in both the PIL and SG nuclei (n = 4 mice; PIL + SG, NCTB = 180, 572, 103 and 255 cells, NCalr+CTB = 167, 563, 93 and 243 cells, Calr + CTB/all CTB, 94.2 ± 3.48% total). e, Left: schematic of the behavioral protocol using four groups of mice to identify the fear- conditioning-induced neuronal activation in the LT. Hab, habituation. Right: a high-magnification confocal image showing c-Fos activation (green) in the LT counterstained against Calr (red). Yellow circles highlight Calr+c-Fos+ double-labeled LT cells, while the green circle indicates a c-Fos+Calr– cell.
f–i, Representative images showing the density of c-Fos+ cells in a control (Ctrl), tone only (CS+), footshock only (US) and CS + US cases. j, c-Fos density in the PIL and SG regions. Open circles indicate individual mouse data;, yellow numbers in the graphs represent the proportion of Calr+c-Fos+ cells. Data in d and j are shown as the mean ± s.d.; two-sided t-test. Images in a–c and e–i are representative of n = 4 mice. See also Supplementary Tables 1 and 2 for further data and Supplementary Table 5 for statistical details. *P < 0.05; **P < 0.01; ***P < 0.001.
contribution of Calr
+LT cells to the sensory activation of amygdala neurons. Similar to Calr
+LT neurons, more LA cells and SIC were activated by foot shock and footshock-associated tone than to tone alone
29(Fig. 5b–d; Supplementary Fig. 5h; Supplementary Table 7).
Within the LA, more interneurons than principal cells were acti- vated by the CS+US signal (Fig. 5e; Supplementary Fig. 5f–h;
Supplementary Table 7). Most of them exhibited short- latency responses (~20 ms on average; Supplementary Fig. 5g;
Supplementary Table 4). The time course of evoked responses in Calr
+LT cells and the amygdala (2–3 ms difference in latency) also suggested that short-latency amygdala activation is derived directly from the Calr
+LT cells. Indeed, optogenetic silencing
200 µm SG
PIL MGN Calr+LT
AMG 473nm Unit
473nm
0 200 400
0 50 Firing rate (spikes per s) No. of stimuli
0 10
Time (ms)
a b
Calb2-Cre: AAV-DIO-ChR2-eYFP +
* ***
*
0 5 10 15 20
Tone Tone FS Tone+
FS
z-score (firing rate)
f
Response latency (ms)
0 20 40 60 80
100 Tone FS T+FS
Percentage in population Calr+ Calr– (non-tagged) Calr+ Calr– Calr+ Calr–
c
0 20 40
z-score
0 20 40
z-score
0 20 40
z-score
1,000 0
Cell 1
0 100
****
***
Short
No response Long
e g Calr+LT
Enhancement No enhancement
9/27 18/27 Calr+LT AMG
25 50
Cell 2
0 25 50
1,000 0 0 25 50
0 100 0
d
Time (ms) Time (ms)
1 s Tone
0.1 s FS
Tone +FS
0 10 20 30 40 50
FS Tone+
FS
Calr+LT Calr+LT
Fig. 2 | Selective and fast aversive cue-associated sensory signaling by calr+Lt cells. a, Left: schematic of in vivo unit recordings from LT cells with delivery of tone, footshock and paired tone + footshock signals (n = 10 mice). Right: a coronal section of a LT with AAV-DIO-ChR2-infected Calr+ cells (green) and showing the trajectory of the four-shank silicon probe (red). b, Antidromic optogenetic tagging (blue) of a Calr+LT→AMG cell in the PIL. c, A Calr+LT→AMG cell (Cell 1) showing short-latency tone (gray), footshock (FS; red arrowheads) and enhanced associative tone + footshock activations. Another Calr+LT→AMG cell (cell 2) with enhanced tone + footshock activation without tone-alone response. Right: zoom-in of traces on the left highlighting the time-course of the evoked responses. Bin size, 10 ms. d, Graphs showing the relative proportions (percentage) of short-latency- evoked and long-latency-evoked responses within the Calr+LT→AMG, total Calr+LT and non-tagged LT cell populations. χ2 test. e, Population data for the estimated latencies for short-latency tone, footshock and associative tone+footshock-evoked activation of Calr+LT cells within a 5–50 ms post-stimulus time window. Horizontal lines in box plots indicate medians, box limits indicate first and third quartiles, and vertical whisker lines indicate minimum and maximum values. Filled circles represent the mean ± s.e.m. f, Population data for average z-score of firing rate as the result of sensory stimuli in the case of Calr+LT neurons with short-latency (<50 ms) tone + footshock responses (N = 27 cells). Mean ± s.e.m. Friedman ANOVA with Wilcoxon matched-pairs test (two-sided). g, Proportion of multisensory enhancement (augmented tone+footshock signal) in the same cells as in f. ***P < 0.001; ****P < 0.0001. All results from the in vivo acute thalamic electrophysiology data analysis are summarized in Supplementary Tables 3 and 4; details of statistical analyses are provided in Supplementary Table 5.
of Calr
+LT→AMG axons significantly affected the responses of LA neurons and SIC evoked by tone, foot shock or associated tone+footshock (Fig. 5b–e; Supplementary Fig. 5h; Supplementary Table 7). In addition to the inhibited responses, many LA neurons and SIC enhanced their evoked activation (Fig. 5e; Supplementary Fig. 5f). Furthermore, some neurons only showed activation to sen- sory stimuli during Calr
+LT→AMG optogenetic silencing, which also indicated the presence of a strong thalamic-driven disinhibi- tory mechanism in the amygdala (Fig. 5e; Supplementary Fig. 5h;
Supplementary Table 7).
There are multiple candidates for executing these inhibitory and disinhibitory actions in the amygdala. Since SIC send axon collater- als to other SIC as well as to LA cells (Fig. 5f–i), this population could be equally involved in the feedforward inhibitory and disinhibitory thalamic effects, similar to the ITC and local LA interneurons
30–33(Fig. 5c–e; Supplementary Fig. 5f,h). These results demonstrate that multimodal and associated signals carried by Calr
+LT inputs can control the activity patterns of the amygdala in a complex manner:
directly via feedforward excitation and feedforward inhibition as well as indirectly through the disinhibition of principal neurons via the activation of SIC and local interneurons (Fig. 5j).
The Calr+LT→AMG pathway is essential for fear learning. Next,
we examined the behavioral effects of the Calr
+LT→AMG pathway with optogenetic axonal silencing. Calb2-Cre mice were bilaterally injected in the LT with Cre-dependent AAV-DIO-NpHR-eYFP or AAV-DIO-eYFP (as control) and implanted with optic fibers above the amygdala (Fig. 6a–c; Supplementary Fig. 6a). Green light (532 nm) illumination of Calr
+LT→AMG axons had no effect on spontaneous behavior in a novel environment (open field;
Supplementary Fig. 6b). Next, we tested the effects of this optoge- netic manipulation on behavior during a discriminative fear-con- ditioning paradigm. Mice were habituated to the non-conditioned tone (CS–, white noise) for 2 days. On day 3, the conditioned tone (CS+, 7.5 kHz) was terminated with foot shock (US) and paired with optogenetic silencing (for the entire period of the 30 s of CS+).
This conditioning protocol developed acute freezing behavior in control animals (YFP), but resulted in a significantly lower freez- ing level in NpHR mice (Fig. 6d; Supplementary Video 1). As our intervention kept most pain pathways intact
34, the observed differ- ence in the level of freezing behavior between YFP and NpHR mice can be better explained by an impairment in fear learning than by a disruption of nociceptive signaling because of the presence of foot- shock-induced escape behavior (jumping; Supplementary Video 1) and vocalizations (Supplementary Fig. 6d). On day 4, in cued fear- memory retrieval, CS– and CS+ presentations evoked decreased
levels of freezing in the NpHR mice relative to the YFP group (Fig. 6e; Supplementary Video 2), and this effect was accompanied by a lack of cue discrimination. On day 5, contextual freezing was also lower in NpHR mice (Fig. 6f). The greatly reduced freezing behavior during the retrieval days (days 4 and 5) suggests that there is a deficit in fear memory linked to the conditioning environment (cue and context).
Cued and contextual freezing behavior of the NpHR mice was indistinguishable from those of the non-shocked YFP animals, which only received the CS during the conditioning phase (CS-only YFP group). To test whether the NpHR animals had a similar behav- ioral phenotype to the CS-only YFP animals, on day 8, we placed the animals in a novel stressful situation on an elevated plus-maze (EPM) apparatus. The EPM assay allowed us to simultaneously monitor anxiety level and risk assessment. Five days after conditioning, the NpHR mice showed a similar ratio of closed-arm versus open-arm time and total-arm entries to the non-shocked mice (Supplementary Fig. 6e). Risk assessment (as indicated by the animal exhibiting the defensive stretch–attend posture) and grooming behavior of NpHR mice were also comparable to the CS-only YFP mice, but signifi- cantly different from the YFP group (Fig. 6g,h). These data collec- tively show that the general aversive state of NpHR mice was similar to the non-shocked controls, and suggest that optogenetic silencing of Calr
+LT→AMG input prevented both short-term and long-term behavioral consequences of fear acquisition.
In a separate group of animals, short optogenetic silencing of the Calr
+LT→AMG axons, only during the last 5 s of CS+ presentation, including the US, resulted in similar behavioral changes as silenc- ing the entire 30-s conditioning phase (Supplementary Fig. 6f–j).
This shows that preventing the associative CS+US information flow alone was sufficient to disrupt fear memory processes.
In addition to the impaired contextual fear response in NpHR mice (Fig. 6f), inhibition of Calr
+LT→AMG axons during contex- tual fear retrieval in a separate cohort of mice decreased contextual freezing behavior (Supplementary Fig. 6k–m). This indicates that Calr
+LT neurons also transfer visual and multisensory information arising from collicular inputs (Fig. 3), which may contribute to con- textual coding in affective behavior. Thus, information carried by the Calr
+LT→AMG pathway during fear conditioning is essential for the development of adaptive cued and contextual fear memory.
Fear-learning-induced plasticity in Calr+LT→AMG neurons.
Thalamic cells spatially matching Calr
+LT neurons can undergo plasticity as a result of fear conditioning
5,21. To clarify whether the activity of Calr
+LT cells shows experience dependency in auditory fear learning, we analyzed their immediate early gene expression
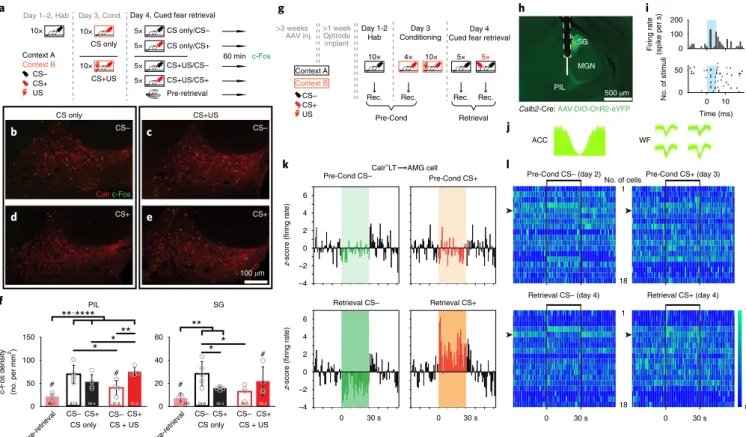
Fig. 3 | Monosynaptic brainstem inputs to calr+Lt neurons. a, Experimental design for rabies-mediated trans-synaptic tracing from Calr+LT cells.
b, Example confocal image illustrating AAV-FLEX-TVA-eGFP-oG (helper) and rabies(ΔG)-EnvA-mCherry-labeled (rabies) cells in the PIL and the SG nuclei after injections depicted in a. c, High-magnification confocal images showing rabies-labeled (red) and helper-labeled (green) neurons in the PIL. Starter cells transduced by both the helper and rabies viruses are outlined with a dashed line. Asterisks indicate double-negative cells. d–g, Example confocal images showing rabies(ΔG)-mCherry-labeled cells in the IC (dorsal, external and central (DIC, EIC and CIC, respectively); d), in the PAG (e), in the SC (superficial, intermediate and deep (sSC, iSC and dSC, respectively) layers; f) and in the Pr5 (g). Aq, aqueduct; 7n, facial nerve. h, Schematic drawing for AAV-DIO-eYFP injections into the IC of vGlut2-Cre mice. i, Image of a representative injection site in the IC. j, IC inputs (YFP, green) to LT co-stained for Calr (red). White framed areas for the MGN are enlarged in k and l and for the PIL in m–o. k,l, A representative high-magnification Z-stack confocal image (7 µm total in depth) from the MGN (Calr–; k) illustrating large-sized IC axon terminals (white arrowheads; l). m–o, A representative high-magnification Z-stack confocal image (7 µm total in depth) from PIL (m; co-stained for Calr shown in n) illustrating small-sized IC axon terminals (white arrowheads; o) in close apposition with the Calr+ PIL cells (o). p, An electron micrograph showing an immunogold-labeled Calr+ dendrite (dCalrþ
I ; covered by small black particles, area shaded with pink) in the PIL receiving an asymmetrical synaptic contact (black arrowhead) from a DAB-labeled (diffuse black precipitate) vGluT2+ IC axon terminal (ICvGluT2þ
I ; shaded green). q, Schematic for AAV-DIO-eYFP injections into the SC of vGlut2-Cre mice. r, Image of a representative injection site in the SC targeting the sSC and the iSC. s, SC inputs (YFP, green) to the LT co-stained for Calr (red). t, A representative high-magnification Z-stack confocal image (7 µm total in depth) with vGluT2+ SC axon terminals (white arrowheads) in close proximity to Calr+ PIL neurons (red).
u–w, Electron micrographs showing immunogold-labeled Calr+ dendrites (dCalrþ
I ; u,v) and a spine (spCalrþ
I ; w) in the PIL receiving asymmetrical synaptic contacts (black arrowheads) from DAB-labeled, vGluT2+ SC axon terminals (SCvGluT2þ
I ). A non-stained axon terminal outlined with a dashed line (u) also gives synaptic input onto the Calr+ dendrite. Images in b–g, i–p and r–w are representative of n = 3 mice.
a
AAV-FLEX-TVA-eGFP-oG Rabies(ΔG)-EnvA-mCherry
LT Calb2-Cre
200 µm Rabies Helper
b
200 µm
g
Pr5 7n
200 µm
f
Aq
sSC
iSC
PAG dSC
**
*
*
* *
*
*
**
*
*
Helper
Rabies
Overlay
c
20 µm 200 µm
Rabies
d
CIC EIC DIC
Aq PAG
500 µm
e
SG
PIL
MGN
Rabies Rabies
500 µm
i
10 µm
o
LT vGlut2-Cre
IC
200 µm
h
j SG
PIL MGN
10 µm
k
AAV-DIO-eYFP
Calr YFP
l
m
n
CIC EIC DIC
PIL
PIL MGN
MGN PIL
PAG
p
200 nm dCalr+
ICvGluT2+
vGlut2-Cre LT
q SC
10 µm
t
500 µm
r
s
200 µm SG
PIL MGN AAV-DIO-eYFP
Calr YFP
sSC iSC
PAG dSC
u
v w
200 nm 200 nm
500 nm
dCalr+
dCalr+
spCalr+ SCvGluT2+
SCvGluT2+
SCvGluT2+
PIL
(see Methods) after the cued fear-retrieval phase. Two groups of mice were used in the conditioning phase: one group received CS+US and the other group received CS+ only (CS only). During cued fear retrieval, mice in both groups were presented with either CS– or CS+. The retrieval phase was omitted in a third group of CS+US mice (pre-Retr. group) to set the baseline of c-Fos expres- sion 24 h after fear conditioning (Fig. 7a). Tone-induced discrimina- tive fear behavior was retrieved in CS+US mice, since presentation of CS+ but not CS– resulted in elevated freezing levels. CS-only ani- mals showed no fear to either of the auditory cues (Supplementary Fig. 7a). Next, we quantified the auditory-signal-evoked c-Fos expression in the LT (Fig. 7a–f; Supplementary Tables 1 and 2). CS+
increased while CS– decreased the number of c-Fos
+neurons in the Calr
+LT region of the CS+US mice compared with the CS-only mice (Fig. 7c–f), which suggests that cue sensitivity of the Calr
+LT cell population underwent plasticity that is tightly related to the behavioral outcome.
To test the presence of learning-induced plasticity in individual Calr
+LT→AMG cells, we acquired single-unit data (N
= 18) fromchronically implanted mice throughout the 3-day-long fear- learning paradigm (Fig. 7g). Retrogradely labeled Calr
+LT→AMG cells were optogenetically identified, and their evoked responses to
auditory stimuli were monitored before fear conditioning and dur- ing cued fear retrieval (Fig. 7h–l; Supplementary Fig. 8). Activity of 9 out of 18 thalamic cells showed modulation in parallel with the for- mation of cued memory (Fig. 7k,l; Supplementary Fig. 8e,f). Fear learning prominently increased the activation of Calr
+LT→AMG neurons to CS+ (before conditioning, Pre-Cond. CS+,
N = 1 cellversus after conditioning, Retr. CS+, N = 5 cells). In addition, 6 out of 18 cells showed discriminative activity pattern during retrieval.
Together, our anatomical and electrophysiological findings indicate that the Calr
+LT→AMG pathway not only transfers associated sig- nals during fear conditioning but also its activity shows plasticity as a result of fear memory formation.
The fear-learning-induced changes in the Calr
+LT population could be responsible for the long-term modulation of amygdala circuits
29,33. Similar to the c-Fos activation pattern found in fear conditioning, fear retrieval primarily activated the Calr
+LT-cell- innervated LA and SIC, as well as the CeM and BMA (Supplementary Fig. 7b; Supplementary Table 6a,b). Interestingly, c-Fos activation induced by CS– and CS+ was similar in all amygdala regions, which is in agreement with recent c-Fos
35and imaging data
29. This obser- vation suggests that it is not the size of the amygdala population but its thalamic input characteristics that shape behavioral outcomes.
Density (no. per mm2)
i LA c-Fos
*****
Ctrl CS+ US CS+
US
l
SIC c-Fos 200 µm
a
AMG LT Calb2-Cre
200 µm Inj.
MGN SG
PIL
c b Rostral amygdala
0 20 40 60 80 100
LA AStr CPu
Axon density (%)
Caudal amygdala d LA
Calr+ Calr– 20 µm
200 µm
100 µm dmITC
LA
BA CeL
AStr SIC
c-Fos vGAT-YFP AStr
CeL
BA LA AStr
CeL
BA LA CPu
c-Fos Calr+ IHC
BA CeL
LA AStr
CS+US
e
h
c-Fos FoxP2 Calr+LT CeL
SIC
dmITC
j CS+US
c-Fos FoxP2 mGluR1α
50 µm dmITC CeL LA
SIC
k AStr
SIC
n
US 60 min c-Fos vGAT-Cre
+ AAV-DIO-eYFP
m US o
CeL AStr
BA LA LGP
Ctrl
f
CeL AStr
BA LA
CS+
*******
0 20 40 60 80
dmITC SIC
No. c-Fos+ cells per slice *
NS
50 µm
No. cells per slice
Ctrl US
***
0 5 10 15 20 25 30
96.9
69.8 73.3 20.9 26.3
CS+US
CS+ CS+US
p Calr+LT
LA SC IC
CS+US
CS US
SIC CeL
AStr
BA LA LGP
US
g
0 100 200 300
*
Pr5 PAG
ChR2eYFP hSyn
ChR2 mCherry EF1a
Cre– (Calr–) Cre+ (Calr+)
mCherry (Calr+LT)YFP (Calr–LT)
SIC SIC
Fig. 4 | calr+Lt neurons target the fear-conditioning-activated LA neurons and SIc. a, Top: schematic of selective viral labeling of Calr+LT (red) and Calr–LT cells (green). Bottom: image of the injection site in the LT. b,c, Coronal sections from two rostrocaudal planes showing distinct Calr+LT (mCherry, red) and Calr–LT (YFP, green) innervation of the amygdala with subnuclear specificity. See also Supplementary Fig. 4. d, Top: high-magnification confocal image taken from the LA. Bottom: quantification of LT axonal lengths in the LA, the AStr and the neighboring striatal region (CPu) (see also Methods).
e–h, Confocal images showing amygdala subnucleus-specific c-Fos activation (green) in a control (Ctrl; e), tone only (CS+; f), footshock only (US; g) and CS+US animal (h) during fear conditioning. This was the same experiment as in Fig. 1 (see also Supplementary Fig. 2 and Supplementary Table 6a,b).
Immunohistochemical staining against Calr (Calr+ IHC; gray) was used to outline different amygdala subregions (see also Supplementary Fig. 4a). CeL, lateral part of the CeA; LGP, lateral globus pallidus. i, Population data for c-Fos activation in the LA (n = 4 mice each). j, High-magnification confocal image from a CS + US mouse with the highest c-Fos density (red) in the SIC, which is innervated by Calr+LT→AMG axons (green). k, c-Fos activated cells (red) in the SIC are distinct from FoxP2 (cyan) or mGluR1α-expressing (green) dmITC neurons. l, Population data for the density of c-Fos+ cells in the SIC and the dmITC (n = 4 mice for each region). Numbers at the bottom of each bar indicate the proportion of FoxP2+ cells within the c-Fos-labeled dmITC and SIC. m, Experimental design to test the GABAergic nature of footshock (US)-activated SIC neurons. n, A confocal image showing US-evoked c-Fos activation (magenta, left) and the YFP transduced vGAT (green) neurons in the SIC. o, Grouped data for the density of US-activated c-Fos+ cells compared with control mice, and their colocalization with vGAT-YFP labeling in SIC (nc-Fos = 659 cells, nc-Fos+vGAT = 638, n = 4 mice; vGAT+/all c-Fos: 96.90 ± 1.1%).
p, Summary diagram based on Figs. 1–4 showing that Calr+LT input carries CS, US and CS + US signals originating from the brainstem and transfers them to the LA and SIC. Arrows with darker colors indicate stronger signals. Confocal images in a–d, e–h, j, k and n are representative of n = 4 mice. Data in d, i, l and o represent the mean ± s.d; *P < 0.05; **P < 0.01; ***P < 0.001; ****P < 0.0001 (two-sided t-test). See Supplementary Table 5 for statistical details.
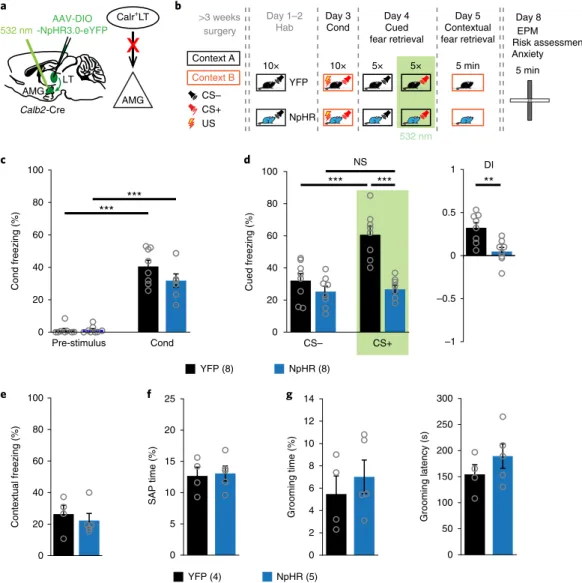
The Calr+LT→AMG route is necessary for the retrieval of cued fear memory. Finally, we assessed whether activity of the
Calr
+LT→AMG route, changed by fear learning, is necessary for the retrieval of conditioned fear memory. After successful and simi- lar fear learning in YFP and NpHR mice during the conditioning phase, we optogenetically inhibited the Calr
+LT→AMG axons dur- ing CS+ presentations in retrieval (Fig. 8a–c). NpHR mice showed decreased freezing induced by CS+ compared with controls (YFP);
thus, the NpHR mice had impaired memory retrieval (Fig. 8d).
These changes were temporary and restricted to the condi- tioned cue-induced behavior, as NpHR animals showed similar contextual fear responses (Fig. 8e), risk assessment and grooming behavior to the YFP mice (Fig. 8f,g). These data show that, as fear acquisition was intact, optogenetic manipulation during cued fear retrieval only blocked the Calr
+LT→AMG information flow neces- sary for ongoing signal discrimination but did not abolish other features—for example, the contextual aspect—of the consolidated fear memory.
Calr+LT cells equally control cortical and basal ganglia cir- cuitry in associative behavior. Besides the amygdala projection,
hypothalamic and temporal cortical regions are innervated by both Calr
+LT and Calr
–LT populations, but in a distinct pattern (Supplementary Fig. 9a–f). While the Calr
–cells were preferen- tially connected to sensory cortical areas (primary auditory cortex (Au1) and ventral secondary auditory cortex (AuV)), Calr
+LT neu- rons targeted the AuV and the temporal association cortex (TeA),
as well as the insular cortices. The latter cortical regions provide the main cortico–LA projection (Supplementary Fig. 9g–q) and are involved in long-term fear memory storage and retrieval
36. We further found that ~40–60% of Calr
+LT cells targeted both the cor- tex and the LA (Supplementary Fig. 9r–w). This indicates that the same Calr
+LT population has a dual thalamic influence on the LA in fear learning and memory recall: directly via the thalamo–amyg- dala route and indirectly via the thalamo–cortico–amygdala route
1(Supplementary Fig. 9q).
In addition, Calr
+LT cells sent axonal projections to the amyg- dalostriatal transition area (AStr), which is suggested to participate in sensory processes during fear learning
8(Supplementary Fig. 10).
The majority of the AStr-projecting LT neurons were also Calr
+and distributed similarly to those projecting to the LA (Supplementary Fig. 10a–g). Double retrograde labeling with injections of A488- conjugated and A555-conjugated CTB into the LA and AStr (Supplementary Fig. 10h–k) showed that a substantial proportion (20–30%) of LT cells projected to both regions (Supplementary Fig. 10l,m). This suggests that the Calr
+LT cell population can syn- chronously shape the activity of the amygdala and AStr neurons in fear behavior. In accordance with this, fear conditioning and cued fear-retrieval-evoked c-Fos activation patterns were com- parable between the AStr and the LA (Supplementary Fig. 10n,o;
Supplementary Table 6a,b), which is potentially as a result of Calr
+LT neuron activity. Actually, both the spontaneous (Supplementary Fig. 10p,q) and the sensory-evoked firing rate of the recorded AStr cells (Supplementary Fig. 10r; Supplementary Tables 6a,b and 7)
e
Tone FS Tone+FS
AStr LA BA CeMCeL
BMA TeA
SIC
b
–5 0 5 10 15
LA PN LA PN disinh.
SIC SIC disinh. Ctrl
–5 0 5
–5 0 5
z-score changes
Ctrl NpHR Ctrl NpHR
NpHR 1 s
Tone 50 µV 1 msz-score (firirng rate)
0.1 s FS
Tone +FS
SIC neuron
0 16
0 16
0 8 16
Time (s) Time (s)
0 5 0 5
NpHR Ctrl
8
8
Time (s) Time (s) LA PN
5 5
NpHR Ctrl
0 4 8 12
0 4 8 12
0 4 8 12
0 0
FoxP2 BDA
ITC LA
BA CeA
AStr SICLA
SIC
200 µm 20 µm
Inj. LA
20 µm
g
CeA SIC AStr
BA LA
f BDA
h i
Time (s) Time (s)
0 5 0 5
NpHR Ctrl
0 20 40
0 20 40
0 20 40
LA Int d
c
j
LA Int LA Int disinh.
AAV-DIO -NpHR3.0-eYFP 532 nm
Calr+ AMG LT
Unit
a
Calb2-Cre +
Calr+LT
SIC/LA Int LA PN 1
2 3 500 µm
SIC SIC
Fig. 5 | calr+Lt neurons control the multisensory activation of amygdala cells in a complex manner. a, Top: schematic of optogenetic inhibition of NpHR-labeled Calr+LT→AMG inputs and unit recordings in the amygdala. Bottom: a representative coronal section indicating the insertion tracks of the optic fiber (blue) and a four-shank electrode (red) in the amygdala. b–d, Optogenetic inhibition (green) of NpHR+ Calr+LT inputs alters sensory-evoked amygdala activity compared to the control condition (n = 11 mice). Evoked sensory responses of a LA principal cell (LA PN; b), a LA interneuron (LA Int;
c) and a neuron from the SIC (SIC neuron; d) are inhibited by NpHR-mediated Calr+LT axonal inhibition. Gray shadings represent the delivery of tone, red arrowheads mark the delivery of footshock stimuli. e, Pooled data for average z-scored activity changes (<50 ms) elicited by optogenetic Calr+LT→AMG axonal silencing (green shaded area) during different sensory stimulation. ‘Disinh’ indicates cells without evoked response during control condition but with activation (disinhibition) as a result of Calr+LT axonal inhibition. All results from in vivo acute amygdala electrophysiology data analysis are summarized in Supplementary Table 7; details of statistical analyses are provided in Supplementary Table 5. f, Schematic of BDA injections into the SIC.
g, BDA (red; right) injection site in the SIC outside the FoxP2-labeled ITC (green; left and right). Arrowheads (right) point to BDA-labeled axons (red) in the LA and the AStr. h, BDA-labeled cells within the SIC form local axon collaterals (white arrowheads), which are positioned in close proximity (yellow arrows) to BDA-labeled dendrites (white arrows). i, BDA-labeled axon terminals in the LA (white arrowheads). Confocal images in g–i are representative of n = 4 mice. j, Summary drawing indicating the complex activity patterns of LA PN and LA Int/SIC neurons elicited by excitatory Calr+LT inputs: (1) feedforward excitation; (2) feedforward inhibition via local LA Int or SIC; and (3) LA Int/SIC-mediated disinhibition.
0 20 40 60 80 100
Pre-stimulus Cond 0
CS– CS+ –1
–0.5 0 0.5 1
0 20 40 60 80 100
Cond freezing (%) Cued freezing (%)
Contextual freezing (%)
20 40 60 80 100
d e
f
DI
*** ***
#
NS ***
*
*** **
NS
*** ***
*** NS
* #
NS
** *
# LT AMG
OF
1 mm
a b
c
LA LA
SAP time (%)
h
0 5 10 15 20
25 *
Grooming time (%)
0 2 4 6 8 10 12
14 *
Grooming latency (s)
0 50 100 150 200 250
300 ** #
#
g
OF
CS-only YFP (6) YFP (6) NpHR (7)
AAV-DIO -NpHR3.0-eYFP 532 nm
Calb2-Cre
Calr+LT
AMG
x
Day 1–2 Hab
Context B Context A
Day 3 Cond
CS–
CS+
US
10× 10×
>3 weeks surgery
Day 4 Cued fear retrieval
Day 5 Contextual fear retrieval
Day 8 EPM Risk assessment
Anxiety CS-only
YFP
NpHR YFP
5× 5× 5 min
532 nm
5 min
CS-only YFP (6) YFP (6) NpHR (5)
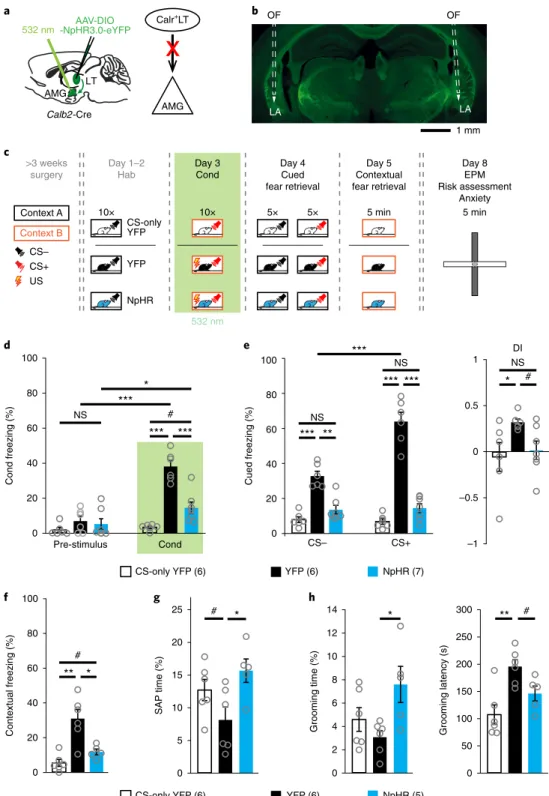
Fig. 6 | calr+Lt→AMG inputs shape fear learning. a, Left: schematic of viral injections and optic fiber implantation above the amygdala. Right:
experimental design for axonal inhibition of Calr+LT inputs in the amygdala. b, An example coronal section with bilaterally implanted optic fibers (OFs).
c, Schematic of the protocol used for investigating the behavioral impact of optogenetic silencing of Calr+LT→AMG inputs (green shading) during auditory fear-conditioning (day 3). d, Freezing behavior during fear conditioning (Cond.). Repeated-measures ANOVA for group by time interactions (F2,16 = 36.9894, P = 1 × 10⁻⁶) with unequal N honest significant difference (HSD) test. e, Left: freezing behavior during the cued fear-memory retrieval.
Repeated measures ANOVA for group by time interactions (F2,16 = 29.5351, P = 4 × 10⁻⁶) with unequal N HSD test. Right: the calculated DI values.
Kruskal–Wallis ANOVA (H2,19 = 5.7301, P = 0.057) with Mann–Whitney U-test (two-sided). f, Freezing behavior in contextual fear retrieval. Kruskal–
Wallis ANOVA (H2,17 = 10.1036, P = 0.0064) with Mann–Whitney U-test (two-sided). g, Risk assessment behavior measured from time spent in the stretch–attend posture (SAP) in the EPM test environment. Kruskal–Wallis ANOVA (H2,17 = 6.6121, P = 0.0459) with Mann–Whitney U-test (two-sided).
h, Grooming behavior. Left: time spent by grooming in the EPM. Kruskal–Wallis ANOVA (H2,17 = 5.5473, P = 0.0624) with Mann–Whitney
U-test (two-sided). Right: grooming latency. Kruskal–Wallis ANOVA (H2,17 = 8.8810, P = 0.0118) with Mann–Whitney U-test (two-sided). For d–h, data show the mean ± s.e.m; the number of mice are in parentheses next to the keys for the charts. 0.05 > #P < 0.1, *P < 0.05, **P < 0.01, ***P < 0.001.
See Supplementary Table 5 for statistical details.