P
ethőG
ÁBOR, V
ASSP
ÉTER,
G EOPHYSICS
1
I. G
RAVITYMETHODS1. S
HORTHISTORYOFGRAVITYEXPLORATIONPierre Bouguer (1698 -1758)
The history of gravity exploration is based on the studies of Galilei, Kepler, and Newton (16th-17th centuries).
Galilei found (in 1589) that objects fall at similar acceleration independent of their mass. Kepler worked out the three laws of planetary motion (1609 and 1619). Sir Isaac Newton discovered the universal law of gravitation (1685-1687). Bouguer investigated gravity variations with elevation and latitude (1735-1745) and the density of the Earth.
Lóránd Eötvös (1848 -1919)
The gravity method was the first geophysical technique to be used in oil and gas exploration. In the first third of the 20th century, the torsion balance was the standard instrument for gravity exploration. The torsion balance, invented by Eötvös, was one of the first geophysical instruments and it was used in the exploration of anticline structures and salt domes. He called this instrument the horizontal variometer because it could measure not only the curvature values (which give the deviation of the equipotential surfaces from the spherical shape) but also the horizontal gradient of gravity (which is defined as the rate of change of gravity over a horizontal distance). After the first measurements – on Ság Hill (1891) and on the ice of Lake Balaton (1901-1903) – an oil-bearing anticline structure was confirmed using it in Egbell (1916). The first salt dome and oil-bearing structure that was discovered by the torsion balance was the Nash dome in Brazoria County (Texas, USA) in 1924. It was the Americans who stated that this result could be considered as the beginning of the era of applied geophysics.
After 1932 stable gravimeters were used. The zero-length spring concept was developed by LaCoste (1934) and it was introduced into practice in 1939. Gravimeters have been adapted on moving ships and aircraft since the 1950s. Since the 1980s spring gravimeters have incorporated electrostatic feedback that considerably improves their drift performance and linearity. In the last decades very sensitive absolute and relative gravimeters (including superconducting ones) have been developed. At the beginning of this century gravity satellites were also launched and promising results were achieved.
2. I
NTRODUCTIONTOTHEMATHEMATICALANDPHYSICALBASISOFGRAVITYIf the Earth were a perfect sphere without rotation and if it were completely homogeneous in composition, the gravity field at the surface would be the same everywhere. This attraction force can be calculated on the basis of Newton’s law of gravitation if the mass of the Earth (M) is imagined at the centre of our planet. The force exerted on the body of mass m1 at the Earth’s surface can be expressed as:
where f denotes the universal gravitation constant and r is the mean radius of our planet. For this situation the equipotential surfaces would form a set of concentric spheres. Due to the rotation of the homogeneous spherical planet, the vectorial sum of the attraction force and the centrifugal force can be measured at the surface, resulting in the gravitational force (see in Fig.1):
Fig. 1: The vectorial sum of the attraction and centrifugal force can be measured at the surface
Here Φ stands for geocentric latitude; p denotes the distance from the axis of rotation to the point of observation.
The centrifugal force is perpendicular to the axis of rotation and it has the greatest amplitude at the equator. It acts counter to gravity except at either pole, where it amounts to zero. This force has rendered the Earth’s shape oblate.
Because the gravitational field is a conservative one, the gravitational potential – as the sum of the potential of the two forces – can be given:
If we assume Ug to be constant, the equipotential surface at the mean sea level would be a spheroid. However, from either a geographical or a geophysical point of view the use of an ellipsoid of revolution as a reference datum is more convenient, because fewer constants are involved. A geocentric reference ellipsoid rfe can be given as
where l is the flattening depending on the polar and equatorial radius ( re).
Carlo Somiliagna (1860 -1955)
The ellipsoidal shape changes the gravitation potential of the Earth from that of homogeneous sphere. At a point on the surface of the rotating ellipsoid the determination of the gravitational potential requires series expansion, and the expression for Uv is more sophisticated than that of a sphere. In the knowledge of this potential the theoretical value of gravity on the surface of the rotating ellipsoid can be derived by differentiating the gravity potential (C. Somigliana). The variation in normal gravity with latitude over the surface of an ellipsoidal earth – denoted as gnorm – can be expressed in the following form:
where ge is the normal value of the gravity on the equator, and are constants depending on the gravitational and geometrical flattening of the reference ellipsoid and the ratio of acceleration force to the mass attraction force at the equator of ellipsoid. Here stands for the geographic latitude which is determined by the angle between the plane of the equator and the line perpendicular to the ellipsoid, i.e. to the plane that is tangential
to the ellipsoid (the difference between the geocentric and geographic latitude is very small, reaching its maximum at a latitude of 45° and it amounts to 0.19°). Applied geophysicists have used this relationship for the determination of gravity distribution at the sea level and for normal correction. The first normal formula for gravity was accepted in 1930, and ge , , values were revised in 1967. Further modification took place in 1980 and the new constants applied at that time by the Geodetic Reference System (GRS80) are still in common use. The reference ellipsoid – World Geodetic System 1984 (WGS84) – used by GPS is also based upon the reference ellipsoid of GRS80 and these reference ellipsoids can be considered identical for all practical purposes.
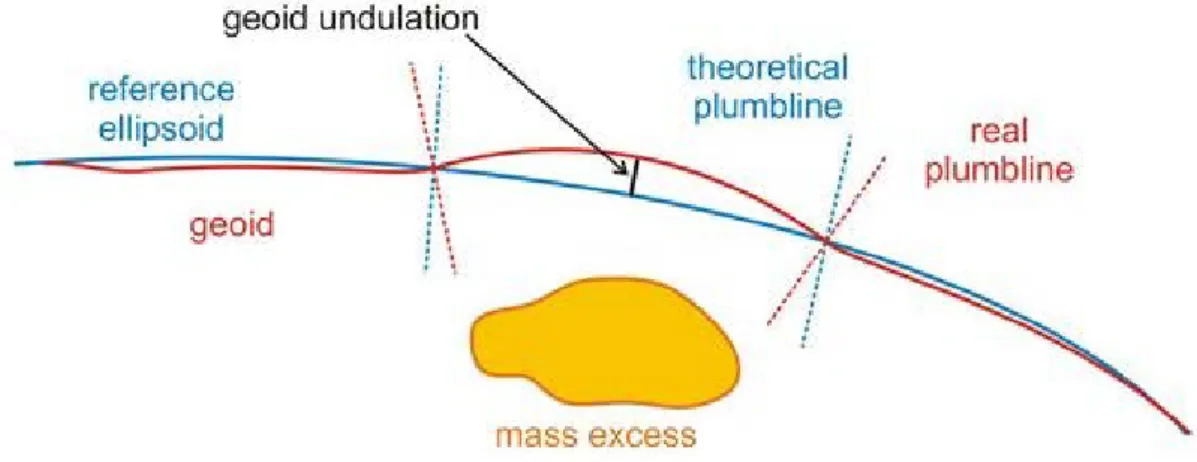
The geoid is that equipotential surface of the Earth’s gravity field that would coincide with the mean sea surface at rest. Being an equipotential surface, the gravity at every point of this virtual surface is perpendicular to it. The distance between the geoid and the reference ellipsoid is called geoid undulation (N)
Fig. 2: Demonstration of reference ellipsoid, geoid, geoid undulation, real and theoretical plumbline
The deflection of the vertical at the surface of the Earth is the angular difference between the direction of the gravity vector – coinciding with the real plumbline – and the ellipsoidal normal through the same point at the Earth’s surface. Fig. 2 shows the deflection of the vertical at the geoid and the geoid undulation caused by a mass excess. In this case the gravity vectors deflect toward the mass anomaly, causing the equipotential surface to warp outward. The result is the local elevation of the geoid above the reference ellipsoid. A similar effect can be experienced if a mass (e.g. mountain) is outside the ellipsoid.
In everyday life both geoid and geoid undulation have practical importance. The level of the ocean (i.e., the geoid) is the surface from which land elevations and ocean depths are defined. The knowledge of geoid undulation is needed in order to obtain accurate latitude data from GPS measurements.
3. T
HEINSTRUMENTS ANDTHEMEASUREDPARAMETERSOFGRAVIMETRYGravity measurements are carried out on land, at sea, and in boreholes and not only airborne but also space instruments have been developed. In the course of the gravity measurements the gradients of the gravity field, the acceleration of gravity itself, and mainly the relative changes in gravity are observed.
Gravity measurements can be either absolute or relative. It is called absolute gravity measurement when the absolute acceleration of the Earth’s gravity field is determined. More frequently the difference between the gravity field at two points is measured in the course of a gravity survey, and in this case relative measurement is carried out.
The absolute measurement of gravity is based on the accurate timing of a swinging pendulum (there is an inverse relationship between g and the period square of the pendulum) or of a free-falling weight. The accurate measurement of the change of position is based on a Michelson interferometer. This can be located at a fixed installation but a portable version is in use as well. These measurements provide data for global mapping studies (for either geophysical or geodetical purposes), to establish base gravity networks and to fix tie points for linking independent exploration surveys. Up-to-date absolute gravimeters are FG-5, FG-L, and A-10 instruments.
Relative measurements can be made by torsion balance, pendulum and gravimeter. Nowadays the latter is used for mineral exploration. There is a general principle applied in gravimeters in the course of relative measurement of
gravity: because the change in gravity varies the force acting on a suspended body of constant mass, the external force (for example elastic force) required to hold this body in its null position is proportional to the gravity at the station, relative to other stations. The first gravimeters were stable-type ones. They were followed by unstable (or astatized) gravimeters, the LaCoste-Romberg gravimeter (which was the first to employ a zero-length spring) and the Worden gravimeter.
4. T
HEE
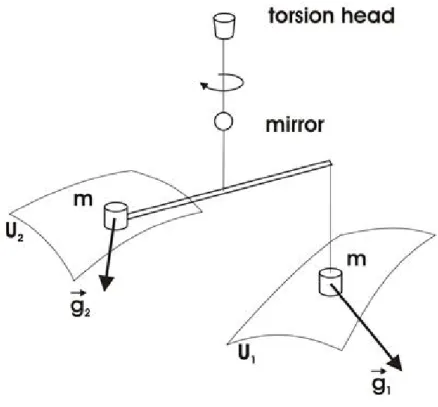
ÖTVÖS TORSIONBALANCEEötvös developed two types of torsion balance. The first one was a light horizontal bar suspended on a torsion wire with platinum masses attached to either end, so that the masses were at the same level. This was the curvature variometer, very similar to that used by Coulomb and Cavendish. The second torsion balance had a vertical torsion wire carrying a horizontal light bar. A platinum mass was attached to one end of the horizontal bar, while the other end carried a weight of equal mass suspended by a wire. This was named the horizontal variometer by its inventor. The main feature of this instrument was that the two weights were not at the same level as it can be seen in Fig.3.
You can find more details at http://www.elgi.hu/museum/
The horizontal bar revolves around the torsion wire on a horizontal plane and is deflected from the torsionless position of the wire by the horizontal components of the gravity forces. The bar will come to rest if the resistance of the torsion wire to torsion is equivalent to the torque of rotation exerted by gravity. This second type of torsion balance is known as the Eötvös torsion balance.
Fig. 3:The principle of Eötvös torsion balance
The horizontal variometer – just like the curvature variometer – yields the curvature value if the instrument is set up in the requisite number of azimuths.
Eötvös gave a relationship for the differential curvature R in function of gravity acceleration and the minimum and maximum curvature radii and in the function of the second derivatives of gravitational potential.
The direction of the differential curvature (λ) with respect to geographic North (the positive x-axis points towards the North and positive y-axis points towards the East) is
The horizontal gradients of the gravity field can be derived from the horizontal variometer measurements:
where Uxz and Uyz are the N−S and E−W components of the horizontal gradients of gravity. In honour of Eötvös, a convenient unit for gradiometry (10-9 s-2) was named after him. One Eötvös is the unit of gradient of gravity acceleration, which is defined as a 10-6 mGal change of gravity over a horizontal distance of 1 centimetre. Both the gradients and the curvature values are expressed in Eötvös units, which are about 10-12 part of the force of gravity change over 1 centimetre.
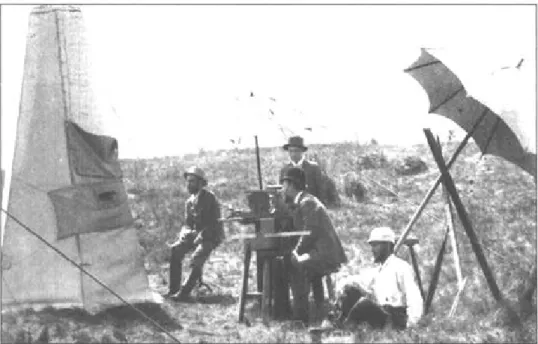
Fig. 4: The first Eötvös torsion balance field measurement in 1891 on Ság Hill (in Hungary), from Szabó (1988)
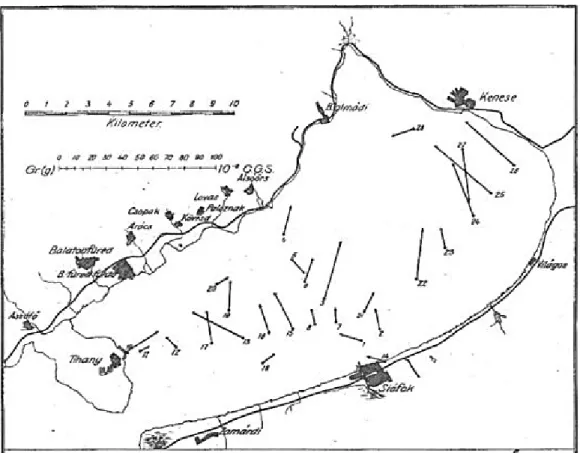
The photo illustrating the first Eötvös torsion balance field measurement can be seen in Fig.4, and two horizontal gradient maps are presented in Fig. 5 and Fig. 6.
Fig. 5: The first gravity horizontal gradient map based upon measurements between 1901 -1903 on the frozen Lake Balaton (from Szabó, 1988)
Fig. 6: The horizontal gradient map of the first successful oil exploration made by Eötvös torsion balance in the region of Gbely (Slovakia) in 1916 (after Szabó, 1988)
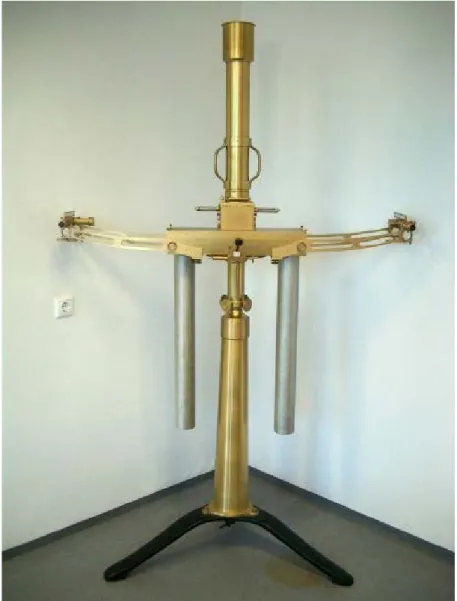
After some test measurements the simple horizontal variometer was modified for exploration work. To make shorter measurements at one station, Eötvös constructed an instrument with two torsion balances (1902). A photo of the double balance is given in Fig. 7.
Fig. 7: Photo illustrating double balance
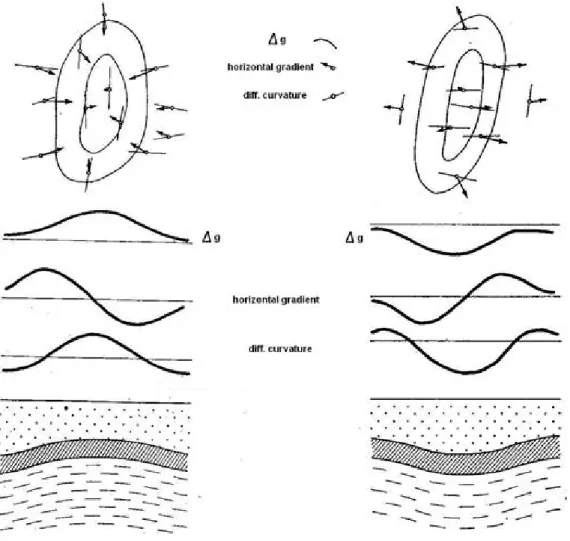
Fig. 8: Gravity responses due to anticlinal (left) and synclinal (right) structure, after Renner et al. (1970)
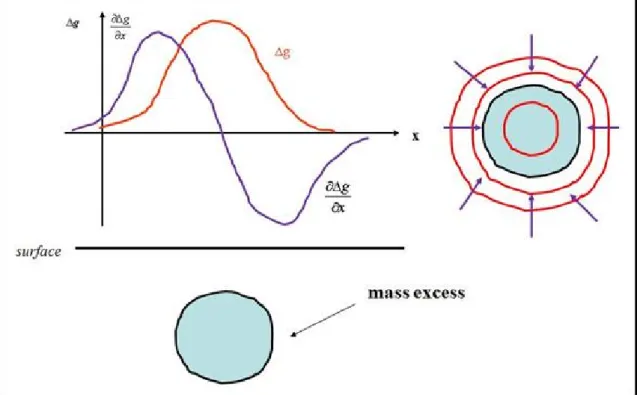
Gravity responses over partially elongated buried anticlinal and synclinal structure are presented in Fig.8. The basement has greater density, for this reason the gravity responses are developed by the excess of mass in the left, and the shortage of mass in the right, respectively. The isogal lines (on the top the closed curves) are the contour lines connecting points of equal gravity anomaly values. The horizontal gradient vectors are perpendicular to the isogal lines, showing the direction in which gravity has the greatest increase in the horizontal sense. The greater the rate of change of gravity is, the longer the length of the vector will be. Isogal lines delineate the structures, while horizontal gradient vectors locate the ridge of the anticline. Horizontal gradient and the differential curvature show opposite behaviour in the two cases. The value of the horizontal gradient is zero over the axes of the two elongated structures and it has a maximum or minimum over the flanks. Over the ridge the curvatures are parallel to the axis of the anticline and they are perpendicular to it over the syncline. Over a sphere-like body the gravity responses are not elongated, they are similar to those presented in Fig. 9.
Fig. 9: Change in gravity acceleration ( ) and horizontal gradient along a profile (left) and horizontal gradient map (right) over a sphere-like body
5. G
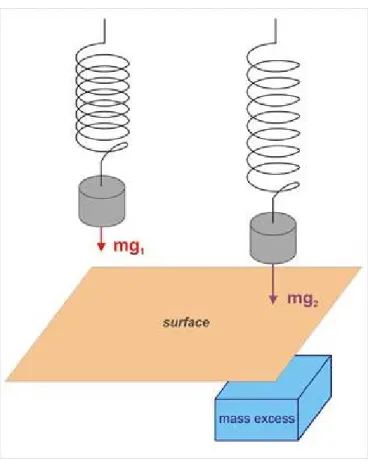
RAVIMETERSThe simplest way to present the physical principle of a (relative) gravimeter is when a mass is suspended from a vertical spring and the extension of the spring is expressed in the function of gravity changes(see Fig.10).
For the two stations mg1=rl1 and mg2=rl2, where r is the elastic constant of spring and l denotes the length of the spring. It follows that , i.e. the change in gravity force between the two stations is linearly proportional to the change in the length of the spring. This stable type of gravimeter is based on Hooke’s law. We do not use stable gravimeters in practice due to their low sensitivity. Because the changes to be measured are very small, systems are applied to amplify the change in gravitational acceleration.
Fig. 10: Simplified demonstration of the principle of gravity measurement
Fig. 11: Simplified demonstration of unstable gravimeter principle, after Steiner (1988)
Unstable or astatized gravimeters are more sensitive than the stable type gravimeters. In these gravimeters an additional force is applied acting in the same direction as gravity (and opposing the restoring force of the spring), resulting in a state of unstable equilibrium. In these instruments usually a proof mass is attached to a horizontal beam which is suspended by a main spring, and additional springs are also applied to return the sensitive measuring part to equilibrium. Its simplified version is presented in Fig.11. The change in gravity is measured in terms of the restoring force needed to return the sensitive element to a standard null position. The zero-length main spring, which is a common element in up-to-date gravimetry, was first introduced in the LaCoste-Romberg (LCR) gravimeter. A zero-length spring is one in which the tension is proportional to the actual length of the spring (i.e., its effective length is zero when the external forces acting on it are zero).
Gravimeters with a zero-length spring have great sensitivity, which is about 0.01mgal. Measurement can be made in a few minutes. The Worden gravimeter is especially portable, easy and fast to operate. Similarly to LCR
instruments, it is read by measuring the force needed to restore the rod to the horizontal position and it has similar sensitivity to LCR. It uses small and lightweight parts made of quartz, and it also employs an automatic temperature compensating system. In the course of a gravity survey the changes in gravity are so small that the gravimeters must be capable of detecting changes on the order of one part in ten million, or even on the order of 10-9 for microgravity exploration.
Recently easy to use automatic gravimeters have been developed (for example Scintrex CG-5, which is a relative gravimeter with reading resolution of 1 Gal and field repeatability of 5 Gal, see http://www.scintrexltd.com/gravity.html . Besides the suitable accuracy of measurement, some corrections are also automatically made by them. They have some common features, as follows. The electrically charged proof mass is in the middle of a capacitative transducer if it is in equilibrium. They use electrostatic nulling. In the course of measurement an automatic feedback circuit applies DC voltage to the capacitor plates and the electrostatic force acting on the proof mass brings it back to the null position. The relative value of gravity is proportional to the feedback voltage. The automatic gravimeters are usually equipped with a radio frequency remote transmitter to carry out measurements without any disturbing effect of touch. The operating temperature is between -40°C and +45°C. Some corrections (tide, near terrain, Faye-, Bouguer-, instrument tilt, temperature, drift) are also made automatically.
Among relative gravimeters the gPhone Gravimeter (formerly known as the Portable Earth Tide Meter) has very high reading resolution, which is 0.1 Gal.
More details at http://www.microglacoste.com/gPhone.htm
It has low static drift, applies automatic feedback circuit and uses a zero-length spring. It can be applied in earthquake and volcanic studies, earth tide monitoring or even for reservoir monitoring. It can also be used as a very sensitive low-frequency seismometer. Superconducting gravimeters can be characterized with the highest reading resolution, which is 1nanoGal. These gravimeters have almost completely solved the problem of drift arising from the application of mechanical springs. The great accuracy and stability are resulted by the major superconducting elements: levitated mass (which is a hollow niobium sphere filled with fluid helium), two niobium wire coils (for adjusting levitation force and magnetic gradient), and a superconducting cylinder (providing primary shielding). The position of the proof mass is detected by three capacitor plates, two of which are hemispherical caps surrounding the top and bottom halves of the sphere. The third plate is a spherical ring in a horizontal plane around the center of the sphere. By using a split transformer, the upper and lower hemispherical plates are driven by AC voltages that are 180 degrees out of phase. The sphere capacitively couples these voltages to the center plate of the bridge. In equilibrium the result signal on the center plate is zero. When the proof mass moves from its null position, it produces a signal that is linear for small displacements. From the amplified, demodulated and filtered center plate signal a DC voltage is produced which is proportional to the displacement resulting from gravity changes. The feedback current of the small superconducting coil is proportional to the center plate signal. In contrast to gravimeters using elastic forces of springs to return the proof mass into equilibrium, here it is the magnetic field which is used to balance the gravity changes. Superconducting gravimeters are used mainly in laboratories.
Some applications can be found at
http://www.doria.fi/bitstream/handle/10024/2590/studieso.pdf?sequence=1
The amplitude resolution of a gravity survey depends on the objective of the exploration. In the course of borehole gravity it is 0.002-0.005 mGal, while microgravity can be characterized by 0.001-0.01 mGal amplitude and 1-10m wavelength resolution. In the course of a time-lapse survey at least 0.01-0.1mGal amplitude resolution is required (Sheriff, 2006). The spacing of stations depends primarily on the depth of the anomaly (h). There is a rule of thumb that spacings must be less than h.
6. G
RAVIMETRYATSEAANDABOVETHEE
ARTHSince the gravimeters described above cannot be applied directly when merasurements are made at sea or in the air, special systems were developed for marine and airborne gravity surveys. The amplitude resolution for a water- bottom gravity survey is 0.08-0.15mGal, for shipborne gravity 0.2-0.3mGal, for airborne gravity 1-2mGal, and for satellite gravity 3-7mGal (Sheriff, 2006). In marine surveys a distinction is made between shelf and oceanic
exploration. Most of the surveys are carried out on board ship, when gravimeters are mounted on a gyro-stabilized platform. The resolution of the measurement depends not only on the gravimeter but also on the accuracy of positioning and the velocity determination for the logistic tool. In airborne surveys instruments are placed on board a low-velocity airplane or helicopter. The effects on gravity arising from the changes in the aircraft’s altitude, linear acceleration and heading have to be corrected.
During airborne and shipboard operation the measured gravity changes are influenced by the motion of the vehicle, which clearly differs from when the gravimeter is at rest. The motion produces a centrifugal force, depending on which way the vehicle is moving. If it passes from West to East, an eastward velocity component adds to the velocity owing to the rotation of the Earth, so in this case the increased centrifugal force decreases the gravity readings. If the motion is in the opposite direction, the centrifugal force increases the gravity reading as compared with when the gravimeter would be at rest. Eötvös derived the measure of this effect on gravity reading in function of latitude, azimuth angle with respect to geographic North, and the velocity of the moving vehicle and this correction is called Eötvös correction.
Recently sea-floor time-lapse gravity measurements have been applied for offshore CH production monitoring and CO2 storage monitoring. One of the greatest problems is to reoccupy the seafloor stations that were previously used. The accuracy of the new ROVdog system is within 3 Gal, and in the Troll West and Troll East fields it was possible to detect the changes in gas-oil contact (GOC) – where oil production resulted in a decrease in gravity – and in gas-water contact (GWC), where an increasing gravity response was experienced due to the rise of gas- water contact because of gas production. The observed changes were only some tens Gals over a period of seven years. The monitoring of CO2 storage was done with the same instrument on the seafloor above the Sleipner East field. Here CO2 was injected into Utsira formation and a change of more than 50 Gal during seven years was observed above the part of this formation that CO2 was injected into.
You can find more at
http://gravity.ucsd.edu/research/seafloor/deep_ocean/poster.pdf and
http://www.slideshare.net/Statoil/alnes-et-al-gravit y-and-subsidence-monitoring
The first significant achievement of satellite geodesy can be contributed to the Sputnik 2 and Explorer 1 satellites:
based upon their orbital data the flattening of the Earth was determined in 1958 (1/298.3). In the middle of 90s, using data from Topex-Poseidon, GPS, SLR, DORIS, and TDRSS an accurate global geoid was determined. The method of satellite gravimetry relies on the continuous and very accurate determination of the artificial satellite’s orbit influenced by the Earth’s gravity field. Because orbit perturbations are caused by the Earth’s spatial inhomogeneous gravity field, precise observation of the trajectory enabled us to determine the gravity field along the orbit. From these data the geoid can be concluded by downward continuation. The application of the global positioning system ensuring the continuous and accurate tracking of the artificial satellites resulted in a new era in space geodesy and space gravimetrics. For this reason the most reliable space gravity results have been achieved since the introduction and application of GPS.
CHAMP (CHAllenging Mini-satellite-Payload) was launched in July 2000. It was a high-low satellite-to-satellite tracking system. The primary (always low) satellite was equipped with a space-borne GPS receiver. Precise satellite trajectory determination with an accuracy of a few centimeters was provided by receiving 12 GPS signals simultaneously. The main part of the satellite is the three-axis accelerometer (probe mass) in the mass center of the satellite. The displacement of this probe mass in the satellite-fixed reference frame is used to conclude the non- gravitational forces (the residual air drag and radiation pressure forces from the Sun) affecting the orbit. The gravity effects from the Moon and Sun on the satellite’s orbit also have to be taken into account. From the trajectory, the effect of the gravitational forces exerted by planets different from the Earth and the effect of nongravitational forces on the trajectory the gravitational acceleration variation along the orbit can be concluded. The initial altitude was 450km, which had become 300 km at the end of the five-year mission. The inclination of the near-circular orbit was 87.27° to the equator and 94 minutes were needed for a revolution.
About the CHAMP project additional information can be found at http://www-app2.gfz-potsdam.de/pb1/op/champ/ and
http://www-app2.gfz-potsdam.de/pb1/op/champ/results/index_RESULTS.html
In the course of GRACE (Gravity Recovery And Climate Experiment), a joint American-German project, two twin
satellites were launched in March 2002. Both carried space-borne GPS receivers to determine their precise positions continuously over the surface. Their orbits are approximately the same due to the tandem mode. The inclination of the orbital plane to the equatorial one is 89.5°; they followed each other by 220km along their track.
The GRACE A&B is a low-low satellite-to satellite tracking system. The initial altitude was 500km, which decreased to 300 km during a period of five years. Gravity changes along the orbit can be concluded from the small changes in distances between the two satellites. The small variations in separation are measured by a highly accurate microwave (the wavelength is approximately 1 cm) ranging system, and the accuracy of this separation measurement is 1 micrometer. The distance between the twin satellites increases when, for instance, the leading satellite encounters increased gravity acceleration. In this case the altitude of the first satellite decreases, because it is pulled toward the area of higher gravity and speeds up. For this reason it is accelerated away from the second satellite. The orbit of the twin satellites was planned in such a way that they do not return over the same geographical site during the five-year mission. They measured the global gravity field in 30 days. Assuming continuous operation, this enables us to monitor mass distribution processes with different time periods. The models of the Earth’s gravity field and of the global geoid derived from CHAMP and GRACE data are greatly improved in accuracy over the previous models.
The change in gravity acceleration along the orbit of the CHAMP and GRACE satellites was not measured directly;
rather, it was determined by computation. From the knowledge of these data the real gravity potential can be approximated by spherical harmonics. To characterize a geoid model the knowledge of the spherical harmonic coefficients are needed. However, instead of listing them (i.e., in the form of table) the computed geoid model can be presented by the geoid undulation in WGS84 geodetic datum.
More details can be found at:
http://earthobservatory.nasa.gov/Features/GRACE/page3.php http://www.csr.utexas.edu/grace/
http://www.csr.utexas.edu/grace/gravity/solid_earth.html
http://www.csr.utexas.edu/grace/gallery/animations/world_gravity/world_gravity_qt.html http://www.csr.utexas.edu/grace/publications/water_litho.pdf
GOCE (Gravity field and steady-state Ocean Circulation Explorer), which is a high-low satellite-to-satellite tracking system just like CHAMP, was launched in March 2009. Its mission was planned for 20 months. Its altitude was planned at about 250 km. The inclination of its orbit is 96.7° relative to the equator. The satellite is 5 m long and 1 m in diameter, and weighs 1050 kg. This is the first space gravimetry system to employ the concept of gradiometry. GOCE is equipped with three pairs of ultra-sensitive accelerometers which are perpendicular to each other. They respond to the very small variations in the 'gravitational tug' of Earth as it travels along its orbital path.
The measurement of the acceleration differences over short distances of 0.5 m in three directions orthogonal to one another yields the gradient of the gravitational acceleration. The average of the two accelerations of each pair of accelerometers (common mode) is proportional to non-gravitational forces such as air-drag acting on the satellite. The most important objectives of the GOCE mission were to determine gravity anomalies with an accuracy of 1 mGal and the geoid with an accuracy of 1-2 cm, with a spatial resolution better than 100 km.
Interesting facts can be found at http://earth.esa.int/GOCE/ and http://www.esa.int/SPECIALS/GOCE/SEMY0FOZVAG_1.html#subhead2
Probably the best on-line summary about Earth gravity models is provided by http://icgem.gfz- potsdam.de/ICGEM/ICGEM.html
Satellite gravimetry can be considered as a powerful tool in the observation of the physical processes of the Earth, because temporal changes in Earth gravity can be detected by delivering spherical harmonics coefficients of gravity. The method is sensitive to processes of significant mass redistribution. The applicability of the method depends on the change in gravity experienced along the satellite orbit caused by the mass redistribution to be observed and the accuracy of the method (accuracy of measurements, accuracy of data processing, how accurately the investigated effect can be separated from the other disturbing ones). The main fields of research can be the study of ocean circulation (mass and heat transfer), significant redistribution in the atmosphere, geodynamics associated with the lithosphere, lithosphere-astenosphere interaction, subduction processes, changes in water level, and observation of polar ice-sheets. The space gravity results of the individual satellites can be integrated (e.g., GRACE has long and medium, while GOCE has short wave resolution). With satellite gravity, a spatial resolution of less than 20 or 30 km cannot be expected.
7. G
RAVITYANOMALIESGravity anomaly maps yield the difference between the observed gravity values and the theoretical gravity values for a region of interest. The theoretical gravity values should be the normal gravity values on the geocentric reference ellipsoid approaching the gravitational equipotential surface at the mean sea level. However, for practical geophysical exploration the sea level – i.e., the geoid – can be accepted as a reference datum. Gravity anomaly can be contoured by isogal lines, which represent the lines with equal value of gravity anomaly. A gal is the CGS unit of acceleration named after Galileo, equivalent to 1 cm/sec2. Not only the SI, but also the CGS acceleration unit is too large to map the earth's gravitational field anomalies. For this reason the contour interval uses usually milligals, but sometimes the order of 100 or 10 microgals is used depending on the accuracy of the measurement and the problem to be solved. Depending on what we want to emphasize there are free-air or Faye, Bouguer and isostatic gravity anomaly maps.
The Faye anomaly is defined by applying only normal, free-air, terrain (sometimes terrain correction is not applied) and tidal corrections to the measured gravity value.
The Bouguer anomaly is defined by applying normal, free-air, terrain and tidal corrections to the measured gravity value. The difference between the Bouguer and the Faye anomaly arises from the Bouguer plate correction (i.e., the density of the rock between the station and the datum elevations is also taken into account for preparing Bouguer anomaly map). For practical exploration it is usually the Bouguer gravity anomaly map that is applied.
Isostatic gravity anomaly is defined by applying isostatic correction to the Bouguer anomaly. It can be experienced that in regions of large elevation Bouguer anomalies are usually negative, while in oceanic regions they are mainly positive. Airy (1855) assumed that isostatic balance develops between crustal blocks (of lower density) and the asthenosphere (of higher density) for mountainous areas with deep crustal roots and for deep ocean basin areas with antiroots. He proposed a constant density for the crustal blocks of changing thickness. The isostatic correction is made from elevation and seawater depth data with the assumption of isostatic balance for all gravity stations. If this isostatic correction is also applied to the observed gravity data, besides the corrections applied to Bouguer anomaly, we obtain the isostatic anomaly. This tends to zero if there is an isostatic balance for the area of interest, is negative when the block will have to rise to get into balance, and is positive in the opposite case.
8. G
RAVITYCORRECTIONSThe aim of normal correction is to take into account the increase of gravity from the equator to the pole(s). If we neglect the difference arising from the use of geodetic ( ) and geocentric ( ) latitude, the normal value of gravity and its derivative with respect to latitude can be written as:
In term of North–South horizontal distance ( x) and the main radius of the Earth (R) . Substituting this into the equation above:
The approximation can be used because of the very small value of . From this relationship it follows that for fixed base and moving station distance the correction is at its maximum at latitude 45°, where it amounts to 0.01 mGal/12.3 m. The correction is added to the gravity reading if we move toward the equator.
Free air or Faye correction has to be made because the variation in the distance between the gravity stations and the reference level. On the basis of Newton’s law of gravitation the force exerted by the Earth (M) on the body of unit mass (m1=1) equals the acceleration of gravity, which can be given as . Differentiating this equation with respect to r, we receive a relationship showing the decrease in gravitational acceleration in the function of r.
From this relationship we can determine the change in gravity with respect to elevation between the stations and the datum surface. The free-air correction is added to the gravity reading if the station is above the datum level (and is subtracted if the station is below the reference datum).
Bouguer correction is made to gravity data because of the attraction of the rock between the station and the datum level. It is realized by the determination of the gravity effect due to an infinite slab of finite thickness (h) and homogeneous density ( ), the effect of which is 2 . The finite thickness of the slab equals the difference between the station and datum elevations. If the station is below the datum level, the Bouguer correction is made to take into account the gravitational effect of the missing rock between the datum and station elevations.
Terrain correction to gravity data is required due to the changing topography in the vicinity of the meter. The accuracy of the geodetical survey depends on the sensitivity of the gravimeter. Additional topographic corrections are often made on the basis of a topographic map to take into account the gravity effect of remote mountains and valleys.
Tidal correction is made to compensate for the attraction of the Moon (max. 0.11 mgal) and the Sun (max. 0.05 mgal). This correction is made on the basis of a data table or it is included in the drift correction of the instrument.
Fig. 12: Gravity Bouguer anomaly map of Hungary with reduction density of 2 t/m3, from Kiss (2006)
9. D
ENSITYOFROCKSThe gravity method is sensitive to lateral changes in density. The average density and the range of density of rock types are presented here based on Telford et al. (1993).
Igneous rock type Density range (t/m3) Average density (t/m3)
Rhyolite 2.35-2.7 2.52
Andesite 2.4-2.8 2.61
Granite 2.5-2.81 2.64
Granodiorite 2.67-2.79 2.73
Porphyry 2.60-2.89 2.74
Quartz diorite 2.62-2.96 2.79
Diorite 2.72-2.99 2.85
Diabase 2.50-3.20 2.91
Basalt 2.70-3.30 2.99
Gabbro 2.70-3.50 3.03
Peridotite 2.78-3.37 3.15
The density of igneous rock depends on its chemical composition and texture. In general, the higher the SiO2 content, the lower the density.
Metamorphic rock type Density range (t/m3) Average density (t/m3)
Quartzite 2.50-2.70 2.60
Schicts 2.39-2.9 2.64
Marble 2.6-2.9 2.75
Serpentine 2.4-3.1 2.78
Slate 2.7-2.9 2.79
Gneiss 2.59-3.0 2.80
Amphibolite 2.9-3.04 2.96
Metamorphic rock is usually formed in circumstances of high pressure and temperature, and for this reason its density is greater than that of primary rock.
10. T
RANSFORMATIONSOFB
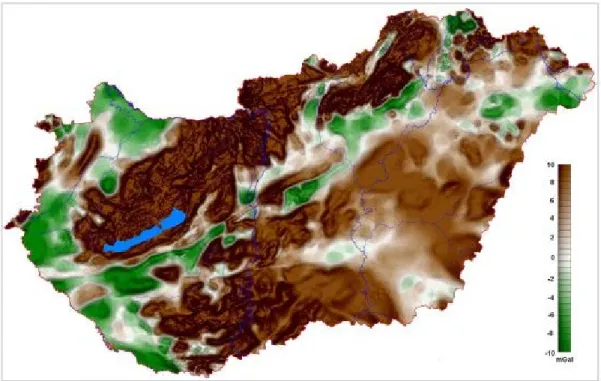
OUGUERGRAVITYANOMALYMAPSBouguer gravity anomaly maps are characterized by the superposition of gently varying longer wavelength regional anomalies and shorter wavelength local anomalies, as can be seen in Fig. 12. In applied gravity the task usually is to separate the near-surface gravity effect from the regional effect in order to obtain the residual anomaly map. In the other cases the emphasis is put on the regional anomaly. For this reason the regional gravity effect has to be enhanced and the local effect has to be suppressed. Fig. 13 demonstrates the graphical elimination of the two effects by means of smoothing. Generally, in both situations transformations are needed to enhance the required effect. In practice we encounter large gravity data sets, and these transformations are usually realized by filtering.
The digital filtering is more efficient in the wave number domain ( ) than in the space domain (x,y). The relationship between the wavelength ( ) and the wave number (k) is . The three steps of filtering are as follows:
Fourier transforming the Bouguer gravity anomaly map;
multiplying the Fourier transform of the Bouguer gravity anomaly map by the filter function of the wave number domain;
inverse Fourier transforming the product back into the space domain.
Depending upon the aim, different filter matrices have to be chosen. In the case of potential fields analytic continuation can also be applied to achieve the same result as by filtering. Upward continuation is applied when the gravity (potential) field is determined at an elevation higher than that at which the field is known. The aim of the upward continuation is to smooth out the near-surface effects, i.e., to enhance regional gravity effects. Fig. 14 shows an example for the result of this process, where the elevation of upward continuation is 1000 m. The two most characteristic features of this map are the smaller anomalies and the anomalies with higher wavelength compared with the initial Bouguer anomaly map. Instead of low-cut filtering or downward continuation, to get a residual gravity anomaly map, the upward continuation of the Bouguer anomaly map is subtracted from the Bouguer anomaly map. The resulting map, which reflects the near-surface lateral density variation, can be seen in Fig. 15. These three maps are the results of Eötvös Loránd Geophysical Institute (ELGI) and were partly published
by Kiss (2006).
Additional details can be found at http://real.mtak.hu/923/1/43100_ZJ1.pdf .
The use of filtering is evident in the case of this basin area of Southeast Hungary, where an anticlinal structure could be delineated by means of low-cut filtering of the Bouguer gravity anomaly map shown in Fig. 16. The residual map can be seen in Fig. 17.
We cannot expect good resolution from gravity surveys. However, over basin areas the main topographic features of the bedrock may correlate well with the Bouguer anomaly. In Fig. 18 the position of the negative Boguer anomaly coincides with the trench of the Triassic-Paleozoic limestone. This relatively hard bedrock is covered by less dense shaly sand layers and volcanic rock. Actually it is a relatively simple model in the physical sense, and for this reason it is favourable from the point of view of gravity interpretation.
Fig. 13: The elimination of regional and residual effects from each other, after Steiner (1988)
Fig. 14: Analytic upward continuation of Bouguer anomaly map in Fig. 12 to the height of 1000 m above sea level, from Kiss (2006)
Fig. 15: Residual gravity map obtained as a difference between the Bouguer anomaly map in Fig. 12 and the upward continuation of the Bouguer anomaly map in Fig. 14, from Kiss (2006)
Figs. 16 -17: Residual gravity map (down) derived from the Bouguer-anomaly map (above) in the SE part of Hungary, after Meskó (1989)
Fig. 18: Bouguer anomaly map over a trench structure in NE Hungary (top), Bouguer anomaly along the section of AB (middle), and the geological interpretation (bottom), after Steiner (1994)
11. G
RAVITYRESPONSEOFASPHERE,
QUESTIONOFINTERPRETATIONThe gravity effect of relatively simple bodies (a sphere, cylinder, step-like structure) can be analytically determined.
For example, structures like a salt dome or a cave sometimes can be approximated by a sphere or a vertical cylinder. Here we present only the gravity effect of a sphere. We assume constant density contrast between the sphere and its surroundings. The larger the depth of the sphere is, the smaller its gravity effect must be. If M denotes its mass difference, its gravity effect can be expressed as:
A gravimeter measures the vertical component of this effect, so:
Based upon this relationship, Fig. 19 shows the gravity effect of a sphere situated at different depths (H) in a homogeneous half-space, with constant density contrast. In this figure the normalized effect is presented and the normalization is made to the maximum gravity response due to the sphere at a depth of 10 m.
Fig. 19: Gravity effect of a sphere situated at different depths (normalization is made to the maximum gravity response due to the nearest sphere to the surface)
NORMALIZED GRAVITY EFFECT OF A SPHERE AT VARYING DEPTH
Animation for the normalized gravity effect of a sphere at varying depth
The aim of this animation is to present the change in the vertical component of gravitational acceleration due to a sphere with changeable density contrast and changeable depth. The radius of the sphere is 40 m, its depth can be altered between 50 m and 250 m. The density contrast between the inhomogeneity and its homogeneous surrounding can be changed between -3 kg/dm3 and 3 kg/dm3, and it can be entered with two decimal places. The position of the sphere cannot be changed horizontally. The less the depth of the sphere is, and/or the greater the density contrast between the anomalous body and its surroundings is, the higher the calculated anomaly.
In order to estimate the depth (h) of the sphere the half-width method is applied. If the half-width value is known, the depth can be easily determined, because there is a linear relation between them. As is shown in Fig. 20, the half-width is measured from the position of maximum (or minimum) – from x=0 – to the position of the anomaly where it falls to its half-value at x=x1/2 .
Fig. 20: Notations applied for the relationship between the depth of the anomaly (h) and the half value (x 1/2) for a body approximating a sphere in its form
To get the relationship between the depth and the half-width, it can be written:
With knowledge of the depth (h, from the half-width), the maximum of the Bouguer anomaly ( ) and density contrast ( ), the radius (s) of the sphere can be calculated:
It general, it can be stated on the basis of a Bouguer anomaly gravity map that there are several anomalous bodies. Here we present an animation about the normalized gravity effect of two spheres at varying depths.
NORMALIZED GRAVITY EFFECT OF TWO SPHERES AT VARYING DEPTHS
The aim of this second gravity animation is to present the change in the vertical component of gravitational acceleration due to two identical spheres with changeable depths. The radius of the spheres is 40 m, their depths can be changed between 50 m and 250 m. In contrast with the first gravity animation the density contrast between the inhomogeneity and its homogeneous surrounding is kept constant at 3 kg/dm3. The depth data can be entered by using the text boxes on the right side of the user interface. The positions of the spheres cannot be changed in the horizontal sense. If the two spheres (of the same mass) are at the same depth, we get a symmetrical response.
However, if one body is at a relatively great depth, its gravity effect is not recognizable.
12. G
ENERALASPECTSOFINTERPRETATIONIt can be usually stated on the basis of the Bouguer anomaly gravity map that there is more than one anomalous body, and they cannot be approximated by simple geological structures such as a sphere, cylinder or steps.
However, just like for simple geometry, even for the most sophisticated geological situation (with arbitrary geometry and density contrast) the gravity response can be determined. This process, by which the gravity response due to different mass distribution is determined, is called the solution to the direct problem or forward modelling. In the era of computers efficient finite difference (FD) and finite element (FE) methods are available for this purpose. In practice we encounter another problem: from the measured gravity data we have to determine the subsurface geology resulting in the observed results. This means that in the course of the inversion process the direct problems are solved many times, and the input parameters of the direct model has to be changed in such a way that we can achieve the best agreement between the observed gravity data and the computed response. The result of interpretation is a model that is consistent with the observed data. In this iteration-like process the choice
of the first model (start model) has practical significance, and to establish an appropriate start model the integration of a priori knowledge is highly recommended. In the course of the interpretation we may obtain several models that are consistent with the same observed data. Models with the same (gravity) responses are called equivalent models. To resolve the problem of equivalence, additional geophysical measurements (based on physical parameters other than density) or taking into account the well-log interpretation of a suitable borehole can be recommended.
13. A
PPLICATIONSOFTHEGRAVITYMETHODSpace gravimetry can be considered as a new phase of gravitational research. It has and will have special significance in monitoring processes with mass redistribution. In the earlier paragraphs some application examples were presented.
In the course of fluid and solid mineral exploration there is a general rule, that we can start with the methods of lower resolution in order to separate prosperous sites from non-prosperous ones. Gravity survey is among the first in the series of geophysical methods applied (for example in oil and gas exploration). In this phase of exploration the gravity survey usually has an important role in the delineation of buried geologic structures with density contrasts in a lateral sense.
Gravity survey can be carried out in solving near-surface environmental and engineering problems, as well.
Because it is used on a smaller scale than in HC exploration it is called microgravity. Microgravity can be an effective tool for the detection, characterization and prediction of geohazards posed by abandoned mining cavities.
It can be very successful in locating natural caves as well. This method is frequently used in finding the most appropriate geologic site for communal and nuclear waste disposal. Good examples can be found in Sharma (1997) (including gravity mapping of the Mors salt structure in Denmark, alluvium/bedrock contact in Arizona, gravity investigations of landfill in Indiana, microgravity studies of rockburst in mines in Poland, etc.).
There are many processes resulting in relatively small changes in gravity in time. Earlier the use of gravity in CO2 injection and in gas- or oil production monitoring was mentioned. One of the most convincing applications of microgravity monitoring is given by Mussett and Khan (2000) about the lava eruption of Etna between 1991 and 1993. From the change in gravity the movement of the magma in the vertical conduit could be "followed" in time, and even the mass of the intruded magma into the vertical conduit could be estimated. After the eruption the withdrawal of the magma could be observed on the basis of a decrease in gravity, and from the measurement of this reduction it was also possible to model the depth of withdrawal.
Similar applications can be found at:
http://articles.adsabs.harvard.edu//full/1999GeoJI.138...77B/0000086.000.html http://www.agu.org/pubs/crossref/2010/2009JB006835.shtml
http://www.sciencedirect.com/science?_ob=ArticleURL
14. R
EFERENCESANDRECOMMENDEDBOOKSKiss: Magyarország gravitációs Bouguer-anomália térképe, Geophysical Transactions, Vol. 45. No.2. 2006 Lowrie: Fundamentals of Geophysics, Second Edition, 2007
Meskó: Bevezetés a geofizikába, Budapest, 1989
Mussett, Khan: Looking into the Earth (An Introduction to Geological Geophysics), 2000.
Renner, Salát, Stegena, Szabadváry, Szemerédy: Geofizikai Kutatási módszerek III., Felszíni Geofizika, 1970 Sharma: Geophysical Methods in Geology, 2nd Edition, 1986
Sharma: Environmental and Engineering Geophysics, 1997 Sheriff: Encyclopedic Dictionary of Applied Geophysics, Tulsa, 2006
Ádám-Steiner-Takács: Bevezetés az alkalmazott geofizikába I. J14-1642, Budapest, 1988 Steiner: A gravitációs kutatómódszer, Gyakorlati Geofizika, Miskolc, 1994
Szabó: Three Fundamentals Papers of Loránd Eötvös (Eötvös the man, the scientist, the organizer), Eötvös Loránd Geophysical Institute of Hungary, 1998.
Telford, Geldart, Sheriff: Applied Geophysics, Second Edition, 1993
Digitális Egyetem, Copyright © Pethő Gábor, Vass Péter, 2011

