Volume 13, Number 1 © 2020 Nova Science Publishers, Inc.
T HICKNESS -D EPENDENT E LECTRICAL I MPEDANCE
S PECTRUM OF H UMAN D ENTIN
Gábor Orbán
1,2,3, Csaba Dobó-Nagy
2,, István Ulbert
3,4, and Gergely Márton
1,3,41Doctoral School on Materials Sciences and Technologies, Óbuda University, Budapest, Hungary
2Department of Oral Diagnostics, Faculty of Dentistry, Semmelweis University, Budapest, Hungary
3Institute of Cognitive Neuroscience and Psychology, Research Centre for Natural Sciences,
Budapest, Hungary
4Faculty of Information Technology and Bionics, Péter Pázmány Catholic University, Budapest, Hungary
A
BSTRACTUtilization of impedance measuring methods in dental researches makes the determination of electrical properties of human tooth possible. Although impedance measurement forms the basis of numerous oral diagnostic methods, limited studies are available about the impedance of human dentin. In this paper the thickness dependency of the impedance of human dentin is investigated.
Dentin disks were prepared from dentin layer of the crown between the top of pulp and below dentin-enamel junction of five human wisdom teeth. Separated and isolated round shaped measurement areas were created on the surface of the specimens with diameter of 1 mm. The samples were thinned sequentially while the thickness and the complex impedance of each measurement area was recorded.
Investigation of the impedance of human dentin in the thickness range of 0.3-2.3 mm allowed us to define the thickness-impedance coefficient of human dentin, as the absolute impedance value divided by the thickness and multiplied by the area of the examined dentin. The average of the thickness-impedance coefficient is equal to 8.356 Ωm at 1 kHz measurement frequency.
Approximately linear correlation between the thickness and the impedance of human dentin was revealed. These results may have significance in the field of clinical dentistry.
Keywords: bioengineering, electrical impedance spectrum, dentin thickness, human dentin
Corresponding Author’s Email: dobo-nagy.csaba@dent.semmelweis-univ.hu
I
NTRODUCTIONDentin is one of the major hard tissue components of teeth. It can be found under the enamel and it surrounds the entire pulp. This tissue contains micro channels projecting radially from the pulp to the enamel called dentin tubules. The density of dentin tubules near the pulp on the inner dentin is 55000 - 75000 mm2, near the enamel on the outer dentin it is 15000 - 20000 mm2. The diameter of the tubules is different as well, near the pulp they are approximately 3 - 4 µm, on the border of the dentin-enamel it is approximately 1 µm [1–5].
The dentin tubules are filled with ionized dentinal fluid therefore the bioelectrical activity of the pulp becomes measurable on the surface of the dentin. This method is called dentin recording.
Dentin recording methods allow us to observe the process of dental pain and pulp inflammation. These techniques also let the fluid flow through the tubules to be inspected and facilitate the examination of the neural control of the fluid flow [6–9]. In order to record one dental nerve activity separated from the others it is necessary to develop small size electrodes [10]. The changes of the hydrostatic pressure of the dental fluid in the dental tubules were measured to calculate the electrical field of the pulp [11].
Beyond the observations there are lots of experiments where the aim was to track the effect of some kind of stimulus with measuring the bioelectrical activity of tooth nerves [12].
Thus performed pulp sensibility testing has been and still remains a very helpful aid in endodontic diagnosis [13]. Applying these measurements the underlying cause of the dental pain can be tested [14–17]. An experiment series were made with different stimuli to specify the required threshold voltage and current for electrical stimulation [18]. In spite of the in vivo methods, these values can be defined more precisely with in vitro experiments.
The required mechanical properties of the dentin are already well defined [19] but the electrical properties have yet to be thoroughly characterized. For this purpose, performance of in vitro dentin recording experiments are required. The precise determination of the electrical impedance of dentin makes the definition of the accurate threshold voltage and current for electrical stimulation possible, but there are difficulties [20].
The temperature of the tooth not only influences the functional properties of the tooth pulp neurons [21] but also has affect to the impedance of the dentin [22]. This electrical parameter can be modified by the concentration of the used electrolyte (saline solution of sodium chloride) [23, 24] or the age of the tooth too [25]. The applied measuring signal has to be AC because in case of DC signal polarization artefacts arise on the electrode-tooth contact area [26–28]. The exact determination of dentin impedance can reveal other parameters and can be a basis of various diagnostics methods [29]. Due to dental caries the demineralization of the dentin occurs. This process changes both the tubules diameters and the dentin impedance [30]. Most experimental caries diagnostics methods are based on impedance measurement [30–32]. These methods have been proved to be more successful than former techniques [33–36]. Measuring the impedance between an inserted electrode in a root canal of a human tooth and an outer electrode placed on the oral mucosa was suitable to calculate the root canal length [37, 38]. Furthermore, impedance measurements can be used for defining the dentin permeability [39] or forming the basis of the investigation of an alternative bioimpedance spectroscopy method for assessment of tooth structure [40].
In the last few years new methods have been developed and applied in oral sciences like the two photon and the multi photon microscopes which were used successfully in caries diagnostics [41, 42], and γ-radiation which can change the mechanical and electrical properties of the dentin and of the enamel [43].
Impedance measurement has a prominent relevance in definition of the electrical properties of the dentin and it can be the basis of further oral diagnostic methods that might be used in clinical practice. The aim of this study is to define a new parameter, namely the thickness-impedance coefficient to characterize the thickness dependency of the impedance of human dentin.
M
ATERIALS ANDM
ETHODSSpecimen Preparation
Dentin disks were prepared from human wisdom teeth for in vitro characterization of the thickness dependent impedance of human dentin. Five teeth were removed without damage in the Semmelweis University, Department in Community Dentistry. The collection and application of the specimens happened anonymously accordance with the research ethical approval made by the Semmelweis University Regional Scientific and Research Ethics Committee with the permission note of 246/2017.
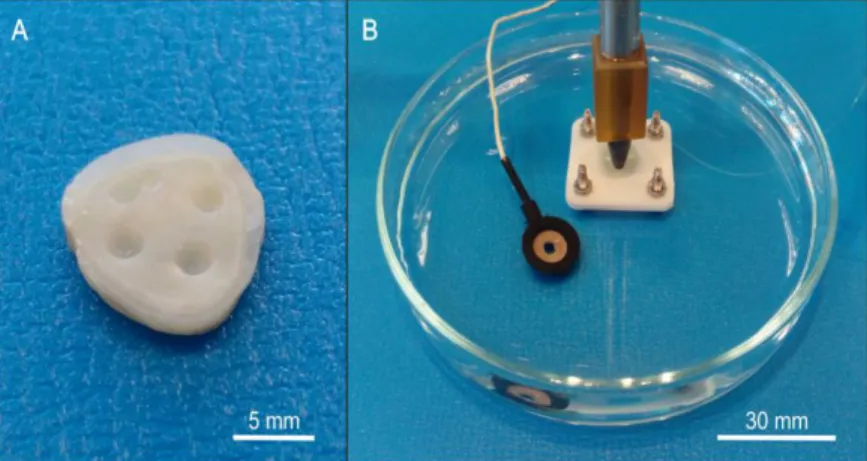
The protocol of specimen preparation was the following. The roots were stabilized in dental gypsum and with a suitable saw (Hofer, Aathal - Seegräben, Switzerland) 1 or 2 mm thick dentin disks were cut from the occlusal surface of the crown between the pulp and the enamel. The surfaces of the prepared disks were cleaned with 35% phosphoric acid for 20 s long to open the dentinal tubules from smear layer. The specimens were stored in 0.154 mol/L sodium chloride solution. A representative sample of prepared dentin disks is shown in Figure 1A.
Figure 1. One of the used dentin disks (a) and the assembled arrangement for impedance measurement in a Petri dish filled with sodium chloride solution (b): the Ag/AgCl reference electrode, the gently pressed silicone tube with the working electrode within, a
dentin disk and its holder.
Thickness Measurement
Prior to realizing thickness measurements, 3 - 4 separated test areas had been specified on the surface of each dentin disk. The number of the specified areas depended on the size of the intact area of the examined dentin disks. A layer thickness measuring apparatus was utilized to measure the thickness of the dentin on the middle of the defined test areas. The accuracy of the thickness measurement method is critical for proper calculation of the thickness dependency of the impedance, thus a stereotaxic frame with 10 µm resolution (David Kopf Instruments, Los Angeles, USA) was used to measure the thickness of the tested dentin disks.
A needle was stabilized to the electrode holder of the stereotaxic frame. Using a microscope, the reference thickness value was defined where the needle point reached the surface of the frame. The examined dentin disk was placed under the lifted needle to measure the thickness of each test area. Following this, the thicknesses of the test areas were calculated by subtracting the reference value from the thicknesses which were measured on the top of the test areas. The thickness measurement method was utilized before every impedance measurement to specify the correlation between the thickness and the impedance of the dentin.
Impedance Measuring System
Intan RHD2000 Evaluation System (Intan Technologies, Los Angeles, USA) was used for impedance measurement. The system contained an Intan RHD2000 USB interface board with a 16-channel amplifier board. The amplifier board was connected to the interface board via an SPI interface cable, the interface board was connected to a computer via USB 2.0. One of the sixteen channels was used to measure the impedance between the reference electrode and the working electrode. During the experiments the reference electrode was a silver chloride electrode and the working electrode was an 80% platinum - 20% iridium 40.46 µm thick micro wire (California FineWire Company, California, USA). The experiments were performed in 0.154 mol/L sodium chloride solution.
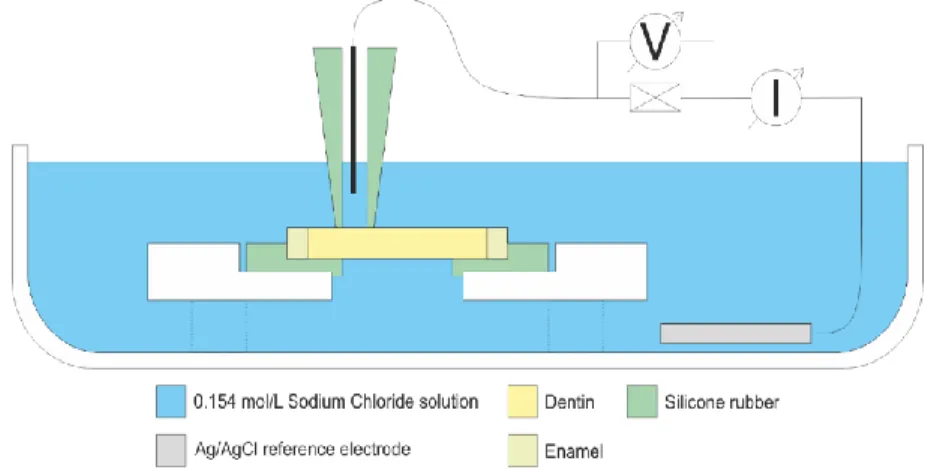
Figure 2. The representation of the assembled arrangement for impedance measurement.
The dentin disk was placed between silicone rubber parts which stabilized the specimen and insulated the working electrode from the reference electrode.
The examined dentin disk was placed in a holder in a Petri dish filled with sodium chloride solution. The holder allows the solution to flow under the specimen and through the dental tubules. The reference electrode was inserted in the solution near the specimen while the working electrode was built into a silicone tube. The inner diameter of the applied tube was 1 mm so the measured dentin surface was 0.785 mm2. The silicone tube was also filled with the 0.154 mol/L sodium chloride solution and it was gently pressed to the dentin to insulate the working electrode from the surrounding solution. Because of the insulation, the ion current between the working and the reference electrode could only flow through the dental tubules during the impedance measurement. The thus assembled measuring system is shown in Fig 1B and the schematic of the assembled system is presented in Figure 2.
Impedance Measurement
The insulation of the silicone tube was verified before the impedance measurements of test areas. The filled tube with the working electrode in it was gently pressed to the bottom of the Petri dish. The reference electrode was next to the tube as we described it earlier. The impedance measurement system has shown that there was no electrical connection between the two electrodes so the insulation of the silicone tube was suitable for the further recordings.
Prior to measuring the impedance of dentin disks it had been necessary to define the impedance of the working electrode and the transfer fluid to calibrate the measuring system.
The thus defined electrode impedance was subtracted from the impedance values measured on test areas to get the impedance of the examined dentin.
After every thickness measurement the impedance of each test area was measured at multiple frequencies between 50 Hz and 5000 Hz and the coherent thickness-impedance values got recorded according to the frequency.
As the next step of the measuring process, test areas of dentin disks were thinned with low speed dental drill. After thinning the same cleaning method was performed with phosphoric acid which was utilized after cutting dentin disks. The cleaning was followed by thickness measurement and the specimens were immersed to the sodium chloride solution to refill the dental tubules with saline. As it was done, the impedances of thicker test areas were measured and the new thickness-impedance values got recorded. The whole measuring process was repeated until the dentin disks were reduced to 0.3 mm thickness.
Data Analysis
The first step of the data analysis was to compare the coherent thickness and impedance values. Following that, focus groups were organized based on the measured thickness to observe the impedance of thickness ranges.
Group intervals were defined with consideration of the importance of the remaining dentin thickness in clinical practice. Thus defined focus groups and their quantity of samples were the following: between the thickness of 0.3 mm and 0.44 mm there were 11 samples, between 0.45 mm and 0.59 mm there were 11 samples, between 0.60 mm and 0.74 mm there were 13 samples, between 0.75 mm and 0.94 mm there were 9 samples, between 0.95 mm
and 1.24 mm there were 14 samples and between 1.25 mm and 2.28 mm there were 13 samples.
For statistical analyzing IBM SPSS Statistics 24 (IBM Corporation, New York, USA) software was used. The focus groups were observed by Kruskal - Wallis test on p = 0.002 significance level, and by using LSD as a post hoc test.
R
ESULTS ANDD
ISCUSSIONThe combined complex impedance of the working electrode and the saline is presented in Figure 3. Using the absolute impedance and its phase, the complex impedance of the measuring system is definable and it can be subtracted from the complex impedances which had been measured on the dentin disks to get the complex impedance of human dentin. A representative sample of the calculated dentin impedance is presented in Figure 4. The Bode curves indicate the capacitive behaviour of the measured system. The average impedance and the standard error of each thickness group is demonstrated at different frequencies in Figure 5.
Figure 3. The absolute impedance of the measuring system according to the measuring frequency (A) and the phase of the impedance of the measuring system according to the
measuring frequency (B).
Figure 4. A representative sample of the absolute impedance of the dentin according to the measuring frequency (A) and the phase of the impedance of the dentin according to the measuring frequency (B). The presented values were measured on a 1 mm thick
test area.
Figure 5. The average absolute impedance of human dentin with the standard error of the mean, sorted by the measuring frequency and the thickness of the specimens.
In order to represent the connection between the absolute impedance and the thickness of the examined dentin, the thickness-impedance coefficient of human dentin was defined as:
|𝑍|
𝑑 𝐴 = 8.356 Ωm
with the standard error of 0.605 Ωm
at 1 kHz, where Z is the absolute impedance, d is the thickness and A is the measured area of the dentin.
The applied statistic method proved that there are significant differences between the impedance values of each thickness group at 1 kHz. Please note that this coefficient depends on measuring frequency.
Previous studies reported the impedance of the human dentin on some specified thickness and usually from a larger measurement area (A) and on invariant thickness (d).
Using the analogy of conductive materials, the measurement area can be taken into account as the cross-section and the length of a conductive material, which is inversely proportional to the impedance. Therefore, it is important to include measurement areas in the analysis if we intend to compare the values obtained by previous and future studies. With this taken into account, the thickness-impedance coefficient presented here has proven to be in the same order of magnitude as earlier studies suggested [20,29,44]. However, the measurements of those studies were limited to one specific thickness value. In case of measuring the
impedance of the dentin perpendicularly to dental tubules, the measured impedances would be in a higher range of magnitude [45].
We used surgically removed impacted wisdom teeth in order to get similar samples where dentinal tubules were open on their entire length, also to reduce the influence of age related factors. A former study presented the age related changes in impedance spectroscopy of human dentin [25]. In terms of the age related occlusion of dental tubules, wisdom teeth are slightly comparable with the youngest focus group presented in that study. Comparing the results, if the tested thickness and the measured area are considered, the thickness-impedance coefficient provides corresponding impedance value as it was published earlier.
A recent in vivo study observed the effect of cavity depth on dentin sensitivity [16]. The authors deepened the cavities and measured the electrical resistance of them to observe the distance between the bottom of the cavities and the enamel-dentin junction. Since the remaining dentin thickness was not observed, the electrical resistance values presented in that study are hardly comparable with our results.
A
CKNOWLEDGMENTSWe are grateful to Dr. Krisztián Csomó for his support in statistical data analysis. Gábor Orbán is thankful to the Semmelweis University, Directorate of Innovation (STIA_19).
Ethical Compliance
Sources of Funding:
The authors received no specific funding for this work.
Potential Conflicts of Interest Statement:
The authors declare that they have no conflict of interest.
Informed Consent Statement:
Informed consent was obtained from each individual participant involved in this study.
Statement of Human Rights Statement:
This study was conducted in accordance with the 1964 Declaration of Helsinki and its subsequent amendments.
R
EFERENCES[1] Marshall Jr GW, Marshall SJ, Kinney JH, Balooch M. The dentin substrate: structure and properties related to bonding. J Dent. 1997;25(6):441–58. doi:10.1016/S0300- 5712(96)00065-6.
[2] Pashley D. Dentin: A dynamic substrate - A review. Scanning Microsc. 1989;3(1):161–
74.
[3] Olsson S, Öilo G, Adamczak E. The structure of dentin surfaces exposed for bond strength measurements. Eur J Oral Sci. 1993;101:180–4. doi::10.1111/j.1600- 0722.1993.tb01660.x.
[4] Fosse G, Saele PK, Eide R. Numerical density and distributional pattern of dentin tubules. Acta Odontol Scand. 1992;50(4):201–10. doi:10.3109/00016359209012764.
[5] Garberoglio R, Brännström M. Scanning electron microscopic investigation of human dental tubules. Arch Oral Biol. 1976;2:355–62. doi::10.1016/S0003-9969(76)80003-9.
[6] Olgart L. Local mechanism in dental pain, Mechanisms of Pain and Analgesic Compounds. Racen Press. 1979;285–94.
[7] Olgart L. Neural control of pulpal blood flow. Crit Rev Oral Biol Med. 1996;7(2):159–
71. doi:10.1177/10454411960070020401.
[8] Andrew D, Matthews B. Displacement of the contents of dentinal tubules and sensory transduction in intradental nerves of the cat. J Physiol. 2000;529(3):791–802. doi:
10.1111/j.1469-7793.2000.00791.x.
[9] Anderson D, Hannam A, Mathews B. Sensory mechanisms in mammalian teeth and their supporting structures. Am Physiol Soc. 1970;50(2):171–95. doi: 10.1152/
physrev.1970.50.2.171.
[10] Karmos G, Dobo-Nagy C, Tobias E, Varga E. Small Area Dentin Recording by a New Technique. In: IADR General Session 2010. 2010.
[11] Mumford J, Newton A. Transduction of hydrostatic pressure to electric potential in human dentin. J Dent Res. 1969;48(2):226–9. doi:10.1177/00220345690480021001.
[12] Salgar AR, Singh SH, Podar RS, Kulkarni GP, Babel SN. Determining predictability and accuracy of thermal and electrical dental pulp tests: An in vivo study. J Conserv Dent. 2017;20(1):46–9.
[13] Chen E, Abbott V. P. Dental Pulp Testing: A Review. Int J Dent. 2009;2009. doi:
10.1155/2009/365785.
[14] Närhi M, Hirvonen T, Hakumäki M. Responses of intradental nerve fibres to stimulation of dentine and pulp. Acta Physiol Scand. 1982;115:173–8. doi:
10.1111/j.1748-1716.1982.tb07062.x.
[15] Horiuchi H, Matthews B. Evidence on the origin of impulses recorded from dentine in the cat. J Physiol. 1974;242:797–829. doi:10.1113/jphysiol.1974.sp010778.
[16] Wanachantararak S, Ajcharanukul O, Vongsavan N, Matthews B. Effect of cavity depth on dentine sensitivity in man. Arch Oral Biol. 2016;66:120–8. doi: 10.1016/
j.archoralbio.2016.02.015.
[17] Chatrian CE, Lima VMF de, Lettich E, Canfield RC, Miller RC, Soso MJ. Electrical Stimulation of Tooth Pulp in Humans. II. Qualities of sensations. Elsevier Biomed Press. 1982;14:233–46. doi:10.1016/0304-3959(82)90131-2.
[18] Cadden S, Lisney S, Matthews B. Thresholds to electrical stimulation of nerves in cat canine tooth-pulp with Aβ-, Aδ- and C-fibre conduction velocities. Brain Res Elsevier Biomed Press. 1983;261:31–41. doi:10.1016/0006-8993(83)91280-5.
[19] Kinney J, Marshall S, Marshall G. The mechanical properties of human dentin: a critical review and re-evaluation of the dental literature. Crit Rev Oral Biol Med.
2003;14(1):13–29. doi:10.1177/154411130301400103
[20] Mumford J. Resistivity of human enamel and dentine. Arch Oral Biol. 1967;12:925–7.
doi:10.1016/0003-9969(67)90119-7.
[21] Ahn DK, Doutova EA, McNaughton K, Light AR, Närhi M, Maixner W. Functional Properties of Tooth Pulp Neurons Responding to Thermal Stimulation. J Dent Res.
2012;91(4). doi:10.1177/0022034511435703.
[22] Reyes-Gasga J, García G, Alvarez-Fregoso O, Chávez-Carvayar J, Vargas-Ulloa L.
Conductivity in human tooth enamel. J Mater Sci. 1999;34:2183 – 2188. doi:
10.1023/A:1004540617013.
[23] Schulte A, Gente M, Pieper K, Arends J. The electrical resistance of enamel-dentine cylinders. Influence of NaCl content in storage solutions. J Dent. 1998;26(2):113–8.
doi: 10.1016/S0300-5712(96)00087-5.
[24] Eldarrat A, High A, Kale G. Influence of sodium chloride content in electrolyte solution on electrochemical impedance measurements of human dentin. Dent Res J (Isfahan).
2017;14(1):25–31. doi:10.4103/1735-3327.201130.
[25] Eldarrat A, High A, Kale G. Age-related changes in ac-impedance spectroscopy studies of normal human dentine: further investigations. J Mater Sci Mater Med. 2010;21:45–
51. doi:10.1007/s10856-009-3842-x.
[26] Pincus P. A new method of examination of molar teeth grooves for the presence of dental caries. J Physiol. 1951;113:13–4. doi:10.1113/jphysiol.1951.sp004596.
[27] Mumford J. Relationship between the electrical resistance of human teeth and the presence and extent of dental caries. Br Dent J. 1965;100:239–44.
[28] Nomura H, Sakada S, Itow H. Some observations on electric conductivity of the tooth.
Bull Tokyo Dent Coll J. 1971;12:15–23.
[29] VanderNoot T, Levinkind M. AC impedance characteristics of human dental enamel and dentine. J Electroanal Chem. 1991;300:191–8. doi:10.1016/0022-0728(91)85394-5 [30] Liao YM, Feng ZD, Chen ZL. In situ tracing the process of human enamel
demineralization by electrochemical impedance spectroscopy (EIS). J Dent. 2007;
35:425–30. doi:10.1016/j.jdent.2006.11.011.
[31] Huysmans M-C, Longbottom C, Pitts N, Los P, Bruce P. Impedance Spectroscopy of Teeth with and without Approximal Caries Lesionsan in vitro Study. J Dent Res.
1996;75(11):1871–8. doi:10.1177/00220345960750110901.
[32] Xu Z, GeeNeoh K, Kishen A. Monitoring acid-demineralization of human dentine by electrochemical impedance spectroscopy (EIS). J Dent. 2008;36:1005–12. doi:
10.1016/ j.jdent.2008.08.007.
[33] Rock W, Kidd E. The electronic detection of demineralisation in occlusal fissures. Br Dent J. 1988;164:243–7. doi:10.1038/sj.bdj.4806450.
[34] Pieper K, Visser H, Hulsmann M, Wahner M. Test of an electronic fissure caries detector. Dtsch Zahnarztl Z. 1990;45:721–4.
[35] Verdonschot E, Bronkhorst E, Burgersdijk R, König K, Schaeken M, Truin G.
Performance of some diagnostic systems in examinations for small occlusal carious lesions. Caries Res. 1992;26:59–64. doi:10.1159/000261429.
[36] Ricketts D, Kidd E, Wilson R. A re-evaluation of electrical resistance measurements for the diagnosis of occlusal caries. Br Dent J. 1995;178(205):11–7.
[37] Meredith N, Gulabivala K. Electrical impedance measurements of root canal length.
Endod Dent Traumatol. 1997;13:126–31. doi:10.1111/j.1600-9657.1997.tb00025.x.
[38] Križaj D, Jan J, Valenčič V. Modeling AC Current ConductionThrough a HumanTooth.
Bioelectromagnetics. 2004;25:185–95. doi:10.1002/bem.10189.
[39] Pradelle-Plasse N, Wenger F, Colon P. Effect of conditioners on dentin permeability using an impedance method. J Dent. 2002;30:251–7. doi:10.1016/S0300-5712(02) 00042-8.
[40] Pereira Morais A, Visintainer Pino A, Nogueira Souza M. Assessment of Tooth Structure using an Alternative Electrical Bioimpedance Spectroscopy Method. Braz Dent J. 2014;25(2):146–52. doi:10.1590/0103-6440201302316.
[41] Chen MH, Chen WL, Sun Y, Fwu PT, Lin M-G, Dong C-Y. Three-dimensional tooth imaging using multiphoton and second harmonic generation microscopy. Proc SPIE.
2007;6425. doi:10.1117/12.698840.
[42] Lin PY, Lyu HC, Hsu CYS, Chang CS, Kao FJ. Imaging carious dental tissues with multiphoton fluorescence lifetime imaging microscopy. Biomed Opt Express. 2010;
2(1):149–58. doi:10.1364/BOE.2.000149.
[43] Eissa MF, El-Shamy HM, Hanafy HS. Structural and Dielectrical Properties of Sterilized Human Teeth. Phys Int [Internet]. 2012;3(1):22–7. doi: 10.3844/pisp. 2012 .22.27.
[44] Eldarrat A, High SA, Kale MG. In vitro analysis of ‘smear layer’ on human dentine using ac-impedance spectroscopy. J Dent. 2004;32:547–554. doi: 10.1016/j.jdent.
2004.05.003.
[45] MarjanovićI T, Lacković I. Dielectric Properties of Dentin between 100 Hz and 1 MHz Compared to Electrically Similar Body Tissues. In: XIII Mediterranean Conference on Medical and Biological Engineering and Computing. 2013. p. 682–5. doi: https://
doi.org/10.1007/978-3-319-00846-2_169.