Supporting Information
Stability and structural aspects of complexes forming between aluminum(III) and D-heptagluconate in acidic to strongly alkaline media:
an unexpected diversity
Ákos Buckóa, Bence Kutusb,∗, Gábor Peintlera, Zoltán Kelec, István Pálinkóa, Pál Siposa,∗
aMaterial and Solution Structure Research Group, Institute of Chemistry, University of Szeged, H–6720 Szeged, Dóm tér 7, Hungary
bDepartment of Molecular Spectroscopy, Max Planck Institute for Polymer Research, 55128 Mainz, Ackermannweg 10, Germany
cDepartment of Medical Chemistry,University of Szeged, H–6720 Szeged, Dóm tér 8, Hungary
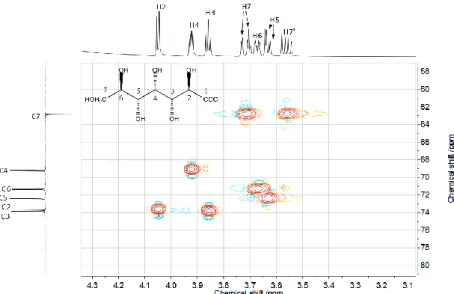
Figure S1 1H–13C heteronuclear single quantum correlation spectrum for a 0.5 M NaHpgl solution
∗ Corresponding author
Email addresses: kutusb@mpip-mainz.mpg.de (Bence Kutus), sipos@chem.u-szeged.hu (Pál Sipos) URL:
http://www.staff.u-szeged.hu/~sipos (Pál Sipos)
Preprint submitted to Journal of Molecular Liquids February 23, 2020
S1. Complexation between Al(OH)4− and Hpgl− ions
Potentiometric titrations. During the first series (black curves) the [Hpgl−]T concentration was varied between 0.200 – 0.400 M and the [Al(OH)−4 ]T concentration was set to 0.200 M. In the strongly alkaline regime (pHc ≈ 13.5) increasing the ligand concentration causes a shift towards higher Ecell values of the corresponding curves, implying that the value of Ecell is governed by [Hpgl−]T. Although the magnitude of change in the initial values could be entirely attributed to the extent of deprotonation, the observed difference is two times bigger of that experienced during the deprotonation of ligand (Fig. S1), indicating complex formation. Moreover, the lack of complexation would result the precipitation of gibbsite (Al(OH)3(s)) or other various aluminum-hydroxides.
Figure S2 Measured pHc values (= log ([H+]/cø) as a function of added titrant volume in solutions consisting of heptagluconate and HCl. The initial compositions are shown on the legend. Symbols represent the measured data, lines were fitted on the basis of the speciation model discussed in the text and provided in Table 1. Experimental conditions: T = (25±0.1)°C and I = 4 M (NaCl)
Figure S3 Measured pHc values (= log ([H+]/cø) as a function of added titrant volume in solutions consisting of heptagluconate and NaOH. The initial compositions are shown on the legend. Symbols represent the measured data, lines were fitted on the basis of the speciation model discussed in the text and provided in Table 1. Experimental conditions: T = (25±0.1)°C and I = 4 M (NaCl)
Polarimetry. First the molar rotation power of the individual components was determined. The prepared solutions and the corresponding degrees of rotation were as follows:
[Hpgl−]T = 0.175 M/[OH−]T = 0.200 M θ= 0.4◦ [Al(OH)4−]T = 0.250 M/[OH−]T = 0.200 M θ= 0.0◦ [OH−]T = 0.200 M θ= 0.0◦
The first solution contained heptagluconate dissolved in sodium hydroxide to avoid lactonization. This way the ligand is mainly in the form of Hpgl– and the extent of deprotonation, referring to one of the alcoholic OH groups, was ∼37%.
The other two solutions were control measurements with components not contributing directly to the rotation power.
This approach ensured, that the observed change in the degrees of rotation was exclusively caused by the metal–
ligand interaction.
Keeping the specific rotation of Hpgl– constant, the evaluation of polarimetric data with the software PSEQUAD were carried out. First the model obtained by potentiometry was fitted, considering the possible species forming in the highly alkaline region (pH∼13). Accordingly, fitting Al(OH)4Hpgl2−, Al(OH)5Hpgl3− and Al(OH)5Hpgl24−
resulted FP = 0.34°. The systematic deviation between the calculated and measured optical rotation gradually increased with higher [Hpgl–]T, implying the existence of additional (polynuclear) species. Supposing the formation of Al3(OH)13Hpgl62−, yielded FP = 0.12°and logβ32-1 = –6.56(36). The inclusion of this trinuclear species significantly reduced the deviation depicted on Fig. 3, as well as the fitting parameter, which is thus comparable with the range of error. However the relatively large standard deviation maybe caused by the high correlation of the included species.
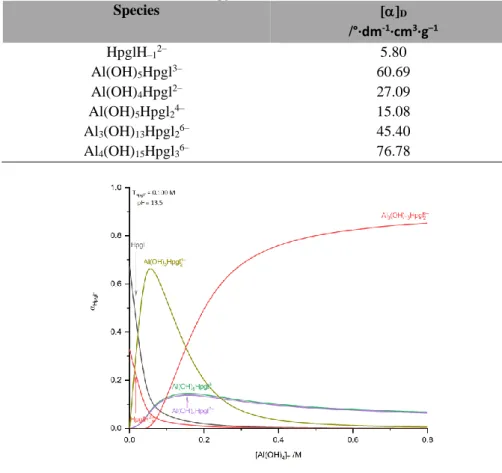
Table S1 Specific rotation of the individual species forming in the Al(OH)4– – Hpgl– system. Experimental conditions: T = (25±2)°C and I = 4 M (NaCl). Total concentrations: [Al(OH)4−]T = 0 – 0.800 M and [Hpgl−]T = 0.100 – 0.400 M.
Species []D
/°∙dm-1∙cm3∙g–1
HpglH–12– 5.80
Al(OH)5Hpgl3– 60.69
Al(OH)4Hpgl2– 27.09
Al(OH)5Hpgl24– 15.08
Al3(OH)13Hpgl26– 45.40
Al4(OH)15Hpgl36– 76.78
Figure S4 Speciation diagram as a function of [Al(OH)−4 ]T in regard to Hpgl–. The calculations were on the basis of stability constants provided in Table 1., corresponding to T = (25±0.1)°C and I = 4 M (NaCl). Total concentrations: [Al(OH)−4 ]T = 0 – 0.800 M and [Hpgl−]T = 0.100 M.
Figure S5 Speciation diagram as a function of [Al(OH)−4 ]T in regard to Hpgl–. The calculations were on the basis of stability constants provided in Table 1., corresponding to T = (25±0.1)°C and I = 4 M (NaCl). Total concentrations: [Al(OH)−4 ]T = 0 – 0.800 M and [Hpgl−]T = 0.200 M.
Figure S6 Speciation diagram as a function of [Al(OH)−4 ]T in regard to Hpgl–. The calculations were on the basis of stability constants provided in Table 1., corresponding to T = (25±0.1)°C and I = 4 M (NaCl). Total concentrations: [Al(OH)−4 ]T = 0 – 0.800 M and [Hpgl−]T = 0.400 M.
Figure S7 Speciation diagram as a function of pHc ((= log ([H+]/cø) with regard to Al(III). The calculations were performed using the stability constants provided in Table 1, corresponding to T = 25 °C and I = 4 M (NaCl). Total concentrations: [Al(OH)4−]T = 0.002 M, [Hpgl−]T = 0.004 M.
S2. Freezing Point Depression measurements
Additional experimental data were collected to reinforce the calculated speciation in our target solutions. This simple method proved to be handy to support the results obtained by other experimental methods.[1] The Freezing point depression, being a colligative property, in relatively dilute solutions is proportional to the total concentration of the ions:
Δ𝑇f,theo= 𝐾f∙ ∑𝑛𝑖=1[𝑋𝑖]T, (S1)
where Kf is the cryoscopic constant for water (which is taken 1.86°C· M–1, and the term P
[Xi]T refers to the total
i=1 concentration of discreet ions in the solution. If the number of solute particles decreases, e.g. complex formation takes place, the freezing point depression also decreases. The measured value corresponds to the sum of equilibrium concentrations:
Δ𝑇f,meas= 𝐾f∙ ∑𝑛𝑖=1[𝑋𝑖]. (S2)
In order to quantify the difference between the theoretical (i.e. assuming full dissociation) and the observed values, the following equation could be used:
ΔΔ𝑇f= 𝑇f,theo− 𝑇f,meas= 𝐾f∙ ∑𝑛𝑖=1([𝑋𝑖]T− [𝑋𝑖], (S3) where ∆∆Tf refers to the extent of particle decrease, therefore to the extent of association. This parameter and the measured FPD values for solutions with various NaAl(OH)4, NaHpgl, NaOH and NaCl are presented in Table S1.
Examining the first seven solutions, which are exclusively strong electrolytes, the value ∆Tf,meas agrees well with those calculated assuming the full dissociation of the particles (∆Tf,theo). In these solutions the ∆∆Tf value refers to the uncertainty of the method and can be taken as 0.14°C considering the range of experiments. In solutions containing both Al(OH)−4 , Hpgl– and OH–, starting from composition No. 8, the parameter ∆∆Tf is significantly higher (at least two times), than the uncertainty of the method. Since this parameter indicates the magnitude of association, its increment may be attributed to complex formation. Regarding the first Al(OH)−4 –dependent solution series (No. 9.– 13.), the value of ∆∆Tf increases until 3:2 metal:ligand ration, where the speciation curve of Al3(OH)13Hpgl62− reaches
its saturation point (Fig. S2), hence the change of ∆∆Tf could be mainly credited to the formation of Al3(OH)13Hpgl62− species.
In order to attest the performance of the suggested model, the number of particles in the solutions, consequently the expected freezing point depression values (∆Tf,calc presented in Table S1), were calculated on the basis of
compositions and stability constants presented in Table 1, with the aid of PSEQUAD software. Although the ionic strength and the temperature of the solutions, where the stability constants were obtained at, were rather different than that of during the FPD experiments (which comes inherently from the nature of the applied method), the observed and predicted values agree reasonably well with the observed ones. Therefore these calculations further confirm the validity of the obtained speciation model.
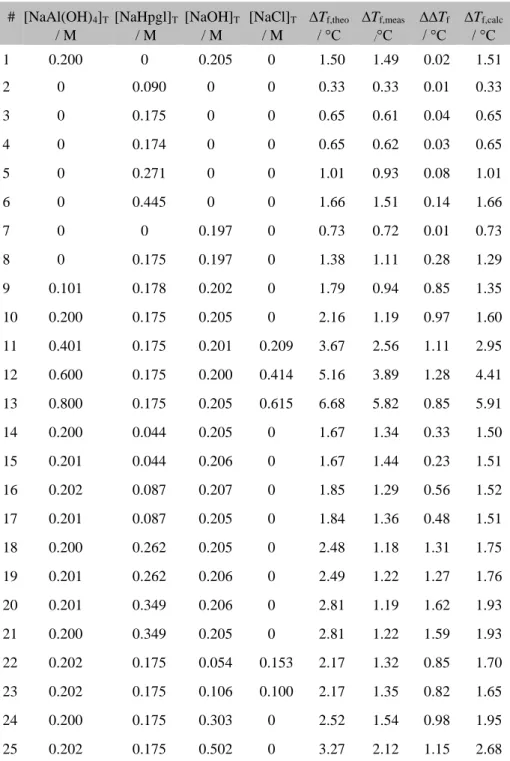
Table S2 Freezing point depression measurements for the system containing various amounts of NaAl(OH)4, NaHpgl, NaOH or NaCl. ∆∆Tf
refers to the difference between the theoretical (∆Tf,theo, calculated by assuming complete dissociation of each compound) and measured (∆Tf,meas) FPD. The term ∆∆Tf is the extent of particle decrease. The calculated FPD values are listed in column ∆Tf,calc.
# [NaAl(OH)4]T
/ M
[NaHpgl]T
/ M
[NaOH]T
/ M
[NaCl]T
/ M
∆Tf,theo
/ °C
∆Tf,meas /°C
∆∆Tf
/ °C
∆Tf,calc
/ °C
1 0.200 0 0.205 0 1.50 1.49 0.02 1.51
2 0 0.090 0 0 0.33 0.33 0.01 0.33
3 0 0.175 0 0 0.65 0.61 0.04 0.65
4 0 0.174 0 0 0.65 0.62 0.03 0.65
5 0 0.271 0 0 1.01 0.93 0.08 1.01
6 0 0.445 0 0 1.66 1.51 0.14 1.66
7 0 0 0.197 0 0.73 0.72 0.01 0.73
8 0 0.175 0.197 0 1.38 1.11 0.28 1.29
9 0.101 0.178 0.202 0 1.79 0.94 0.85 1.35
10 0.200 0.175 0.205 0 2.16 1.19 0.97 1.60
11 0.401 0.175 0.201 0.209 3.67 2.56 1.11 2.95 12 0.600 0.175 0.200 0.414 5.16 3.89 1.28 4.41 13 0.800 0.175 0.205 0.615 6.68 5.82 0.85 5.91
14 0.200 0.044 0.205 0 1.67 1.34 0.33 1.50
15 0.201 0.044 0.206 0 1.67 1.44 0.23 1.51
16 0.202 0.087 0.207 0 1.85 1.29 0.56 1.52
17 0.201 0.087 0.205 0 1.84 1.36 0.48 1.51
18 0.200 0.262 0.205 0 2.48 1.18 1.31 1.75
19 0.201 0.262 0.206 0 2.49 1.22 1.27 1.76
20 0.201 0.349 0.206 0 2.81 1.19 1.62 1.93
21 0.200 0.349 0.205 0 2.81 1.22 1.59 1.93
22 0.202 0.175 0.054 0.153 2.17 1.32 0.85 1.70 23 0.202 0.175 0.106 0.100 2.17 1.35 0.82 1.65
24 0.200 0.175 0.303 0 2.52 1.54 0.98 1.95
25 0.202 0.175 0.502 0 3.27 2.12 1.15 2.68
S3. Nuclear Magnetic Resonance Spectroscopy
Figure S8 13C NMR spectra of solutions containing [Al(OH)−4 ]T = 0.200 M and [Hpgl–]T = 0.200 M as a function of the nominal pH at 25°C±
1°C
Figure S9 1H NMR spectra of solutions containing [Hpgl–]T = 0.200 M as a function of [Al(OH)−4 ]T at pH = 4 and 25°C± 1°C
Figure S10 13C NMR spectra of solutions containing [Hpgl–]T = 0.200 M as a function of [Al(OH)−4 ]T at pH = 4 and 25°C± 1°C
Figure S11 1H NMR spectra of solutions containing [Hpgl–]T = 0.200 M as a function of [Al(OH)−4 ]T at pH = 8 and 25°C± 1°C
Figure S12 13C NMR spectra of solutions containing [Hpgl–]T = 0.200 M as a function of [Al(OH)−4 ]T at pH = 8 and 25°C± 1°C
Figure S13 1H NMR spectra of solutions containing [Hpgl–]T = 0.200 M as a function of [Al(OH)−4 ]T at pH = 12 and 25°C± 1°C
Figure S14 13C NMR spectra of solutions containing [Hpgl–]T = 0.200 M as a function of [Al(OH)−4 ]T at pH = 12 and 25°C± 1°C
References
[1] A. Pallagi, É. G. Bajnóczi, S. E. Canton, T. Bolin, G. Peintler, B. Kutus, Z. Kele, I. Pálinkó, P. Sipos, Multinuclear Complex Formation between Ca(II) and Gluconate Ions in Hyperalkaline Solutions, Environmental Science & Technology 48 (12) (2014) 6604–6611. doi:
10.1021/es501067w.
URL https://doi.org/10.1021/es501067w
[2] Aluminium, Gallium, Indium and Thallium, in: P. L. Brown, C. Ekberg (Eds.), Hydrolysis of Metal Ions, Wiley-VCH Verlag GmbH & Co.
KGaA, Weinheim, Germany, 2016, pp. 757–834. doi:10.1002/9783527656189.ch13.
URL http://doi.wiley.com/10.1002/9783527656189.ch13
[3] D. Rossiter, D. Ilievski, P. Smith, G. Parkinson, The mechanism of sodium gluconate poisoning of gibbsite precipitation, Transactions of the Institution of Chemical Engineers /A 74 (A7) (1996) 828–834.
[4] K. Beckham, P. Clarke, R. Cornell, INHIBITION OF GIBBSITE CRYSTALLIZATION: ADSORPTION OF THE GLUCONATE ION, Proceedings of the 7th International Alumina Quality Workshop (2005) 263.
![Figure S3 Measured pHc values (= log ([H + ]/c ø ) as a function of added titrant volume in solutions consisting of heptagluconate and NaOH](https://thumb-eu.123doks.com/thumbv2/9dokorg/998586.61829/2.892.276.626.753.1043/figure-measured-values-function-titrant-solutions-consisting-heptagluconate.webp)
![Figure S5 Speciation diagram as a function of [Al(OH) − 4 ] T in regard to Hpgl – . The calculations were on the basis of stability constants provided in Table 1., corresponding to T = (25±0.1)°C and I = 4 M (NaCl)](https://thumb-eu.123doks.com/thumbv2/9dokorg/998586.61829/4.892.280.622.185.465/figure-speciation-function-calculations-stability-constants-provided-corresponding.webp)
![Figure S7 Speciation diagram as a function of pH c ((= log ([H + ]/c ø ) with regard to Al(III)](https://thumb-eu.123doks.com/thumbv2/9dokorg/998586.61829/5.892.279.615.163.437/figure-speciation-diagram-function-log-regard-al-iii.webp)
![Figure S8 13 C NMR spectra of solutions containing [Al(OH) − 4 ] T = 0.200 M and [Hpgl – ] T = 0.200 M as a function of the nominal pH at 25°C±](https://thumb-eu.123doks.com/thumbv2/9dokorg/998586.61829/7.892.270.621.234.527/figure-nmr-spectra-solutions-containing-hpgl-function-nominal.webp)
![Figure S10 13 C NMR spectra of solutions containing [Hpgl – ] T = 0.200 M as a function of [Al(OH) − 4 ] T at pH = 4 and 25°C± 1°C](https://thumb-eu.123doks.com/thumbv2/9dokorg/998586.61829/8.892.275.619.164.439/figure-nmr-spectra-solutions-containing-hpgl-function-al.webp)
![Figure S12 13 C NMR spectra of solutions containing [Hpgl – ] T = 0.200 M as a function of [Al(OH) − 4 ] T at pH = 8 and 25°C± 1°C](https://thumb-eu.123doks.com/thumbv2/9dokorg/998586.61829/9.892.274.620.165.442/figure-nmr-spectra-solutions-containing-hpgl-function-al.webp)
![Figure S14 13 C NMR spectra of solutions containing [Hpgl – ] T = 0.200 M as a function of [Al(OH) − 4 ] T at pH = 12 and 25°C± 1°C](https://thumb-eu.123doks.com/thumbv2/9dokorg/998586.61829/10.892.272.620.164.445/figure-nmr-spectra-solutions-containing-hpgl-function-al.webp)
