József Varga – Sándor Kenyeres
Current Questions of the Transformation of
Hungarian Taxation
Summary
In this paper the authors provide an international comparison of the Hungarian tax system. The main claim made in this publication is that although taxes are relative- ly high in Hungary compared to the regional competitors, and this seriously affects Hungary’s competitiveness, the recent years have seen a number of positive develop- ments in changing the tax system and eliminating the asymmetries of consumption and work-related taxes. This paper provides an in-depth analysis of the transformation of the Hungarian tax system between 2008 and 2017. It sets forth a set of possible tools for reducing the shadow economy and presents the significant measures taken to that effect in Hungary. At the end of the paper, the authors provide an analysis of the para- digm change envisaged in 2018, which will have a substantial impact on the future, and briefly discuss the most important upcoming changes in taxation.
Journal of Economic Literature (JEL) Codes: H20, H25, H26
Keywords: Hungarian tax system, tax regime, tax reduction, tax on labour, whitening the economy, change of taxation paradigm
Dr József Varga, Associate Professor, University of Kaposvár and Corvinus Univer- sity of Budapest (varga.jozsef@ke.hu); Dr Sándor Kenyeres, Honorary Associate Professor, chartered tax consultant, University of Sopron (sandor@kenyeres.hu).
Introduction
After the 2008 financial crisis, the transformation of Hungarian taxation has accel- erated. In the first part of the paper a diagnostic review of Hungarian tax rates are provided in an international comparison. It is concluded that tax rates are approx.
40%, by nearly 10 percentage points, higher than the average rate applied in the sur- rounding competitor countries (EP, 2016).
Since 2008, the structure of the Hungarian tax system has undergone significant transformation. Between 2004 and 2008, work-related taxes rates increased and con- sumption taxes declined. After 2008, however, these trends reversed: turnover and consumption tax rates began to rise, while the rate of work-related taxes started to decline. Currently, the latter trend is still ongoing.
The Hungarian tax system in an international comparison
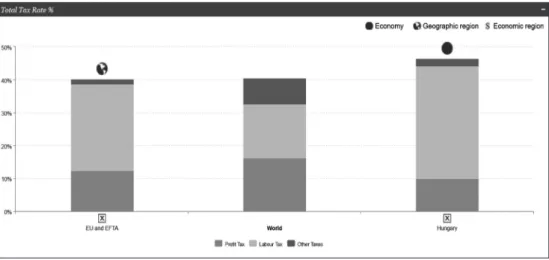
In an international comparison, Hungarian enterprises pay high taxes: in 2016, the average tax rate was 48.4%, with the world average being 40.8%, and the average rate in the EU and EFTA Member States being 40.6% (PwC, 2016). In 2017, this rate was 46.5% in Hungary and 40.3% in the EU and EFTA Member States, with the world average being 40.6% (PwC, 2017). A careful analysis of the data, shown in Figure 1, reveals a particularly significant correlation. While the world average profit tax and work-related tax rates are equal, both being 16.3% (the average rate of other taxes is 8.0%), in Hungary, the profit tax is only 9.9%, but the employment tax rate is as high as 34.3% (with other tax rates being 2.3%). Thus, work-related taxes are more than double the world average. In the literature on Hungarian taxation, it has been pointed out on numerous occasions (e.g. Csomós and P. Kiss, 2014; Balog, 2014) that in light of the above data, it is imperative to cut work-related taxes in order to reduce the illicit economy and to increase Hungary’s competitiveness.
There is also a striking difference between the time periods required to comply with tax liabilities (Figure 2). In 2016 the world average was 261 hours, the average of the EU & EFTA Member States was 173 hours, and the average in Hungary was 277 hours (PwC, 2016). According to the data provided in the PwC (2017) publica- tion, the world average time to comply with tax liabilities was 254 hours, the average of the EU & EFTA Member States was 164 hours, and the corresponding value remained unchanged at 277 hours in Hungary. Figure 2 also provides information on the ratio of the time required to comply in each of the three tax types: in Hungary, time required to comply only with work-related tax liabilities was nearly as high (146 hours) as the time to comply with all tax liabilities in the EU & EFTA Member States (164 hours).
A useful indicator for assessing a country’s tax rates is obtained by establishing the ex- tent of state intervention, which is another important area in economic policy. A country- by-country comparison of government revenues as a percentage of GDP ranks Hungary among the countries imposing higher burdens, as in 2015 its revenue-to-GDP ratio was
Figure 1: Total tax rates (world, EU & EFTA, Hungary)
Source: PwC, 2017 Figure 2: Time to comply
Source: PwC, 2017
48.2%. However, this rate is not as spectacularly high as the other areas of taxes analysed above: for example, Denmark (53.9%), France (53.5%), Finland (54.9%) and Norway (55.2%) all have higher ratio than Hungary and are therefore ranked higher. As a perceptible positive trend, in 2016 this value fell to 44.8%in Hungary (HCSO, 2016).
While the above-mentioned countries precede Hungary in terms of per capita GDP, the Czech Republic, Croatia and Slovakia have revenue-to-GDP ratios slightly exceeding 40%, lower than Hungary. The correlation between high economic growth rates and more moderate state intervention witnessed during the past decade in coun- tries of the Visegrád Group (V4) should be taken into consideration for the develop-
ment of Hungary’s economic policies. For Hungary, it is especially the example set by Poland that seems to be the path to follow, with a revenue-to-GDP rate under 40%.
Another relevant area is the development of tax revenues as a proportion of GDP in Hungary. According to the study entitled “Overview: the European Parliament’s Work on Taxation” (EP, 2016), the total tax revenue in Hungary contributes 39.2% to GDP. In a breakdown, 18.5% of GDP comes from direct taxes, including income taxes, while 7.5% from indirect taxes (VAT and consumption taxes). Consumption taxes and work-related costs have an approximately equal share in the total tax revenue.
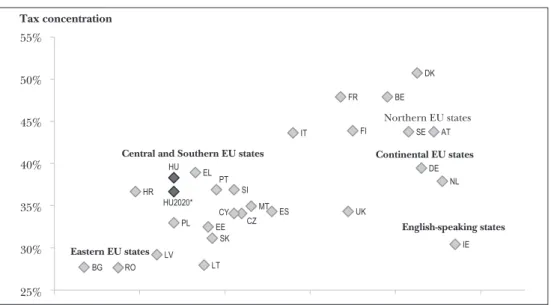
In Hungary taxes are high compared to other countries in the region: relative to 39.2% in Hungary, Slovakia (28.3%), Romania (28.3%), the Czech Republic (35%), Poland (32.5%) and Bulgaria (27.9%) all have lower rates to GDP (EP, 2016), and moreover. The situation caused by high taxes is further aggravated by the fact that the in Hungary the per capita GDP at a Purchasing Power Standard is merely 68% of the EU average. In contrast, the taxes levied in Poland and the Czech Republic only amount to 32-33% and 35%, respectively, with similar or significantly higher GDP (Fig- ure 3). Based on fiscal statistics, it can be concluded that over the short term, Hungary should aim to close the gap to Poland in tax rates (Varga, 2017).
Figure 3: Correlation between taxes and GDP in Europe
GDP in PPS (100%=EU average) Eastern EU states
Central and Southern EU states Continental EU states Northern EU states
English-speaking states Tax concentration
55%
50%
45%
40%
35%
30%
25%
Note: GDP in PPP (average of EU= 100%) Source: Izer, 2016
Potential methods of reducing the shadow economy in Hungary
In the international reputation of Hungary, the size of the shadow economy is an im- portant factor. In 2015, the ratio of the hidden economy as a proportion of GDP was
still in the range of 22-23% (Figure 4) in Hungary. According to Schneider (2012), 35-38% of the shadow economy results from the increase in taxes and social security contributions (Balog, 2014). In comparison to Hungary’s regional partners, the size of the shadow economy is 6-8 percentage points lower in Slovakia and the Czech Re- public, while 1-2 percentage points higher in Poland.
Figure 4: Shadow economy in Europe, as a percentage of GDP
31.0 28.1 28.0 27.2 27.1 27.1 25.7 24.7 24.0 23.5 23.5 23.3 21.6 20.8 18.7 18.5 18.3 16.1 15.3 14.6 13.6 13.1 12.9 12.8 12.2 11.8 10.8 9.6 9.2 8.1 7.8 6.9
0.0 5.0 10.0 15.0 20.0 25.0 30.0 35.0
Bulgaria Romania Croatia Turkey Lithuania Estonia South-Cyprus Latvia Malta Poland Slovenia Greece Hungary Italy Portugal Spain Average Belgium Czech Republic Slovakia Sweden Norway Finland Denmark Germany Ireland France United Kingdom Netherlands Luxembourg Austria Switzerland
Size of the shadow economy (in % of GDP)
Source: Schneider et al., 2015
Based on the work of Schneider et al. (2015), in his presentation Izer (2016) ranks Hungary in the middle of the list of European countries in terms of shadow economy size. The authors of the underlying study claim that the size of the shadow economy cannot be reduced through economic, legal, management or psychological means alone; addressing it requires an interdisciplinary approach. Domokos indicates that in recent years, the shadow economy in Hungary has shrunk to 20-21 percent of GDP from a previous 24 percent (Hvg.hu, 2016). A further 5-percent reduction is expected to yield an additional HUF 500-600 billion in revenues. Balog (2014) points out that a high tax morale clearly reduces the size of the shadow economy, as in such a case, taxpayers do not participate in the operation of the black market even though they would benefit from tax fraud.
Lower taxes presumably contribute to an improved tax morale. An important ele- ment of improving the tax morale is for taxpayers to be aware that the taxes they pay serve the right social causes, which they also support. This underlines the importance of consideration in spending public funds. As shown by Domokos, Németh and Ja- kovác (2016, p. 25), “the audit findings of the State Audit Office confirm that the control systems of both public entities and state-owned business associations need to be improved significantly in order to ensure good governance and public sector
management. All these call for a paradigm shift; new horizons should be opened up in the public sector management approach. It is indispensable to ensure that the per- formance of organisations entrusted with the management of public funds or public assets is transparent, accessible and measurable, because this is the only way to ensure successful, efficient, economical and sustainable public management, and thus, to increase social welfare”.
The measures taken in Hungary in the recent years with the aim to improve the efficiency of tax audits mainly focused on preventing the concealment of corporate incomes. The most efficient such measures include the introduction of online cash registers, the tax registration procedure, and the capping of cash payments between companies and the system of tax summaries. In order to prevent the concealment of incomes, a number of measures have been introduced after 2010 (structural changes, the transformation of the tax system, enabling the tax authority to collect information, the ability to focus tax audits on high-risk activities and taxpayers). Among structural changes, the most important step was the merger of the tax and customs authorities.
Establishing an adequate framework for taxation is more difficult at a European Union level due to the conflicting interests of the Member States. Within the EU, community trade in goods and its insufficient documentation is an important area with regard to value-added tax fraud. The European community has been unable to introduce a uni- form system for the submission date and contents of VAT returns (Varga, 2017).
In the existing VAT system, due to the disappearance of the VAT content of de- clared incomes, a reverse charge mechanism has been introduced in many areas where fraud is highly prevalent. In such a system, VAT is not passed on by the issuer of the invoice. The buyer is liable to pay and is entitled to deduct VAT at the same time. This prevents budget deficit from the VAT system. When supported by proper controls, this system can work efficiently. The more products are included in the re- verse charge system, the less VAT retains its value-added nature (Act CXXVII of 2007 on Value Added Tax).
In order to allow the tax authority to set up its data collection activities, IT devel- opments need to be made and the legal environment needs to be established first.
An efficient tool in fighting income concealment was the introduction of the system of itemized domestic VAT summary statements. This requires taxpayers to submit an itemized statement on the data of invoices containing VAT above a certain value limit.
At the time of introduction, the threshold for obligatory reporting was HUF 2 mil- lion, currently it is HUF 1 million. It was supposed to be changed to HUF 100,000 as of July 2017, but it has been deferred to July 2018. These reports must be submitted both by sellers and buyers. In order to check VAT declaration liabilities in advance, the Electronic Trade and Transport Control System was established to tracks the move- ment of goods on public roads (Varga, 2017).
An efficient way to reduce the illicit economy was the requirement of the use of online cash registers. While the previously discussed systems concerned B2B trade, the objective of online cash registers serves the fight against hidden B2C trade. The so-called online invoicing system is expected to yield results similar to those of online
cash registers (Csíki, 2016). The amendments made to Act XCII of 2003 on the Rules of Taxation now provide a legal framework so that tax audits can focus on high tax evasion risk activities and risky taxpayers.
The activities performed in the “black” and “grey” economies are not document- ed in the national accounts. If an economic event has been registered and declared in a certain tax category, it will inevitably appear in regard of all other forms of tax. Eco- nomic turnover data need to appear turnover tax declarations. Controlling turnover taxes is of particular importance in this regard.
Every year, the European Union assesses Member States’ value-added tax deficit. The analysis is based on the rate of VAT Total Tax Liability (VTTL), calculated from data on national income. The net basis of assessment is calculated first, which gives the VTTL by applying the weighted tax rate average to it. This is then compared to the actual amount of value-added tax collected. The difference between the two gives the value-added tax deficit (VAT Gap), which is displayed as a percentage amount in order to facilitate com- parison among Member States (CASE, 2017). In terms of the VAT Gap, Hungary is show- ing an improving trend. Analyses regarding the year 2015 were finalized in 2017.
Figure 5: VAT gap in Hungary, 2011-2015
21% 22% 21%
17%
14%
0%
5%
10%
15%
20%
25%
0 1 000 000 2 000 000 3 000 000 4 000 000 5 000 000
2011 2012 2013 2014 2015
GAP % VTTL Revenues
Note: VTTL and Revenues on the left axis, GAP% on the right axis Source: CASE, 2017
The Figure 5 shows that the VAT gap decreased significantly, from 21% to 14%, between 2011 and 2015. Results for the year 2015 already show the effects of meas- ures taken in recent years to reduce the illicit economy. These include the introduc- tion of the Electronic Trade and Transport Control System (ETTCS), lowering of the threshold of obligatory reporting from HUF 2 million to the current HUF 1 million, considering itemized domestic VAT summary statements and the impact of the re- verse inland charged tax. The EU study confirms that the steps taken to reduce the economy are effective in case of turnover taxes.
New steps in the Hungarian tax structure
In Hungary from 2008, especially from 2010, we can observe a significant transforma- tion of the tax system. Lentner’s (2016a) study denominates the 2010 tax revulsion as one of the three key economic policy revolutions of the past fifty years. One of the most important areas of tax redistribution is the discontinuity of the tax path, in which the proportion of taxes on work in Hungary between 2004 and 2008 has been increasing, the proportion of consumption taxes has been decreasing. After 2008 this trend reversed: the proportion of turnover and consumption taxes increase and the proportion of taxes on labour declines.
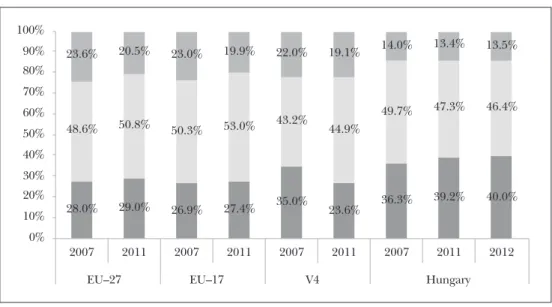
The examination of all incomes and consumption taxes is a relevant economic is- sue. Csomós and P. Kiss’s (2014) study shows that the weight of consumption taxes both in the European Union and considering the V4 countries throughout 2007 and 2011 has steadily increased over the period under Council Directive 2006/112/EC. While the weight of these taxes inside all tax revenues grew by 1 percentage point in the EU, by 1.2 percentage points in the V4 countries, in Hungary it grew by 3.7 percentage points (Figure 6). At the same time the weight of work-related taxes has been reduced by 3.3 percentage points in Hungary. This trend shows the government’s intention to create a work-based society and lower the tax and contribution burden on labour.
Figure 6: Changes in tax regimes considering the EU, V4 and Hungary
28.0% 29.0% 26.9% 27.4% 35.0%
23.6% 36.3% 39.2% 40.0%
48.6% 50.8% 50.3% 53.0% 43.2%
44.9%
49.7% 47.3% 46.4%
23.6% 20.5% 23.0% 19.9% 22.0% 19.1% 14.0% 13.4% 13.5%
0%
10%
20%
30%
40%
50%
60%
70%
80%
90%
100%
2007 2011 2007 2011 2007 2011 2007 2011 2012
EU–27 EU–17 V4 Hungary
Note: Bottom: taxes on consumption to total taxes, in the middle: work-related taxes to total tax Source: Csomós and P. Kiss, 2014
Considering the domestic tax system, it is necessary to mention the special taxes playing a particular role in it. As shown by Matolcsy (2014), some of the special taxes, also considered to be sectoral taxes, are, in fact, turnover and consumption taxes (e.g.
telecommunication tax, financial transaction tax, insurance tax), another part are wealth taxes (e.g. public utility tax), and a third part are capital taxes (e.g. bank taxes and income tax on energy supplies).
In his study Lentner (2016b) analyses the situation of special taxes in connection with the relevance of widening the tax base. According to Bozsik (2014), the special taxes levied in the sector have a major role in the Hungarian tax system, as in addi- tion to providing a significant budget revenue, they reduce profit-repatriation. The 2017 unification of the corporate tax rate in Hungary was a significant step in shifting from consumption taxes towards work-related taxes. In the case of enterprises with a net sales revenue of HUF 500 million, this means a 10 percentage point decrease compared to the previous 19%. In the case of companies with a net turnover of up to HUF 500 million, this results in a 1 percentage point decrease. For sole entrepre- neurs the personal income tax was also set at 9%. With this step, Hungary has placed itself among the most favourable countries in terms of corporate tax rates, actually applying the lowest corporate tax rate among the EU Member States (Figure 7).
Figure 7: Upper limit of corporate tax rates in 2015 and the Hungarian tax rate in 2017
0 5 10 15 20 25 30 35 40
0 5 10 15 20 25 30 35
40 % %
FR MT BE DE PT ES IT GR AT NL DK LU SK SE HR EE FI GB CZ HU PL SI RO LV LI IE BGHU
2015 CY 2017
IS NO
Source: Mosberger, 2017
In terms of taxes small and medium-sized enterprises (SME) is an important factor of the long-term health of the economy, especially considering the employment. Posi- tive changes in taxation have also been made in this area. The taxes imposed on the SME sector between 2010 and 2015 have reduced from 57.5% to 48.4% (György and Veress, 2016). The taxes payable by the SME sector were also decreased significantly due to the indirect effect of simplified taxation. Another significant cut for this sector included reduction of the rate of the social contribution from 27% to 22%. Reducing the social contribution can also have a positive impact on employment, especially in the industries in which labour cannot be replaced by a cheaper solution (Ambrus,
2016). It is not negligible that through the 5% reduction in the tax wedge, the rate payable by the employer has decreased relative to the employee’s obligations. This measure is expected to contribute to the moderation of work-related duties and in- crease the competitiveness of Hungary over the long term.
2018: Paradigm shift in taxation
In addition to tax restructuring, the efficiency of tax collection is also being improved.
The goal is to make the submission of tax returns and payments unavoidable. On 1 January 2018, the Hungarian economy woke up in a significantly different country.
The administrative procedural law has been changed, independent administrative arbitration has been launched, and new civil law has been created. The structure of the procedural rules for taxation has been changed completely. The Act on the General Public Administration Procedures (CL of 2016) is no longer considered as the underlying law of tax laws. The regime preceding 2017 and set out in the Act on Taxation, supplemented by the necessary elements of administrative regulation, was divided and included in three procedural laws: the Act on the Rules of Taxation (CL of 2017), the Act on Tax Administration Procedure (CLI of 2017) and the Act on the Implementation of Tax Administration (CLIII of 2017).
The structural changes in procedural law is characterized by the fact that transi- tion is governed by a separate law and the ongoing cases are judged on the basis of the previous legislation. In addition to the changes of procedural rules, companies are obliged to use a new electronic interface (business gateway), however, there is a one-year moratorium granted for these taxpayers to do so.
There is a paradigm shift in taxation. Before 2017, the tax authority acted in a follow- up approach: after completion of a transaction the taxpayer reported and paid or settled the tax. The tax authorities had access to the aggregate data for the reporting period after reporting. Specific information on the transaction was only recognized through a single audit. In the current system, applied from mid-2018, it will be mandatory to report transactions real-time in an increasing number of cases. Transactions must be reported to the tax authorities simultaneously with issuing the bill, done automatically by billing programmes. According to the draft act, entities failing to issue invoices using a computer programme will be required to submit the relevant data on appropriate granted forms.
Employment-related data services have already been fully operating for several years, and allow the tax authority to monitor the transactions and review them before the submission of tax returns. The aim is to compel high-risk taxpayers to comply with the law.
In addition, the above-mentioned radical transformation of the tax system con- tinues. In order to improve the structure of consumption, fish, fish offal, pork offal, catering and locally made non-alcoholic beverages are subject to 5% VAT. To spread electronic services, the use of internet may also be included in the 5% bracket.
The additional reduction in employment taxes is a welcome development in 2018.
The social contribution rate has been decreased from 22% to 19.5%. The effects of this have been fed through the tax and contribution system. The taxes payable by
small tax payers have not decreased, but the value limits to the payable taxes has been increased in accordance with the decreasing levels of social contribution. The social contribution payable on certain types of incomes only includes health contribution, and its rate has also been decreased to 19.5%. So, from 2018 onwards, the employer’s burdens related to the employment have been reduced significantly.
Although the contribution to sickness benefits are additional sources for the budg- et, and consequently the supply system, it does not serve the employer’s interests. Its modification in the near future can significantly simplify conditions.
Any increase in the average wage also increases the employer’s burdens. The in- creases performed in the minimum wage (from HUF 127,500 to HUF 138,000 per month, representing an 8% rise) and in the guaranteed minimum wage (from HUF 161,000 to HUF 180,500 per month, representing 12%) are significant. Social con- tributions decreased by 2.5%, which, in case of low wages, cannot offset the effects of compulsory wage increases. This might have a negative impact on employment in sectors with low incomes.
Considering capital gains the obligation to pay health contribution is unconven- tional. Bank interests were discharged in 2017. The paradigm shift should also in- clude the transformation of taxes and other burdens.
The tax paradigm shift will be implemented by:
– Transforming the tax audit system – Completion of tax reporting services
– Moving the emphasis from income taxes to consumption taxes – Using advanced information technology.
The new regime will prevent tax evasion. Tax returns will be prepared automati- cally by the tax authority and will only require minimal personal contribution from taxpayers. Taxpayers will have to provide detailed information on every economic event. So far, the tax authority was only allowed to act officially after the submission of tax returns. In the future, it will have real-time information on all economic processes and will prepare taxpayers’ settlements on that basis. Taxpayers’ data service must be continuously monitored.
References
Ambrus, Rita Anna (2016): A foglalkoztatás ár(nyék)a [The price (shadow) of employment]. In: Böcskei, Elvira (ed.): Etikus közgazdasági gondolkodás és versenyképesség [Ethical economic thinking and competi- tiveness]. Károli Gáspár Református Egyetem, Budapest, pp. 366-374.
Balog, Ádám (2014): Adóelkerülés és rejtett gazdaság Magyarországon [Tax evasion and shadow economy in Hungary]. Köz-Gazdaság, Vol. 9, No. 4, Special Issue, pp. 15-30.
Bozsik, Sándor (2014): A magyar adórendszer nemzetközi összehasonlításban, különös tekintettel a gaz- dasági válságra adott válaszra [The Hungarian tax regime in an international comparison, with special focus on response to the economic crisis]. In: Karlovitz, János (ed.): Kulturális és társadalmi sokszínűség a változó gazdasági környezetben [Cultural and social diversity in a changing business environment]. II. IRI Conference of Social Sciences, Nové Zámky, 25-26 April, pp. 52-61.
CASE (2017): Study and Reports on the VAT Gap in the EU-28 Member States. Final Report, Center for Social and Economic Research.
Csiki, Gergely (2016): Hatalmas fegyvert kap a kezébe a NAV-testvér [Brother tax authority is given a power- ful weapon]. Portfolio.hu, 31 August, 2016, https://www.portfolio.hu/gazdasag/adozas/hatalmas-fegy- vert-kap-a-kezebe-a-nav-testver.236585.html.
Csomós, Balázs and P. Kiss, Gábor (2014): Az adószerkezet átalakulása Magyarországon 2010-től [Transfor- mation of taxation in Hungary from 2010]. Köz-Gazdaság, Vol. 9, No. 4, Special Issue, pp. 61-80.
Domokos, László; Németh, Erzsébet and Jakovác, Katalin (2016): A kormányzás eredményességének támoga- tása. Célszerűség-vizsgálat és teljesítménymérés a számvevőszéki ellenőrzésekben ellenőrzésekben [Rea- sonableness test and performance test in the supervisions of the State Audit Office]. In: Németh, Er- zsébet (ed.): A jó kormányzás építőkövei. Fókuszban a legfőbb pénzügyi ellenőrző szerv, az Állami Számvevőszék [Building stones of good governance. The State Audit Office, the supreme financial supervisory organi- sation in focus.]. Állami Számvevőszék, Budapest.
EP (2016): Overview: The European Parliament’s Work on Taxation. European Parliament, www.europarl.
europa.eu/news/en/headlines/economy/20160502STO25468/overview-the-european-parliament-s- work-on-taxation
Eurostat (2017): Government revenue, expenditure and main aggregates. http://appsso.eurostat.
ec.europa.eu/nui/show.do?dataset=gov_10a_main&lang=en (accessed 12 January, 2017).
György, László and Veress, József (2016): The Hungarian Economic Policy Model After 2010. Public Finance Quarterly, Vol. 61, No. 3, pp. 360-381.
HCSO (2016): Az államháztartás bevételei összesen 2005-2016 [Government revenue 2005-2016]. Hungarian Central Statistical Office www.ksh.hu/docs/hun/eurostat_tablak/tabl/tec00021.html.
Hvg.hu (2016): Vélt korrupciót lát és fehéredő gazdaságot emleget az ÁSZ-elnök [The president of the State Audit Office sees fictitious corruption and mentions the shrinking of the shadow economy]. Hvg.hu, 27 December 2016, http://hvg.hu/gazdasag/20161227_velt_korrupciot_lat_es_feheredo_gazdasagot_em- leget_az_asz_elnoke.
Izer, Norbert (2016): A kormányzati adópolitika és az adóhatóság feladatrendszere [The government's tax policy and the responsibilities of the tax authority]. X. Soproni Pénzügyi Napok, Sopron.
Kenyeres, Sándor and Varga, József (2016): Az adóterhelés kifejezése a hozzáadottérték-adószinttel [Ex- pression of the tax burden by the level of value added tax]. Jura, Vol. 22, No. 2, pp. 263-272.
Lentner, Csaba (2016a): Nem konvencionális eszközök a magyar gazdaságpolitikában - vázlat hungariku- maink történeti, tudományos hátteréről [Unconventional instruments in Hungarian economic policy.
The outline of the historical and academic background to our Hungarian peculiarities]. In: Simon, János (ed.): Huszonöt éve szabadon Közép-Európában. Gazdaság, politika, jog [Twenty-five years of freedom in Central Europe: economy, policy, law]. Conference book, CEPoliti Kiadó, pp. 356-369.
Lentner, Csaba (2016b): A magyar gazdaság kilátásai 2025-re és 2050-re [Prospects of the Hungarian econo- my for 2025 and 2050]. In: Tóth, Attiláné and S. Gubik, Andrea (eds.): Magyarország 2025-ben és kitekintés 2050-re. Tanulmánykötet Nováky Erzsébet 70. születésnapjára [Hungary in 2025 and outlook for 2050. Studies for the 70th birthday of Erzsébet Nováky]. Arisztotelész Kiadó, Budapest, pp. 217-227.
Mosberger, Pálma (2017): Egykulcsos társasági adó hatása [Effects of the flat-rate corporate tax]. Magyar Nemzeti Bank, mnb.hu/letoltes/mosberger-palma-egykulcsos-tarsasagi-ado-hatasa.pdf.
Pesuth, Tamás (2014): Csendes adóforradalom Magyarországon? Interjú dr. Matolcsy György jegybankel- nökkel [Silent revolution in taxation in Hungary? Interview with central bank Governor Dr György Matolcsy]. Köz-Gazdaság, Vol. 9, No. 4, Special Issue, pp. 7-14.
Pitti, Zoltán (2008): The Operational Efficiency of the Fiscal System in Terms of Key Tax and Contribution Liabilities. Public Finance Quarterly, Vol. 53, No. 4, pp. 635-644.
PwC (2016): Paying Taxes 2016. Comparative modeller, www.pwc.com/payingtaxesmodeller.
PwC (2017): Paying Taxes 2017. Comparative modeller, www.pwc.com/payingtaxesmodeller.
Schneider, Friedrich; Raczkowski, Konrad and Mróz, Bogdan (2015): Shadow Economy and Tax Evasion in the EU. Journal of Money Laundering Control, Vol. 18, No. 1, pp. 34-51, https://doi.org/10.1108/jmlc- 09-2014-0027.
Varga, József (2017): Reducing the Tax Burden and Whitening the Economy in Hungary after 2010. Public Finance Quarterly, Vol. 62, No. 1, pp. 7-21.