Surveying Archaeological Sites and
Architectural Monuments with Aerial Drone Photos
András Molnár
Department of Applied Informatics, John von Neumann Faculty of Informatics, Óbuda University; Bécsi út 96/b, 1034 Budapest, Hungary; molnar@uni-obuda.hu
Abstract: Exploring castles, ruins or the tracks of settlements with aerial photographs has long been a well-known process. Drones can make significant progress in this area. The operating cost of a robotic aircraft is at least one order of magnitude lower than that of the cheapest small manned aircraft. It is possible to take high resolution images with them when flying extremely low compared to manned airplanes. The overflight of the area surveyed is far more efficient than with small manned aircraft, as thanks to the extremely small turning radius of drones, 90-95% of flight time is utilized, while this value in the case of small aircraft is 50-60, or possibly 70%. Of course, these benefits will primarily apply when exploring small areas (about 10-20 km2). In the case of surveying large areas, other benefits of manned aircraft (such as load bearing capacity, flight time) come to the forefront against the limited capabilities of drones.
Keywords: drone; 3D surface model; photogrammetry; orthophoto
1 Introduction
Due to the fact that those area sizes that can be effectively applied with drones generally dominate in archaeological explorations, their use allows for cost- effective aerial survey [1]. The small and lightweight robotic aircraft can not only be made at low cost, but their operation is also cheap. Another significant advantage is the small weight (up to 2-4 kg take-off mass) in case of possible accidents. The lightweight flying structure will not cause significant harm to either humans or to the object being surveyed. Due to the low costs, the replacement of the device is not burdensome either.
Based on experience in surveying, photographing a specific area (1-2 km2) can be accomplished with about 15-20 minutes of flight. The heights of the flights are determined by the resolution of the camera used, the frequency of image capture, the angle of view and cruising speed of the used robotic aircraft. For instance,
In many cases, traces of buildings that are now completely destroyed can still be detected on aerial photographs. In the case of areas under cultivation, during the shooting of the fresh plowing, the traces of the former walls of buildings appear in high contrast. The discoloration of the ground and its outlines are a good reference to the layout of the former building. As geo-referenced orthophotos are made during the surveying, the outlines are measurable and can be adapted to maps. The actual location of the onetime building can be specified when fitting to the map and the interpretation of the former descriptions can also be checked.
The method of processing the images (photogrammetry) also ensures the definition of the spatial location of individual pixels. Consequently, not only flat photographs, but also 3D models can be produced without the use of additional sensors. The resolution of the 3D models in the plane is the same as the resolution of the orthophotos and the depth is 3-4 cm/pixel. Spatial information can be used to perform a number of further refinements in relation to the found monuments.
Examples include surface models that have been cross-checked with written records, which can be used to infer the erosion effects of the past period. On the basis of the erosion-modified surface, it is possible to determine the exploration areas more precisely. Based on the model, the amount of soil to be removed from the given exploration area can also be defined, which makes it possible to plan the costs of earthwork preparing the exploration.
More accurate and more detailed survey of the remaining buildings or ruins can be done using multi-rotor robotic aircrafts. 3D mapping and archiving of building remnants protruding from the surface can also be done by the method of taking and processing aerial photographs. Since in this case, often very close photographs are needed (2-3 m distance from the object), a helicopter-type carrier is required.
The advantage of multi-rotor robotic aircraft against helicopters is their much simpler mechanical construction. Since spinning rotors have a fixed angle of incidence, the complex rotor mechanization essential for helicopter control is lagging behind. The stability and reliability of multi-rotor robotic aircraft equipped with modern control units is satisfactory enough to fly around and photograph the given objects from a sufficient proximity.
Although the flight performance of multi-rotor robotic aircraft is limited (useful weight is heavily limited and flight time is short compared to fixed-wing robotic aircraft), in the case of photographing buildings, the floating capability and the requirement for 1-2 m2 free landing area means an ideal carrier. The most important output when processing a plethora of overlapping photographs of a building or a ruin is a textured 3D model. This model is also suitable for accurate measurements after calibration. Further use of the textured 3D model is to archive the exact state [3] of the surveyed architectural monument.
Overall it can be stated and practical experience also shows that small robotic aircraft can provide useful additional data in a significant proportion of archaeological explorations [4]. It can also be considered that not only are they cost-effective in the assessment and archiving buildings or remnants of buildings, but they also provide new opportunities in terms of quality. Due to the rapid advances in technology and in particular robotic aircrafts, tools are expected to appear in the near future that are smaller, less susceptible to damage, require less specified knowledge and cheaper. This development will make robotic aircraft one of the basic tools for work in many areas of life, including archaeological excavations.
2 Photogrammetric Basics
Photogrammetry is almost as old as photography. Albrecht Meydenbauer [5, 6]
young architect was its first documented user and the creator of its name.
Simplified, with the help of the method in two or more images taken of the same object (area) but from a different perspective, different mappings of the same pixels (parallax) can, if certain conditions are met, determine the spatial position of the original object in a predefined coordinate system. The collinearity equations (1,2) and the rotation matrix (3) provide the relationship between a pixel in the image and its real spatial coordinate [7, 8]
(1) (2) where:
(X, Y, Z) field coordinates for the fixed spatial coordinate system, (X0, Y0, Z0) „0” coordinates of the projection point in the same fixed spatial
coordinate system,
(rij) corresponding elements of the indexes of the rotation matrix (3), (X’, Y’) the coordinates of the point mapped to the image, interpreted in
the coordinate system of the picture plane of the point, (C) the camera constant.
(3)
With the help of the above equation, if we make an evaluation on only one image, the determination of the „Z” coordinates of the field points is possible only with additional data. One is for example the digital terrain model. Figure 1 helps to interpret the meaning of symbols in the connections of the collinearity equations (1,2) and the rotation matrix (3).
X
X’
X’
Y
Y’
Y’
Z
Z’
Z’
P(X,Y,Z)
O(X ,Y ,Z )0 0 0
P’(X’,Y’)
P’(Y’)
P’(X’)
P(X)
P(Y)
P(Z)
Figure 1
An illustration of the central projection
During the analysis of multiple overlapping images, the intersected projection rays of the same field points edited with different images provide the elevation coordinates of each field point.
Although the projection rays passing through the pixels of overlapping images of the same field points necessarily need to intersect at one point, in practice, due to miscalculations, this is not the case. In order to determine the intersection point
close to the real intersection point, further procedure is required. The aim of the beam compensation is to „tune” the equations of those projection rays that are known to be intersected at one point with different methods. Tuning means a slight change in the parameters of the equations so that the intersections are as close as possible to each other. Mathematically, this means the method of least squares in which each parameter is estimated by minimizing the calculation error.
For example, in the case of two points (points found on two images, mapping the same field point) we are looking for the solution of the following equation system (4). The process is relatively time-consuming due to the high number of point pairs, however, it can be well paralleled!
(4)
Where:
top indexes „a” and „b” mean the values interpreted in the local coordinate system of the two images (images „a” and „b”).
3 Automatic Search of Matching Point Pairs
The multi-image photogrammetric method assumes that we have the mapping points of the same field point in case of two or more images, that is, the image coordinates defined in the local coordinates of the coherent points.
Many methods are known for identifying coherent pixels on images of the same objects. Such methods include SIFT (Scaleinvariant Feature Transform) [9] and SURF (Speeded Up Robust Features) [10]. There are still many false results between the point pairs determined this way. These should be removed using additional filters. Such a frequently used filter is RANSAC (Random Sample Consensus) [11].
Figure 2
The result of the Matlab program searching for identical point pairs on two images of the Csákvár Powder Tower [12]
The point pairs shown in Figure 2 (the two ends of colored sections mark the point pairs on the image) were calculated by the downloadable Matlab program published by David Lowe [13]. The program uses the SIFT method. Modifying various parameters can be used to illustrate the effectiveness of the method and the appearance of faulty point pairs during the increase of the point pairs.
Finding the correct point pairs and effectively removing faulty point pairs is crucial for creating both the orthophoto and the 3D model.
4 The Schematic Process of Creating the Orthophoto and 3D Model
From the aerial images to the appearance of measurable data, image processing goes through many of the subprocesses discussed previously. The analysis of the data is back-to-back and the result of each partial analysis influences the reliability of the end result. The processing is the following:
- taking overlapping aerial photographs
- searching for characteristic points on the images, defining point pairs, eliminating faulty point pairs
- creating point clouds with multi-image photogrammetry - refinement of the point cloud (beam compensation) - surface model creation based on the point cloud - texturing the surface model
- transformation according to the projection system, georeferencing - generation of output files (orthophoto, 3D model)
Georeferencing does not necessarily follow the process described above. If the recording device connects metadata to the images and contains the coordinate of the image, then the processing software can use this data. In this case, the coordinate system of the real world is created during processing, based on the coordinates read from the images, so that the point cloud can be inserted into the
map created according to the projection system of the coordinates. This method does not provide sufficient accuracy for the orthophotos and 3D models used as the basis for cartographic and other measurements, thus, actual georeferencing (projection transformation based on reference points with accurately defined coordinates) cannot be omitted.
5 Practical Surveys of Ruined Architectural Monuments
5.1 Church Ruins from the Árpád-Era in the Area of Tök
In Hungary, near the village of Tök, there is a church ruin from the Árpád-era.
This ruin now has barely any parts above the surface. There are references to the church in historical documents, but unfortunately, only markings of the former shrine can be found on maps (Figure 3). These references and map markings are not suitable for the exact reconstruction of the former church.
Figure 3
Church ruin on a chamber map from the end of the 18th Century [14]
Today, the freely available satellite images provide a much more accurate picture of the position and condition of the ruin, however, these images are not detailed enough (Figure 4). Although the satellite image already shows the floor plan and the display program also provides measurement options, due to inadequate resolution and in many cases significant distortions, measurements can only be made with a very high error rate.
Figure 4
The satellite image of the ruin in Tök from the Google Earth program from different publishing periods
The ruin in Tök was photographed with a DJI multi-rotor device (Inspire 1). The shooting took 15 minutes of flight time, during which 116 12-megapixel photos were taken. These images were processed using „Agisoft PhotoScan Professional”
program. The file created by the program is the orthophoto of the area on the one hand and the 3D model of the photographed area on the other (Figure 5).
Figure 5
The orthophoto of the ruin in Tök (left) and the 3D model of the ruin
The basis for the measurements is the created orthophoto. After proper calibration, the orthophoto can either be printed or displayed by electronic devices to determine the dimensions of the formations on it. In this case, the floor plan of the church is clearly visible and measurable on the finished orthophoto (Figure 6).
Thanks to the resolution of the image, the thickness of the walls of the building can clearly be seen and measured.
c: 1148 cm (1146 cm) g: (917 cm)
a: 1242 cm b: 8
10 cm
d: 9 8 cm (97
cm
) (3 f:
12 cm
) e:1
30 cm (13
2 cm )
Figure 6
The orthophoto of the ruin in Tök with measured and calculated dimensions
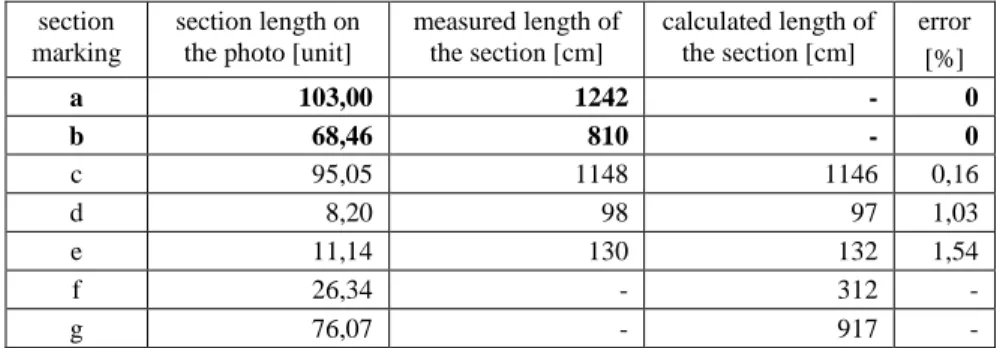
The calibration bases of the orthophoto of the ruin are shown in Figure 6 as bold, underlined values. The base of the sections that can be measured along the length of the church is the section „a”, the base of the sections parallel to its perpendicular width is section „b”. These values were determined by on-site, manual measurements and were used to calculate the values in brackets. In some places there are two values (one in brackets and one unmarked). Values without brackets are the results of manual measurements on-site that are used to check the calibration.
Table 1
Table of calibration and control measurements of the ruin in Tök
section marking
section length on the photo [unit]
measured length of the section [cm]
calculated length of the section [cm]
error [%]
a 103,00 1242 - 0
b 68,46 810 - 0
c 95,05 1148 1146 0,16
d 8,20 98 97 1,03
e 11,14 130 132 1,54
f 26,34 - 312 -
g 76,07 - 917 -
Table 1 shows that the error in the direction of the width of the church is one order of magnitude greater than along its length. This is due to the uncertainty of manual measurements. The walls of the church were built of hand-carved natural stones.
of proportions. The same unevennesses result in smaller error in case of long sections. This problem is well illustrated by the measurements of the thickness of the walls, during which we got 93 cm; 95 cm; 97 cm; 98 cm values. Based on the plethora of measurements, 98 cm proved to be the value closest to reality.
Considering that the longest section along the width of the church was 810 cm, we chose this as the base. At the same time, the section parallel to the width base were significantly shorter, so the above mentioned measurement uncertainty influenced these values by a higher percentage.
5.2 Roman Fortress in the Area of Iža
The remains of the former Roman fortress are located on the left bank of the Danube in the present-day Slovakia. Kelemantia is part of the Limes Romanus fortification system. Throughout history, it was rebuilt and expanded several times, and was eventually abandoned after the fall of the Roman Empire. The exploration works of the fortress are still ongoing today.
Figure 7
Remains of the „Kelemantia” Roman fortress on orthophoto and the floor plans determined based on the results of the excavations [15]
The remains of the excavated and exposed perimeter walls of the former fortress, the bastions and gates and the remnants of some inner buildings are visible on the aerial photos.
The area size and surrounding vegetation makes surveying with drone possible.
One of the advantages of this is that there is no going-over on foot during the aerial photography, which could potentially damage the explored areas. Another great advantage is the cost-effectiveness of drone shooting compared to the traditional manned aircraft surveying. The surveying was done with the Inspire 1 multicopter, which was equipped with the original X3 camera of DJI. A total of 526 images were taken during the flights from a height of 15 meters. 497 of these images were processed. The images were converted to orthophotos using the
„Agisoft PhotoScan Professional” software. The orthophoto field resolution is 1,08 cm/pixel.
Thanks to the high field resolution, the walls of the buildings are clearly visible.
Their thickness can also be measured. Similarly to real field work, distance measurements can be performed along the inner and outer edges of the wall.
The exposed remains on the orthophoto can be extended by lines and the wall sections associated with one object can be linked. Using the written documents, the probable floor plan of the fortress can be drawn which helps plan the exploration. In the case of the Iža fortress, for example, its structure is known from descriptions, so the positions of the gates and the towers protecting the gates can be determined with great accuracy along the wall of the fortress. The floor plan of the fortress and the outlines of the assumed buildings in the fortress were drawn on the orthophoto of the Iža fortress, as shown on Figure 7. The thick orange drawings depict the remains on the surface, while the thin orange lines represent the wall sections covered by soil. The white contours depict the floor plans of the assumed buildings.
118,5 m
2,1 m
116,4 m
Figure 8
Coloring according to height on the orthophoto of the remains of „Kelemantia” Roman fortress (west side of the fortress)
Contours drawn on the calibrated orthophoto can help in the planning of the exploration works. The exact location of the planned exploration can be accurately measured and determined with GPS coordinates on the calibrated and georeferenced orthophoto. Using the GPS coordinates determined this way, the location of the works can be measured accurately on the field so that excavation can be made more effectively. The orthophoto with drawings also illustrates the progress of the excavation as shown in Figure 7.
During the photogrammetric procedure, not only flat images, but also the full three-dimensional terrain model is produced. As part of the terrain model, buildings or their ruins of the surveyed area are available, height measurements can also be made on the model of the area. Figure 8 illustrates the area of the western wall section of Kelemantia with gradients. Based on the range of colors shown in the picture, the height above sea level of each pixel in the area can be determined. It should be noted that during the processing, the resolution of the orthophoto (plane resolution) is better than the height resolution. The basic data of the survey and the accuracy data of the reconstructed image during the surveying of the Kelemantia fortress are shown in Table 2.
In case of the terrain model with calibrated height data, the volume of the soil moved in the excavated area can be calculated well. Based on these, the area
required for deposing the moved soil can be accurately estimated and its location can be planned. Likewise, the transportation of the moved soil and its cost can also be planned. Knowing the height of the already excavated parts, the knowledge of the terrain model can help to estimate the amount of soil above the unexplored areas, so the time needed for the planned excavation can be estimated better.
Table 2
Main data of the Kelemantia survey
Height from recording start point: 29 m
Number of images: 497 pcs
Size of images: 4000 x 2250
pixels
Surveyed area: 4000 m2
Orthophoto field resolution: 1,08 cm/pixel Height resolution of the 3D model: 4,31 cm/pixel
The 3D model of the exploration area is useful for both documenting the progress of the exploration work and documenting the original location and position of the monuments found. Comparing the terrain models made periodically allows to track the changes in the area, determine the location and extent of possible malicious damage and detect erosion changes caused by environmental effects.
Figure 9 illustrates the detailedness of the orthophoto created during surveying.
The magnified well highlighted by the red circle on the right side of the figure is located at the place indicated by the arrow starting from the circle. The enlarged detail was made directly with the magnification of the orthophoto. Any part of the orthophoto can also be enlarged in a similar way. This magnification capability demonstrates the detailedness of the orthophoto of the area.
Similarly to the magnification capability, the 3D view of a portion of the surveyed area, in a circle similar to the previous red circle, but bigger, can be seen in the middle of Figure 9. As a 3D terrain model was made of the entire surveyed area, any of the details or the entire area can be observed on the 3D model. With the help of a suitable program, the excavated wall sections, remnants of buildings or other landmarks can be virtually explored and viewed from any angle.
In the area marked with a red oval contour at the top of Figure 9, soil was removed during excavation work. The determination of the quantity of this soil is also feasible on the processed data.
Figure 9
High resolution orthophoto and 3D model created from the processed data of „Kelemantia” Roman fortress
By marking the boundaries of the exploration area, the recess can be covered with a hypothetical flat surface. After the cover, a closed area is formed, the volume of which can be easily determined. Figure 10 illustrates the covered area surveyed.
The surface model contained the height data based on grid points of 10 cm x 10 cm. The amount of soil removed from the recess is 1200 m3 .± 3%. Of course, the volume calculation was made with the assumption that the original surface of the examined area was nearly flat. Precise measurements require a pre-earthwork survey that provides a reference surface for subsequent measurements.
Figure 10
Analysis of the amount of removed soil during the exploration of the northern entrance of
„Kelemantia” Roman fortress
Conclusion
Based on the measurements made and the experience of the evaluation results, information from aerial photography made with robotic aircraft can be utilized well. The great advantage of this method is that the area under exploration does not have to be affected at all during the survey, so neither the area, nor the archaeological finds discovered are damaged accidentally. The surveying costs are
low; thus, it can be repeated at any time. Repeated measurement data is suitable for periodic documentation of the exploration and archiving field changes caused by the exploration work. Of course, the method does not replace the traditional finding archiving procedures, but effectively complements them.
Acknowledgement
This work was supported by the National Fund for Research, Development and Innovation (ED_18-1-2018-0014).
References
[1] Bakó Gábor, UAV és RPAS technológia a légi távérzékelésben (UAS és RPAS technológia légi fotogrammetriai alkalmazása. Felhasználási lehetőségek, elérhető típusok és szoftverek, előnyök és kockázatok, jogi környezet), Készült a Magyar Földtani és Geofizikai Intézet megbízásából ISBN 978-963-671-300-3 (2015)
[2] Molnár A., Stojcsics D., Lovas I., Csemez L., „Damage assessment, damage control and monitoring by UAV in agriculture”, In: Proceedings of the 11th International Conference on Fluid Mechanics (FLUIDS '15), ISBN:978-1-61804-358-0
[3] Szenthe Gergely – Mozgai Viktória – Horváth Eszter – Bajnóczi Bernadett, Hun kori áldozati leletegyüttes Telki határából, MAGYAR RÉGÉSZET ONLINE MAGAZIN, 2019 Tavasz
[4] V. Yordanov, A. Mostafavi, M. Scaioni, DISTANCE-TRAINING FOR IMAGE-BASED 3D MODELLING OF ARCHEOLOGICAL SITES IN REMOTE REGIONS in: The International Archives of the Photogrammetry, Remote Sensing and Spatial Information Sciences, Volume XLII-2/W11, 2019, DOI: 10.5194/isprs-archives-XLII-2-W11- 1165-2019
[5] Jörg Albertz: Albrecht Meydenbauer – Pioneer of Photogrammetric Documentation of the Cultural Heritage. Proceedings 18th International Symposium CIPA 2001, pp. 19-25
[6] Grimm, A. (1980): Der Ursprung des Wortes Photogrammetrie. In:
Ackermann, F. et al. (1980): Internationales Archiv für Photogrammetrie.
Vol. XXIII, Teil B10, Komm. V, VI, VII Nachtrag, Hamburg 1980, pp.
323-330
[7] Somogyi József Árpád, Lézerszkennelt pontfelhők illesztésének optimalizálása, mérnöki feladatok megoldásainak hatékony támogatása pontfelhő alapú eljárásokkal, PhD értekezés 2017
[8] K. Kraus és P. Waldhäusl, Fotogrammetria. Budapest: Tertia, 1998, o.379 [9] D. G. Lowe, „Object recognition from local scale-invariant features”,
Proceedings of the Seventh IEEE International Conference on Computer Vision, köt. 2, sz. 8, o. 1150-1157, 1999
[11] M. A. Fischler és R. C. Bolles, „Random sample consensus: a paradigm for model fitting with applications to image analysis and automated cartography”, Communications of the ACM, köt. 24, sz. 6, o. 381-395, 1981
[12] David G. Lowe, "Distinctive image features from scale-invariant keypoints," International Journal of Computer Vision, 60, 2 (2004), pp. 91- 110
[13] https://www.cs.ubc.ca/~lowe/keypoints/ (2018)
[14] Kneidinger, Andreas, Original map of the Hungarian National Archives: S 11 No 0040/a:1
[15] Hubica Pinčíková, Magdaléna Janovská, Anna Tuhárska, FRONTIERS OF THE ROMAN EMPIRE THE DANUBE LIMES IN SLOVAKIA, Pamiatkový úrad Slovenskej republiky Bratislava 2018 ISBN 978-80- 89175-81-9