Dissertationes Archaeologicae
ex Instituto Archaeologico
Universitatis de Rolando Eötvös nominatae Ser. 3. No. 4.
Budapest 2016
Universitatis de Rolando Eötvös nominatae Ser. 3. No. 4.
Editor-in-chief:
Dávid Bartus Editorial board:
László Bartosiewicz László Borhy Zoltán Czajlik
István Feld Gábor Kalla
Pál Raczky Miklós Szabó Tivadar Vida Technical editors:
Dávid Bartus Gábor Váczi
Proofreading:
Szilvia Szöllősi Zsófia Kondé
Available online at http://dissarch.elte.hu Contact: dissarch@btk.elte.hu
© Eötvös Loránd University, Institute of Archaeological Sciences
Budapest 2016
Articles
Pál Raczky – András Füzesi 9
Öcsöd-Kováshalom. A retrospective look at the interpretations of a Late Neolithic site
Gabriella Delbó 43
Frührömische keramische Beigaben im Gräberfeld von Budaörs
Linda Dobosi 117
Animal and human footprints on Roman tiles from Brigetio
Kata Dévai 135
Secondary use of base rings as drinking vessels in Aquincum
Lajos Juhász 145
Britannia on Roman coins
István Koncz – Zsuzsanna Tóth 161
6thcentury ivory game pieces from Mosonszentjános
Péter Csippán 179
Cattle types in the Carpathian Basin in the Late Medieval and Early Modern Ages
Method
Dávid Bartus – Zoltán Czajlik – László Rupnik 213
Implication of non-invasive archaeological methods in Brigetio in 2016
Field Reports
Tamás Dezső – Gábor Kalla – Maxim Mordovin – Zsófia Masek – Nóra Szabó – Barzan Baiz Ismail – Kamal Rasheed – Attila Weisz – Lajos Sándor – Ardalan Khwsnaw – Aram
Ali Hama Amin 233
Grd-i Tle 2016. Preliminary Report of the Hungarian Archaeological Mission of the Eötvös Loránd University to Grd-i Tle (Saruchawa) in Iraqi Kurdistan
Tamás Dezső – Maxim Mordovin 241
The first season of the excavation of Grd-i Tle. The Fortifications of Grd-i Tle (Field 1)
The first season of the excavation of Grd-i Tle. The cemetery of the eastern plateau (Field 2)
Zsófia Masek – Maxim Mordovin 277
The first season of the excavation of Grd-i Tle. The Post-Medieval Settlement at Grd-i Tle (Field 1)
Gabriella T. Németh – Zoltán Czajlik – Katalin Novinszki-Groma – András Jáky 291 Short report on the archaeological research of the burial mounds no. 64. and no. 49 of Érd- Százhalombatta
Károly Tankó – Zoltán Tóth – László Rupnik – Zoltán Czajlik – Sándor Puszta 307 Short report on the archaeological research of the Late Iron Age cemetery at Gyöngyös
Lőrinc Timár 325
How the floor-plan of a Roman domus unfolds. Complementary observations on the Pâture du Couvent (Bibracte) in 2016
Dávid Bartus – László Borhy – Nikoletta Sey – Emese Számadó 337 Short report on the excavations in Brigetio in 2016
Dóra Hegyi – Zsófia Nádai 351
Short report on the excavations in the Castle of Sátoraljaújhely in 2016
Maxim Mordovin 361
Excavations inside the 16th-century gate tower at the Castle Čabraď in 2016
Thesis abstracts
András Füzesi 369
The settling of the Alföld Linear Pottery Culture in Szabolcs-Szatmár-Bereg county. Microregional researches in the area of Mezőség in Nyírség
Márton Szilágyi 395
Early Copper Age settlement patterns in the Middle Tisza Region
Botond Rezi 403
Hoarding practices in Central Transylvania in the Late Bronze Age
The settlement structure of the North-Western part of the Carpathian Basin during the middle and late Early Iron Age. The Early Iron Age settlement at Győr-Ménfőcsanak (Hungary, Győr-Moson- Sopron county)
Piroska Magyar-Hárshegyi 427
The trade of Pannonia in the light of amphorae (1st – 4th century AD)
Péter Vámos 439
Pottery industry of the Aquincum military town
Eszter Soós 449
Settlement history of the Hernád Valley in the 1stto 4/5thcenturies AD
Gábor András Szörényi 467
Archaeological research of the Hussite castles in the Sajó Valley
Book reviews
Linda Dobosi 477
Marder, T. A. – Wilson Jones, M.: The Pantheon: From Antiquity to the Present. Cambridge University Press. Cambridge 2015. Pp. xix + 471, 24 coloured plates and 165 figures.
ISBN 978-0-521-80932-0
and Early Modern Ages
Csippán Péter
Eötvös Loránd University Institute of Archaeological Sciences csippan79@gmail.com
Abstract
During the Late Middle Ages the intensive export of livestock increased according to contemporaneous written sources. Tax records show the custom duties paid after the huge numbers of animals. On the basis of this information we get a compact picture about the importance of this activity. Cattle trade as shown in the academic literature, was widespread in the territory of the Carpathian Basin and beyond. The export of livestock was not limited to cattle, but was also extanded to other domestic species e. g. horses, sheep and pigs. In romantic history, supported by the awakening national self-awareness in Hungary at the turn of the 19thand 20thcenturies, the iconic significance of the large, long-horned and light grey cattle consolidated.
Unfortunately no archaeological finds could support the medieval appearance of these animals. Osteological evidence of these large, long-horned cattle are yet to be found. This archaeozoological aspect of Cattle trade is still to be developed. To date our perceptions have relied on the generalization of a concept in the historical interpretation of this large-scale economic activity. Research has usually focused on trade itself and not the subjects: the animals. In this paper the author presents new scientific approaches to the theme, using geometric morphometrics in the analysis of cattle bones.
Introduction and historic overview
According to written sources the importance of Hungary emerged in the Trans-European livestock trade from the 14thcentury onwards1. In this period, when demand for meat increased in the urbanized western- and central parts of Europe, that region was supplied by livestock from the peripheral parts. Hungary was a very important resource and transit area of this trading activity especially towards southern Germany, and northern Italy. Some cities (Buda, Pest, Székesfehérvár, Szeged) changed to centers of redistribution and markets in livestock trade,2while others (Vác, Nagymaros, Dunaföldvár) earned importance due to their ferries across the Danube. After a trip to Vienna across Hungary the animals had to be stall-fed3 before being moved on towards regional markets.
On the basis of descriptions and customs records,4the bulk of the livestock was made up by cattle of various sizes, shapes and colours.5During the 16thcentury the diversity of exported
1 Belényessy 1956, 52; Bársony 1984, 362; Blanchard 1984; Bartosiewicz 1995a; Kubinyi 2009, 366.
2 Kubinyi 2009, 393.41 3 Nagy 2008, 272.
4 Velics – Kammerer 1890; Kubinyi 2009, 367; Bartosiewicz 1995/b, 80.
5 Velics – Kammerer 1890, 97; Vörös 2004, 210; Bartosiewicz 2002, 95.
cattle seems to show some uniformization.6 The demand in central European markets and the long cattle droves basically influenced the ways of breeding. Albeit the emergence of the Hungarian Grey cattle has not yet been clarified in the archaeological record, it seems inseparable from this complex process. The long-horned cattle of primigenius cranial type eventually became a trade mark of cattle trade in Hungary.7
Cattle exports oscillated, but continued during the 16th–17thcentury Ottoman Turkish occupa- tion of the country,8as is shown in tax-rolls and customs records. Supporting this activity the Pasha of Buda, Sokoli Mustafa guaranteed safe passage for cattle merchants through the ferry of Vác in 1576 and this guarantee was confirmed by Pasha Ali in 1582.9
Trading was supported by both Christian Europe and the Sublime Porte in Istanbul in the hope of lucrative tax revenues.10 More than a millionakchecustoms income was collected only on cattle transit at the ferry of Vác by Ottoman authorities in the 1560s.11
Thanks to the huge demand, new breeding centers were included in the trading system (e.g. in Transylvania, Moldva, Podolia).12 Selective breeding and the broad variability of cattle types were a perfect basis for the emergence of new types such as the putative ancestor of the Hungarian Grey breed.13Intensive livestock trade started to decline during the 17th–18thcentury, and this time imported dairy cattle breeds also began appearing in the Carpathian Basin.14
This paper presents preliminary results of a research project15which is focused on the morpho- metric differences between late medieval and early modern cattle metapodials from several archaeological sites from Hungary. The purpose of the research is to find osteological evidence of variability in cattle in the concerned archaeological periods.
The research hypotheses are established on the probable variability of cattle types by geograph- ical and/or social regions. The main research questions are:
• Did intensive export generate homogeneous stocks of cattle over the regions or the regional differences continued to exist throughout the centuries?
• How can we isolate possibly different stocks on the basis of the morphological and osteometrical differences between metapodials?
• Is there any chance to complete this task, without using costly analytical methods such as aDNA or isotope analysis on large samples? How can we define possible morphological groups without these sensitive analytical methods?
6 Bartosiewicz 1995b, 81; Vörös 2004, 207.
7 Bartosiewicz 1997, 50.
8 Fekete 1944, 231.
9 Vass 1983, 100; Gaál 1966, 473; Veress – Dunka 2003, 44.
10 Veress – Dunka 2003, 44.
11 Velics – Kammerer 1890, 260.
12 Vörös 2004, 213.
13 Bartosiewicz 1997, 50; Vörös 2004, 214; Csippán 2009, 195.
14 Bartosiewicz 1993, 56.
15 This research project was materialized by the maintance of the Hungarian Scientific Foundation (OTKA – PD115261) and the János Bolyai Scholarship of the Hungarian Academy of Sciences (HAS) with additional funding from the project KMOP-4.2.1/B-10-2011-0002.
To gain historical informations on these animals the possible way is to turn to contemporaneous written sources. If these documentary sources offer information about the homogenity of cattle stocks from the Early Modern Age, we hypotesize, that these phenomena were also general in the Carpathian Basin. If the contemporaneous demand had a feedback effect on improving beef supplies, so the large cattle type(s) would become generally common in the region and the reflected in archaeological finds. (Animal bones from the household rubbish offer primary evidence of everyday meat-eating processes rather than trade). If uniformisation can be demonstrated, it could be attributed to the slow formation of a possible trademark such the appearance of the Hungarian cattle. It may be the result of intending to breed a recognizable product:“magnos cornutos boves Hungaricos qui sunt omnes coloris ejér, szöjke”.16
Contemporaneous tax-rolls and customs records reveal, however, that the general uniformiza- tion of the animals is a false hypothesis. The first counterargument is the huge number of the exported animals. Some written sources talk about tens of thousands of live cattle annually driven across the Danube between 15thand 16th century,17although the intensity of livestock export somewhat oscillated during Ottoman Turkish occupation.18
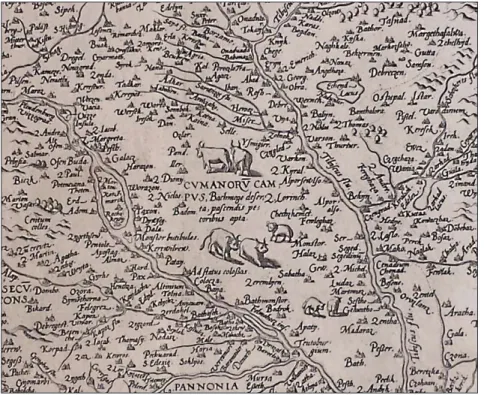
Fig. 1.Map of the Hungarian Kingdom by Wolfgang Lazius (1552)
But what do we know about the morphology of late medieval and early modern cattle? The picture of these animals is incomplete. In the written sources some clues are available e.g.black cow with her brindle calf,19and pictorial representations imply a silhouette of these cattle in general. Vörös noticed, that six basic colors of cattle were generally mentioned in the 16th–18th century: white, blond, raddle, brown, black and blue.20 The map of the Hungarian Kingdom in
16 Milhoffer 1904, 74.; Bartosiewicz 2002, 95.
17 Milhoffer 1904, 74.
18 Káldy-Nagy 1970, 87.
19 Velics – Kammerer 1890, 97.
20 Vörös 2004, 210.
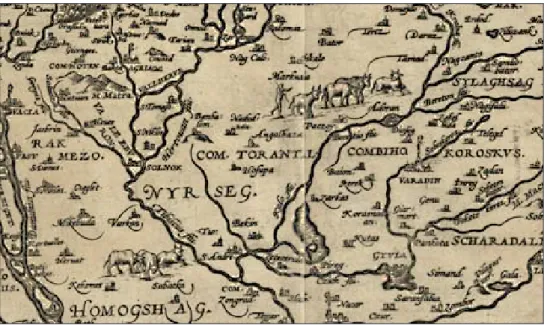
the bookRegni Hungariae Descriptio veraby Wolfgang Lazius (1552) showed spunky, shorter horned type of cattle in the area of the town Kecskemét, a market town famous for its animal husbandry(Fig. 1). Other illustrations in a map by János Zsámboky (1571) seem to be suggestive of a larger type of cattle(Fig. 2).
Fig. 2.Map of the Hungarian Kingdom by János Zsámboky (1571)
In a third contemporaneous map, Nova totius Ungariae descriptio accurata et diligens desumpta by Mathias Zündt (1567), yet another type, a medium-long horned cattle was shown along with their herders. This representation, however, also highlights the unreliability of stature estimations based on such pictures, the body sizes of cattle and dogs were obviously different from each other(Fig. 3).
Fig. 3.Map of the Hungarian Kingdom by Mathias Zündt (1567)
As much as may be seen, pictorial and written sources indicate various types of cattle during the archaeological periods focal to this paper. Moreover in the maps shown here these animals are invariably located in the central area of the country, the plains renowned for their animal husbandry. Several, but at least two types of cattle have been reported in various archaeozoo- logical publications during the Hungarian Middle Ages, spanning from the 11th–13thcentury Árpád period until the subsequent late medieval times.21
Osteological evidence from this area confirmed this variability of cattle breeds. Nyerges and Bartosiewicz published data on these morphological groups from the late medieval village of Szentkirály.22
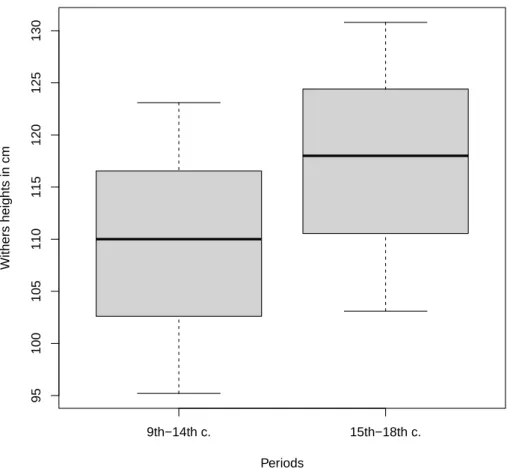
In general – on the basis of Matolcsi’s work – the newly published data fit the average withers heights characteristic of these periods.23 The minimum was shown in the 9th–14th century, but body size was increasing during the late medieval and early modern periods(Fig. 4). This process seems like a rapid change, some researchers therefore presumed a possible change of cattle stocks at the end of the Middle Ages.24
9th−14th c. 15th−18th c.
95100105110115120125130
Periods
Withers heights in cm
Fig. 4.Differences in withers heights early (9th–14th c.) and late (15th–16th c.) medieval cattle after Matolcsi 1986.
21 Matolcsi 1968, 26.; Vörös 1992, 233; Nyerges 2004, 528.
22 Nyerges – Bartosiewicz 2006, 335.
23 Matolcsi 1968, 12.
24 Nyerges – Bartosiewicz 2006, 336.; Lyublyanovics 2015, 229.; Vörös 2002, 344.
However it is quite possible, that significant numbers of regional cattle stocks were concen- trated in the country in transit as a result of the rapid increase in animal exports. This process may have caused higher variability, but on the other hand, may have provided a genetic basis for the emergence of new types with larger body size.25
Method and material
Method
The main methodological problem of the concept of continuous size growth is the one-sided approach of the available data, which focuses mainly on withers heights estimates, as linear distance measurements are highly correlated with size, because long bone lengths are highly correlated with stature. This means that the comparison of measurements emphasized the same dimension: the variability in withers heights reflected variability in bone lengths but was insufficient for the fine-grain separation of cattle types.
In addition, the archaeozoological material originates from culturally filtered deposits, influ- enced by taphonomic processes, thus it cannot reflect exactly the contemporaneous breeding and trading processes. Excavated assemblages usually mirror everyday meat-eating habits which included only a small part of the actual animal stock. The measurable and comparable data – originating from adult animals – showed that the excavated bones, usually came from cows, representing only a very thin layer of all animal stocks in the discussed periods. Therefore, during the comparison between various data, in addition to age, a preliminary separation by sex should receive a higher priority, given the high degree of sexual dimorphism in cattle.26 Interpretating the number of cattle phenotypes during the Hungarian Middle Ages is problematic.
On the basis of conventional archaeozoological methods, this question is hard to tackle.
One of the possible answers can be expected from the analysis of the aDNA. Genetic research showed clear differences between cattle bone samples from various archaeological sites. But the problem is the level of comparison. Without any preliminary concept of classification, these results probably will show only the tautological differences, but not the similarities.
Thus, first of all we have to define the criteria for possible groups using a method based on a skeletal element, which comes to light very often and carries a lot of decoded and comparable information (e. g. withers height, age, sex): the metapodials.27
Metapodials (the fusedmetacarpus III-IV. and metatarsus III-IV.) bear rich information (see above) on the animals, which strongly depends on the form of exploitation and/or breed- related characteristics.28 A more sophisticated method was sought to retrieve morphometric information from these bones. Geometric morphometry (GM), supported by powerful statistical methods such as Principal Component Analysis (PCA) and Cluster Analysis (Ward method) offer appropriate solutions.
25 Bartosiewicz 1997, 50.
26 Bartosiewicz 1984, 142.
27 Fhionnghaile et al. 2015, 78.
28 Bartosiewicz 2008, 159.
Fhionnghaile et al. have already carried out multivariate morphometric analyses of cattle metapodials in Hungary. Those authors, however authors used different hardware and software in their analysis, and focused only on two recent cattle breeds in Europe.29 On the basis of their results we can hypotesize, that the form of exploitation and morphological differences between the body shape of various cattle can be reflected in the shape of metapodials. These bones adapt to the way cattle were kept and used, and may even show deformities in metapodials as well as in the carpal and tarsal bones and phalanges of the animals.30 Therefore preliminary observation and the separation of bones showing symptoms of degenerative disease are also important before the analysis.
GM originates from evolutionary biology and paleontology, where it is used to separate groups of similar, but different species on the basis of exact, non-conventional metric data. The basic idea of GM originated from D’Arcy Thompson in 1917 who expressed changes in shape in organisms by transforming the data into coordinates establishing diagnostic points on them in order to describe the characteristics of the shape.31
As the first step in GM analyses the researcher has to define diagnostic (general and identifiable) points (landmarks) on each individual to be compared, which describe the characteristics of their shape. Today, the analysis of shape is either based on the configurations of such landmarks or on the analysis of outlines (either open or closed).32 The in-depth evaluation of these homologous diagnostic points would not be possible without suitable computer applications and methodology.
The definition of landmarks needs to meet five criteria, after by Zelditch et al.33
• homologous anatomical loci
• unaltered topological positions relative to other landmarks
• provision of adequate coverage of the morphology
• repeatable and reliable occurrences
• falling within the same plane
The topological variations of these landmarks form the basis of comparison. The parameters of the object can be split by size and shape. The size of the bone is represented by the centroid and absolute size itself. The centroid is the geometric center of the shape, which is described by the landmarks and the size of it is the square root of the summed squared distances of landmarks from the centroid.34 The centroid size depends on the distances of all landmarks from the centroid of the object. Centroid sizes thus typify the objects.35 The rare coordinates are calibrated using the centralization method of superimposition (General
29 Fhionnghaile et al. 2015.
30 Bartosiewicz 2008, 159.
31 Bookstein 1991, 2; Mitteroecker – Gunz 2009, 236.
32 Adams et al. 2013, 7.
33 Zelditch et al. 2004, 25.
34 Zelditch et al. 2004, 60.
35 Slice 2007, 3; Mitteroecker – Gunz 2009, 236.
Procrustes Analysis – GPA), which determines the geometric centroid as a standard common unit, re-scales the coordinates and determines the mean of the shapes of an individual.36 Another advantage of the GPA is, that the method can exclude extreme measurement bias. The comparison between individual forms is based on the common mean of shapes, which is more-or-less independent from real, absolute size. To eliminate this proper of landmarks, the PCA is an obvious method, because with the reduction of dimensions the data become more manageable. On the other hand the geometric interpretation of landmarks as coordinates makes it easy to visualize the real differences between the individuals using a thin-plate spline interpolation of a coordinate grid.37 In this case all of the landmarks are presumably homologous, so they are placed on the homologue position, but all other points are interpolated from one form to another.
GM became a well known method in archaeology as well, used in physical anthropology, ceramics typology and for lithic materials.38 Borel et al. reminded in their work, that the classical approach based on only two measurements (greatest length and greatest breadth) is not sufficient for the precise description of stone tools and does not meet the requirements of reliable comparison. The variability of real shape can not be described by only these measurements. Using GM in archaeology, therefore, has another advantage: it pinpoints correspondences between the form, technology and function of stone tools.39 Similarly to the problem of traditional stone tool analysis – using only two absolute metrical dimensions – the situation is the same with the morphological comparison of metapodials that serve as a basis in the estimation of withers heights.40
Using GM on cattle metapodials has some criteria:
• For the analysis we need clear and focused pictures of each bone taken from the same distance and angle.41
• Because the high degree of secondary sexual dimorphism in cattle, before the GM analysis we have to separate cows, oxen and bulls on the basis of the greatest length of a bone and breadth of proximal epiphysis, using the methods developed by Nobis.42
• Finally we have to compare the archaeological data with measurements taken on present- day cattle of various, known forms of exploitation to help understanding differences and similarities in the archaeological data.
36 adams et al. 2004, 6–7; Rohlf 1999.
37 Bookstein 1991, 26.
38 Cardillo, 2010, 325.; Borel et al. 2016; In this research project I am using only 2D morphometric methods, but 3D methods also available in GM.
39 Borel et al. 2016, 2.
40 Because withers height estimation is based on the greatest length and the greatest breadth of the proximal ephipysis of the metapodials. (See Nobis 1954; Matolcsi 1970)
41 This is a general criterion in GM, therefore I was using an EPSON PERFECTION 2004 PHOTO flatbed scanner with a light tent.
42 Nobis 1954.
Material
This paper examines three archaeological assemblages from the sites of Akalacs village, Révfalu village and the town of Vác.43 All of these sites are dated to the late medieval period (15th-16th century), but represent different types of settlement.
Akalacs44 was a late medieval village located on the left bank of the Danube, not far from the ferry at Dunaföldvár across the Danube. The village was abandoned at the time of Ottoman Turkish occupation in the 16th century.45
As shown by its Hungarian name, Révfalu (Ferry-village) was an important ferry settlement during the Late Middle Ages.46 In contrast to Akalacs, this village remained a relevant crossing point on the Danube in late medieval-early modern age cattle export, directed towards markets in Northern-Italy.47
Cattle S/G Pig Horse Poultry Wild game
Révfalu (N=7345)
NISP
0 1000 2000 3000 4000 5000
Cattle S/G Pig Horse Poultry Wild game
Vác (N=1925)
NISP
0 200 400 600 800 1000 1200
Cattle S/G Pig Horse Poultry Wild game
Akalacs (N=8074)
NISP
0 1000 2000 3000 4000 5000
Fig. 5.Taxonomic distribution of bone animal materials from Révfalu, Vác and Akalacs.
43 The sites were excavated by Zsófia Ács (HNM-CNCH), Orsolya Mészáros (HNM-CNCH, ELTE), Gábor Wilhelm (Katona József Museum, Kecskemét), many thanks are due for their help.
44 Paks-Cseresznyés (M6–TO18).
45 Oláh et al. 2010, 204.
46 Pányos – Rosta 2015, 256.
47 Bartosiewicz 1999, 48.
And finally three estates in the center of the town of Vác, which was the most important ferry across the Danube, during the middle ages and under Ottoman Turkish occupation.48 All three settlements were located in or near the focus of late medieval- early modern age cattle trade.
The animal bone materials from these sites were rich and well preserved49 and all of rep- resenting a general 14–16th century Christian pattern, where beef dominated in everyday meat-consumption(Fig. 5).
Unfortunately only42metacarpals50 originated from the aforementioned sites, so they were complemented with8metacarpals from Castle of Szolnok an Early Modern site published by Bökönyi (1974)51and18metacarpals from present-day Hungarian Grey cattle from the HMA.52 On one hand the later samples originate from a different period. On the other, they come from a well-known modern breed. Therefore they have a potential to show clear and interpretable differences and/or homologies during the analysis, thereby increasing the validity of results.
●
●
●
●
●
●
●
10−13th c. (N=36) 14−15th c. (N=113) 16−18th c. (N=66)
100110120130140
Periods
Withers heights of cows in cm
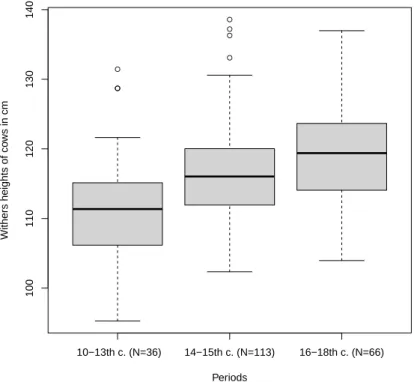
Fig. 6.Increase the withers heights of cows between the 10th to 18th century.
Using the conventional withers height based comparison the Late Medieval samples fit the characteristic of the period calculated by Matocsi 1968.53 The average of withers heights of cows show a significant increase between the 10thto 18thcentury on the basis of sites listed in the Appendix(Fig 6).54
48 Bartosiewicz 1995/a
49 All animal bone materials were identified by the author, but as of today only the finds from Vác-Piac utca have been published.
50 Sample sizes: Akalacs n=32, Vác n=5, Révfalu n=5 51 Bökönyi 1974, 471.
52 I have to thank Andrea Kőrösi, who provided access to Hungarian Grey metapodia in the Osteological Collection of the Hungarian Museum of Agriculture.
53 Matolcsi 1970.
54 List of the cited sites see on the Appendix.
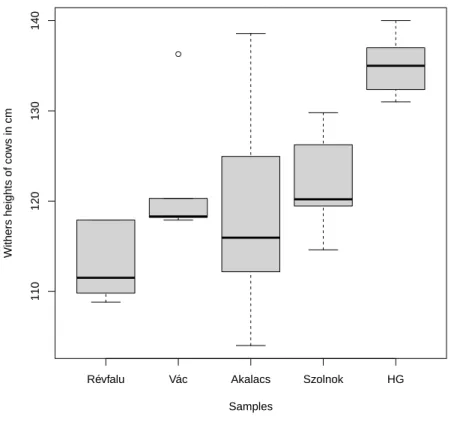
The distribution of withers heights per samples shows significant differences in the case of the Early Modern Age and Hungarian Grey material, but in the case of Late Medieval sites, the differences are possibly due to the differences in sample size(Fig. 7).
●
Révfalu Vác Akalacs Szolnok HG
110120130140
Samples
Withers heights of cows in cm
Fig. 7.Box-plot showing the distribution of withers heights in the studied samples.
Withers heights from the three Late Medieval sites show a more-or-less normal distribution with a slight positive skew. The mean value is118cm, accompanied by a relatively broad range (100 – 140cm, SD=8.136). The high difference between the extremes of the range might mean several types of cattle. However, these types cannot be distinguished from each other on the basis of withers heights alone(Fig. 8).
The morphometric analysis included only the complete, undamaged metacarpals from the rich materials described above. The analysis was made using thegeomorphpackage for the statistical softwareR55 developed by Adams et al.56 During the recording of the data – for the sake of comparability – only the left side oriented bones were recorded. This means that metacarpals from the right side were mirrored horizontally, for the sake of the analysis. Without this process the number of the comparable elements would have been a lot smaller. Landmarks were determined on the basis of works by Bignon et al.57 and Fhionnghaile et al.58 Twenty-nine landmarks were defined on all complete metacarpals. As in addition to two points on the diaphysis two others on the border of distal and proximal epiphyses of the bones could not be located consistently due to the lack of concrete morphological features, these points are defined as semi-landmarks(Fig. 9).
55 R Core Team (2016). R: A language and environment for statistical computing. R Foundation for Statistical Computing, Vienna, Austria. URL: https://www.R-project.org/
56 Adams – Otárola-Castillo 2013; Adams et al. 2016.
57 Bignon et al. 2005, 379.
58 Fhionnghaile et al. 2015, 75.
Withers heights in cm
Frequency
100 110 120 130 140
02468101214
Mean=118 cm
105 115 125 135
0.000.010.020.030.040.05
N = 42 Bandwidth = 2.555
Density
Mean=118 cm
Fig. 8.Distribution of the cattle withers heights from the three Late Medieval sites.
Fig. 9.Cattle metacarpal with the 23 landmarks and 6 semilandmarks on the diaphysis.
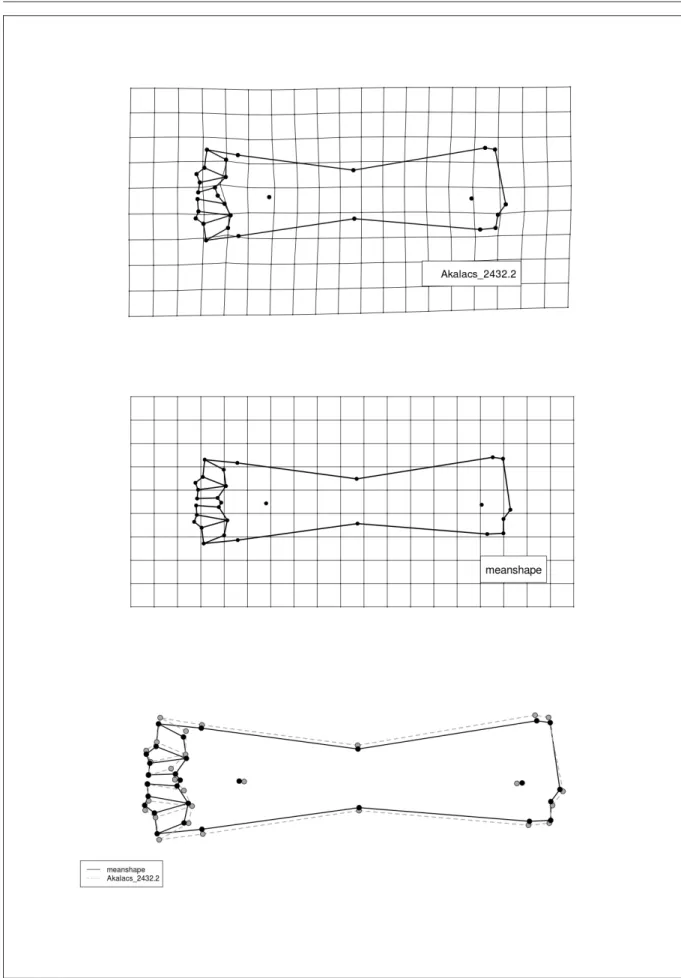
After recording the landmarks we get a cumulative topological graph of the coordinates of all landmarks on each individual bones(Fig. 10). These point clouds are calibrated by the General Procrustes Analysis (GPA), on the basis of Procrustes distances, which normalize (center and scale) the incidental mistakes of the data-recoding process. The resulting differences show the real variability in the shape of the bones. Because the real form of the individual equal the summation of shape and size.59This superimposition also helps defining the centroids of the raw coordinates
59 Borel et al. 2016, 2.