Business Intelligence workload
Gábor Szárnyas
1,2, Arnau Prat-Pérez
3,4, Alex Averbuch
5, József Marton
2, Marcus Paradies
6,∆, Moritz Kaufmann
7, Orri Erling
Σ, Peter Boncz
8, Vlad Haprian
9and János Benjamin Antal
21MTA-BME Lendület Cyber-Physical Systems Research Group,2Budapest University of Technology and Economics,
3Sparsity Technologies,4DAMA UPC,5Neo4j,6DLR,7Technische Universität München,8CWI,9Oracle Labs,
∆Work performed while at SAP SE,ΣWork performed while at OpenLink Software
szarnyas@mit.bme.hu,aprat@ac.upc.edu,alex.averbuch@neotechnology.com,boncz@cwi.nl,vlad.haprian@oracle.com
ABSTRACT
In this short paper, we provide an early look at the LDBC Social Net- work Benchmark’s Business Intelligence (BI) workload which tests graph data management systems on a graph business analytics workload. Its queries involve complex aggregations and naviga- tions (joins) that touch large data volumes, which is typical in BI workloads, yet they depend heavily on graph functionality such as connectivity tests and path finding. We outline the motivation for this new benchmark, which we derived from many interactions with the graph database industry and its users, and situate it in a scenario of social network analysis. The workload was designed by taking into account technical “chokepoints” identified by data- base system architects from academia and industry, which we also describe and map to the queries. We present reference implementa- tions in openCypher, PGQL, SPARQL, and SQL, and preliminary results of SNB BI on a number of graph data management systems.
ACM Reference Format:
Gábor Szárnyas, Arnau Prat-Pérez, Alex Averbuch, József Marton, Marcus Paradies, Moritz Kaufmann, Orri Erling, Peter Boncz, Vlad Haprian and János Benjamin Antal. 2018. An early look at the LDBC Social Network Benchmark’s Business Intelligence workload. InGRADES-NDA’18: 1st Joint International Workshop on Graph Data Management Experiences & Systems (GRADES) and Network Data Analytics (NDA), June 10–15, 2018, Houston, TX, USA.ACM, New York, NY, USA, 11 pages. https://doi.org/10.1145/3210259.
3210268
1 INTRODUCTION
The explosion of network- or graph-shaped data has increased the demand for tools analyzing such data sets, including specialized cluster framework APIs, SQL extensions or graph databases. The diversity of tools and technologies creates the need for standard benchmarks that help practitioners identify the technologies that suit their needs. Additionally, benchmarks spur competition among vendors and stimulate research in the field, as TPC benchmarks [9, 24, 27] have done for the RDBMS industry.
Permission to make digital or hard copies of all or part of this work for personal or classroom use is granted without fee provided that copies are not made or distributed for profit or commercial advantage and that copies bear this notice and the full citation on the first page. Copyrights for components of this work owned by others than the author(s) must be honored. Abstracting with credit is permitted. To copy otherwise, or republish, to post on servers or to redistribute to lists, requires prior specific permission and/or a fee. Request permissions from permissions@acm.org.
GRADES-NDA’18, June 10–15, 2018, Houston, TX, USA
© 2018 Copyright held by the owner/author(s). Publication rights licensed to the Association for Computing Machinery.
ACM ISBN 978-1-4503-5695-4/18/06. . . $15.00 https://doi.org/10.1145/3210259.3210268
Recent graph benchmarking initiatives focus on three key areas:
(1) transactional workloads consisting of interactive read and up- date queries [4, 6, 12], (2) graph analysis algorithms [5, 11, 19, 23], and (3) inferencing/matching on semantic data [1, 17, 22, 30, 32].
Benchmarks with aggregation-heavy OLAP-like Business In- telligence (BI) workloads on graphs are still a rather unexplored area, and existing proposals do not fully capture the complex na- ture of such workloads. Currently, the only benchmark with global queries and aggregations on graph-like data is the Berlin SPARQL Benchmark’s BI use case [8]. However, while proposed on RDF, it is exactly equivalent to and exists in a SQL variation on flat tables in a star schema, i.e. its dataset lacks a true graph structure and its queries thus do not require graph functionality.
Graph BI workloads differ from other types of graph query work- loads in that large portions of the graph are explored in search of occurrences of graph patterns. Compared to graph analytics workloads, the patterns under search combine both structural and attribute predicates of varying complexity [29], from basic graph patterns [3] to more complex unbound patterns that rely on differ- ent reachability semantics (e.g. paths, trails). The identified patterns are typically grouped, aggregated, and sorted to summarize the re- sults, which are used to assist the user in critical decision making.
BI workloads on graphs are particularly challenging because they usually lead to large search spaces and consequently, to large inter- mediate results. Thus, systems that are not prepared to efficiently prune the search space—by finding good graph traversal order- ings, leveraging reachability indexes, or taking advantage of top-k semantics—are heavily penalized. Moreover, the complex structure of real graphs induces difficult-to-predict, scattered memory access patterns, which can limit the memory bandwidth saturation by or- ders of magnitude if computations are not arranged correctly [31].
Finally, some complex graph patterns become difficult to express even with the most advanced query languages, leading to large and verbose queries, which are difficult to write and maintain.
In this paper we present an early look at the LDBC SNB Busi- ness Intelligence benchmark (SNB BI), an industry-graded graph BI benchmark for graph processing systems as a result of many interactions between industry, academia, and graph practitioners.
SNB BI is amacro-benchmarkconsisting of 25 queries on top of a synthetically generated social network graph with a rich data schema and correlated attributes. By following a chokepoint-based approach, SNB BI queries are carefully designed to reproduce the challenging aspects of real workloads while keeping the workload realistic so it can be expressed by existing graph systems.
As supplementary material, we provide reference implementa- tions using the Sparksee engine, as well as the openCypher [14], PGQL [33], SPARQL [26], and SQL declarative query languages, available at https://github.com/ldbc/ldbc_snb_implementations.
2 BENCHMARK DESIGN
The SNB BI workload consists of 25 read queries that have been carefully designed around a set of chokepoints (CPs) [9]. These are challenging aspects and scenarios observed during query evalua- tion that present specific optimization opportunities, which systems must identify to allow efficient processing of larger data volumes.
We have adopted many of the chokepoints identified in [12] and ex- tended the list with new graph and language-specific ones, detailed in Section 2.1. Similarly to theInteractive workloadof the LDBC Social Network Benchmark, theBI workloaduses query templates that contain parameters to be substituted with bindings from the corresponding domain of the data set (e.g.Persons) [12].
2.1 Chokepoint-Based Query Design
To design the queries we have followed an iterative process where the connection between chokepoints and queries has been progres- sively updated. At each step, either a new query was proposed or an existing one was updated, so that each query fulfills at least three chokepoints, and each chokepoint appears in at least one query.
Additionally, the exercise of implementing the queries has helped us to reconsider some chokepoint assignments, either by adding some previously unforeseen ones or unassigning chokepoints from queries (as they turned out to be irrelevant in practice). This also re- vealed how dependent the impact of one chokepoint is on the scale factor and/or the input parameters, thus putting more pressure to the query optimizer and making the benchmark more challenging.
We have carefully designed the queries to be expressible using state of the art query languages and represent realistic BI operations one would perform on a social network (e.g.Popular topics in a Country,Tag evolutionorTrending Posts). At the same time, we have tried to push the expressivity of existing query languages to their limits by formulating queries difficult to express. The detailed description of the chokepoints and final relations between queries and CPs can be found in Appendix A. In the following lines, we detail the new graph and language CPs.
Graph-specific chokepoints
CP-7.1 Path pattern reuse.This chokepoint tests the ability of the execution engine to reuse results across graph traversals. For example, when computing paths within a range of distances, it is often possible to incrementally compute longer paths by reusing paths of shorter distances that were already computed.
CP-7.2 Cardinality estimation of transitive paths.This choke- point tests the ability of the optimizer to estimate the cardinality of intermediate results when executing transitive paths, in order to decide proper traversal order (join order/type in relational DBs).
CP-7.3 Efficient execution of a transitive step.This tests the ability of the query execution engine to efficiently execute a transi- tive step from a set of nodes. This operation is typically executed by scanning the nodes and repeatedly performing a short lookup into
a data structure storing the neighbors of each. However, in cases with many nodes, other strategies might be more efficient [7].
CP-7.4 Efficient evaluation of termination criteria of tran- sitive queries.This CP tests the ability of a system to express termination criteria for transitive queries and the ability to perform efficient termination testing.
Language chokepoints
CP-8.1 Complex patterns.A natural requirement for graph query languages is to express complex graph patterns. Challenging pat- terns include transitive closure-style queries, with/without fixed bounds on the number of hops and evennegative edge conditions.
CP-8.2 Complex aggregations.BI workloads are dominated by aggregation operations, including queries withsubsequent aggrega- tions, where the results of an aggregation serve as input of another aggregation. Expressing such operations requires some sort of query composition or chaining (see also CP-8.4). It is also common tofilter on aggregation results(similarly to theHAVINGkeyword of SQL).
CP-8.3 Windowing queries.In addition to aggregations, BI work- loads often usewindow functions, which perform aggregations with- out grouping input tuples to a single output tuple. A common use case for windowing isranking, i.e. selecting the top element with additional values in the tuple (nodes, edges or attributes).
CP-8.4 Query composition.Numerous use cases require acom- positionof queries, including the reuse of query results (e.g. nodes, edges) or using scalar subqueries (e.g. selecting a threshold value with a subquery and using it for subsequent filtering operations).
CP-8.5 Dates and times.Handling dates and times is a funda- mental requirement for production-ready database systems. It is particularly important in the context of BI queries as these often calculate aggregations on certain periods of time (e.g. on a month).
CP-8.6 Handling paths.To take full advantage of the graph data model, systems should be able to perform complex operations on paths in the graph [2].1Hence, additionally to reachability-style checks, a language should be able to express queries that operate on path elements, e.g. calculate a score for each edge of the path.
Further, some use cases require uniqueness constraints on paths, e.g. that a certain path must not have repeated edges.
2.2 Data
SNB BI adopts the LDBC Social Network Benchmark (LDBC-SNB) data generator to generate synthetic social networks with realistic characteristics, using its scale factor notion and the way to generate parameter bindings [16], for which we have extended the original software.2For a detailed description of the generator, please refer to [12]. Here, we highlight those characteristics of the produced graphs that make the generator ideal for a graph BI workload.
First, graphs contain a rich schema consisting of different entities.
This allows the design of queries with rich and complex patterns re- quiring both small and large projections. These stress chokepoints such asCP-1.2 High cardinality group-by performance, which en- ables the engine to efficiently perform grouping operations when there are many different groups;CP-1.4 Low cardinality group-by
1Following the conventions of [3], we define paths as a sequence of vertices and edges, with both endpoints of an edge appearing adjacent to it in the sequence.
2https://github.com/ldbc/ldbc_snb_datagen
performance, which enables specific optimizations when there are only few different groups; andCP-2.2 Late projectionwhich tests the ability of the optimizer to defer the projection of attributes not required until later phases of the evaluation.
Second, graphs are correlated, i.e.Personswith similar charac- teristics are more likely to be connected or where the values of the attributes of a given entity are correlated. Systems can exploit such correlations to leverage more compressed means of storing the graph or to improve data access locality via clustered indexes. Such optimization opportunities are specifically captured by chokepoints CP-3.1 Detecting correlationorCP-3.2 Dimensional clustering.
Finally, structural characteristics are also realistic, with the de- gree distributions of theknowsedge type being Facebook-like [28]
and the largest connected component containing a significant por- tion of the overall network. Such features allow us to stress choke- pointsCP-3.3 Scattered index access patterns, which tests the ability of the execution engine to efficiently access indexes using keys that are scattered, which is usually the case when performing traversals of more than one hop; and the newCP-7.2 Cardinality estimation of transitive pathsandCP-7.3 Efficient execution of a transitive step.
3 DETAILED QUERY DISCUSSION
All queries present in SNB BI share common data access characteris- tics, they touch large portions of the social network graph and rely heavily on aggregation operations [15]. In the following, we discuss three example queries in detail, and show how properly dealing with different chokepoints can highly impact query evaluation time, revealing the relevance of chokepoint-based benchmark design and the proposed queries. The list of CPs is presented in Appendix A, while queries are listed in Appendix B.
To assess the complexity of each query and potential impact of optimization techniques, we ran multiple performance experiments.
These were implemented in C++on top of the Sparksee native graph database [20], and evaluated on SF1 and SF10 data sets. Benchmarks were executed on a cloud VM with 8 Xeon E5-2673 CPU cores and 256 GB RAM, running Ubuntu 16.04. Detailed results for all 25 queries and multiple systems are available in Appendix C.
Q5—Top posters in a country
Definition.“Find the 100 most popularForumsin a givenCountry.
For each member of theseForums, count the number ofPoststhey made in any of the popularForums.”
Performance CPs.Q5 represents a simple graph pattern matching query with a top-k evaluation and a set of aggregation operations.
Besides its simplicity, this query is highly relevant for several rea- sons: first, this is one of the queries that fulfills a majority of the chokepoints (10 in total), including those related to efficientCP-2.1 Rich join order optimization,CP-1.3 Top-k pushdown, andCP-2.2 Late projection. Second, this query reveals that graph database systems must not only provide support for purely graph-specific operations but also non-graph operations, such as aggregations and top-k evaluation, to answer realistic graph BI queries efficiently.
Q5 Q16 Q25
ForumtoCountry CountrytoForum Baseline Top-kpushdown Top-kpushdown+ pathpatternreuse Baseline Resultreuse
SF1 4,848 64 1,552 1,463 702 622 419
SF10 57,637 349 29,312 27,398 15,037 2,885 1,939 Table 1: Execution times in milliseconds for Q5, Q16 and Q25 with different optimizations.
To demonstrate the importance of the chokepoints fulfilled by this query, we focus on the first and most time-consuming part of the query, which looks for patterns connectingForumstoPersons living in aCountry(the latter being provided as a query parameter).
When looking for occurrences of such a pattern, a system has several alternatives to navigate the graph. For instance, one option is to navigate the graph fromForumstoPersons, and then filter out those occurrences withPersonsthat are notlocatedIntheCountry in question. As an alternative, the system could also first obtain the Personsthat belong to theCountry, and then retrieve theForum neighbors via thehasMemberrelationship.
Properly selecting the right strategy can heavily impact the query time, sometimes by orders of magnitude. Table 1 depicts the average query evaluation time for the two proposed traversal strategies.
The execution times reveal that by following the second traversal evaluation strategy, the average execution time is two orders of magnitude lower on both scale factors. This particular example represents an instance ofCP-2.1 Rich join order optimization, since traversing a graph can be interpreted as a sequence of joins. Other queries fulfilling this CP are Q2, Q4, Q9, Q10, Q11, Q19, Q20, Q21, Q22, Q24 and Q25. The large number of queries is caused by the fact that navigation is a key operation in graph BI workloads.
Language CPs.This query first performs an aggregation to deter- mine the popularity ofForums, then sorts them and selects the 100 most popular ones, and continues the computation with these.
This covers two key language CPs:CP-8.2 Complex aggregations(to perform ordering on aggregations results) andCP-8.4 Query com- position(to continue with results of the subquery). Due to the BI nature of the benchmark, complex aggregation (CP-8.2) is required by≈50% of the queries, 12 in total. Composition (CP-8.4) is also an important feature, required by Q10, Q15, Q18, Q21, Q22, and Q25.
Q16—Experts in social circle
Definition.“FindPersonswho live in a givenCountryand are connected to a givenPerson through and edge-unique path of knowsedges with a length in range[min, max]. For eachPerson, retrieve theirMessageswith aTagbelonging to a givenTagClass.
Also retrieve allTagsfor eachMessage. Group the results byPersons andTags, then count theMessagesfor a certainPerson/Tag.”
Performance CPs.One way to evaluate this query is to first find allPersonsreachable from the givenPersonand belonging to the inputCountry. Then, for each of thesePersons, we can look for the messagesthey created and theirTagsto obtain the final result set, from which the top-k elements are returned.
However, a sophisticated query optimizer might be able to infer that the maximum number ofMessageswith a givenTagfor a given Personcan be at most thePerson’s total number ofMessages. Thus, the system might first sort the reachablePersonsby theirMessage count in descending order and start counting theirMessages’Tags while maintaining a priority queue with the top-k results. Once the
“total number ofMessagesof the nextPersonto evaluate” value is smaller than the last entry in the top-k (assuming this already containskelements), the query evaluation can abort exploring more Persons, hence exploitingCP-1.3 Top-k pushdown[10]. In the first and second column of Table 1, we show the results of applying the optimization (for a top-100 case). We see that applying it decreases execution time by around 6%. Although this number might not seem significant, top-k pushdown is one of the most important chokepoints of the workload. For large SFs, some queries such as Q22 become untractable if top-k pushdown is not exploited, since it would require comparing allPersonsof one country to allPersons of another country. Also, other queries that rely on this chokepoint to be executed efficiently are Q2, Q4, Q5, Q9, and Q19.
Complementing the top-k pushdown optimization, a system could also try to compute the reachablePersonsincrementally, in- stead of computing them at the beginning of the execution. As the Personsbelonging to the inputCountryare explored (sorted in descending order by theirMessagecount), a reachability set can be updated while checking whether the currently evaluatedPersonis reachable or not. Thus, before performing the expensive reachabil- ity test, we can check whether a certainPersonhas been already observed in an earlierPersonreachability test. This optimization is an example of an exploitation ofCP-7.1 Path pattern reuse, which for this query would result in an improvement of≈1.8−2×over simple top-k pushdown, as shown in Table 1. Reachability indexes are a form of reusing patterns and are an active research area [34].
This chokepoint was partially designed to stimulate such research efforts. Other queries that fulfill this chokepoint are Q19 and Q25.
Language CPs.This query uses transitive paths with variable bounds, which is a key challenge inCP-8.1 Complex patterns. Other queries that stress this CP are Q8, Q11, and Q19 (negative edge conditions), and Q14, Q18, Q19, Q20, and Q25 (transitive paths).
Due to the edge-uniqueness constraint, this query also relies on the language supportingedge-isomorphic matching semantics[3], which is captured byCP-8.6 Handling paths.
Q25—Weighted interaction paths
Definition.“Given twoPersons, find all shortest paths onknows edges between them. For each path, calculate a weight based on interactions between consecutivePersons(details omitted, see Ap- pendix B). Return all paths ordered by their weights descending.”
Performance CPs.This query looks first for all the shortest paths between a given pair ofPersons, and for each of them computes a score based on the interactions between each pair of consecutive Personsin the path. In a realistic graph—such as the one in the benchmark—it is likely that there exists a large overlap between
such shortest paths, especially if the length of the shortest paths is relatively large. Such an overlap implies that many of the subqueries used to compute the path’s score are essentially the same, and thus their results can be reused. This is an application ofCP-5.3 Intra- query result reuse. Table 1 shows the average execution time of Q25 on SF1 and SF10, with and without reusing the subquery results.
We see that thanks to the optimization, we obtain a reduction in the execution time of≈30%. Other queries where this chokepoint can be exploited are Q3, Q5, Q15, Q21, and Q22.
Language CPs.This query stresses language features, covering all related CPs, including an important aspect ofCP-8.6 Handling paths.
In particular, it calculates the weight of a path based on interactions of consecutive nodes on the path, which is often difficult to express in existing languages. This has been recognized by recent language design efforts: the G-CORE language [2] defines paths as part of its property graph data model, which defining queries on paths.
4 CONCLUSION AND FUTURE WORK
In this paper, we have presented our early work on SNB BI, a graph processing systems’ benchmark for graph BI workloads. SNB BI combines a set of 25 carefully designed queries with a synthetic so- cial network dataset to achieve a realistic yet challenging workload.
We share our experiences on implementing the benchmark on a graph database and showcase the benefits of the chokepoint-based design by means of a detailed discussion on three example queries.
Moreover, we provide results for three different systems.
Our experiences reveal how the designed queries capture the complexity of graph BI workloads by offering optimization oppor- tunities that, if not taken into account, would make the evaluation of queries infeasible for large scale factors. We also studied the language aspects of the queries, making them expressible using existing declarative query languages (openCypher, PGQL, SPARQL, and SQL), which also revealed some deficiencies of the languages.
While the contours of SNB BI have now become clear, work on it continues, e.g. by including updates into the workload. We consider the scenario of systems that query a static snapshot of the graph, and from time to time receive batch updates that must be incorporated into the database. However, we also want the benchmark to match the capabilities of those systems that offer queryable snapshots while accepting update streams in parallel. Updates will tie into the overall performance metric function, which we will define in the complete benchmark. Such a function will need to consider two main aspects: (1) all queries are equally important regardless their data complexity, favouring geometric mean [13] and (2) the function should accommodate different ways of accepting updates. Finally, we plan to provide new implementations (e.g. in G-CORE [2]).
ACKNOWLEDGMENTS
G. Szárnyas was partially supported by NSERC RGPIN-04573-16 and MTA-BME Lendület Cyber-Physical Systems Research Group.
DAMA-UPC research was supported by the grant TIN2017-89244-R from MINECO (Ministerio de Economia, Industria y Competitivi- dad) and the recognition 2017SGR-856 (MACDA) from AGAUR (Generalitat de Catalunya). Sparsity thanks the EU H2020 for fund- ing the Uniserver project (ICT-04-2015-688540). We would like to thank Oskar Van Rest (Oracle Labs) for his contributions in the PGQL queries and Bálint Hegyi (BME) for his remarks on the spec.
REFERENCES
[1] Günes Aluç, Olaf Hartig, M. Tamer Özsu, and Khuzaima Daudjee. 2014. Diversi- fied Stress Testing of RDF Data Management Systems. InISWC. 197–212.DOI:
https://doi.org/10.1007/978-3-319-11964-9_13
[2] Renzo Angles and others. 2018. G-CORE: A Core for Future Graph Query Lan- guages. InSIGMOD.
[3] Renzo Angles, Marcelo Arenas, Pablo Barceló, Aidan Hogan, Juan Reutter, and Domagoj Vrgoč. 2017. Foundations of Modern Query Languages for Graph Databases. ACM Comput. Surv.50, 5, Article 68 (Sept. 2017), 40 pages. DOI:
https://doi.org/10.1145/3104031
[4] Timothy G. Armstrong, Vamsi Ponnekanti, Dhruba Borthakur, and Mark Callaghan. 2013. LinkBench: a database benchmark based on the Facebook social graph. InSIGMOD. 1185–1196.DOI:https://doi.org/10.1145/2463676.2465296 [5] David A. Bader and Kamesh Madduri. 2005. Design and Implementation of
the HPCS Graph Analysis Benchmark on Symmetric Multiprocessors. InHiPC.
465–476.DOI:https://doi.org/10.1007/11602569_48
[6] Sumita Barahmand and Shahram Ghandeharizadeh. 2013. BG: A Benchmark to Evaluate Interactive Social Networking Actions. InCIDR. http://cidrdb.org/
cidr2013/Papers/CIDR13_Paper93.pdf
[7] Scott Beamer, Krste Asanovic, and David A. Patterson. 2013. Direction-optimizing breadth-first search.Scientific Programming21, 3-4 (2013), 137–148.DOI:https:
//doi.org/10.3233/SPR-130370
[8] Christian Bizer and Andreas Schultz. 2009. The Berlin SPARQL Benchmark.Int.
J. Semantic Web Inf. Syst.5, 2 (2009), 1–24. DOI:https://doi.org/10.4018/jswis.
2009040101
[9] Peter A. Boncz, Thomas Neumann, and Orri Erling. 2013. TPC-H Analyzed:
Hidden Messages and Lessons Learned from an Influential Benchmark. InTPCTC.
61–76.DOI:https://doi.org/10.1007/978-3-319-04936-6_5
[10] Donko Donjerkovic and Raghu Ramakrishnan. 1999. Probabilistic Optimization of Top N Queries. InVLDB. 411–422. http://www.vldb.org/conf/1999/P40.pdf [11] Benedikt Elser and Alberto Montresor. 2013. An evaluation study of BigData
frameworks for graph processing. InBig Data. 60–67. DOI:https://doi.org/10.
1109/BigData.2013.6691555
[12] Orri Erling and others. 2015. The LDBC Social Network Benchmark: Interactive Workload. InSIGMOD. 619–630.DOI:https://doi.org/10.1145/2723372.2742786 [13] Philip J. Fleming and John J. Wallace. 1986. How Not To Lie With Statistics: The
Correct Way To Summarize Benchmark Results.Commun. ACM29, 3 (1986), 218–221.DOI:https://doi.org/10.1145/5666.5673
[14] Nadime Francis and others. 2018. Cypher: An Evolving Query Language for Property Graphs. InSIGMOD.
[15] Jim Gray and others. 1997. Data Cube: A Relational Aggregation Operator Generalizing Group-by, Cross-Tab, and Sub Totals.Data Min. Knowl. Discov.1, 1 (1997), 29–53.DOI:https://doi.org/10.1023/A:1009726021843
[16] Andrey Gubichev and Peter A. Boncz. 2014. Parameter Curation for Benchmark Queries. InTPCTC (Lecture Notes in Computer Science), Vol. 8904. Springer, 113–
129.
[17] Yuanbo Guo, Zhengxiang Pan, and Jeff Heflin. 2005. LUBM: A benchmark for OWL knowledge base systems.J. Web Sem.3, 2-3 (2005), 158–182.DOI:https:
//doi.org/10.1016/j.websem.2005.06.005
[18] Annegret Habel, Reiko Heckel, and Gabriele Taentzer. 1996. Graph Grammars with Negative Application Conditions.Fundam. Inform.26, 3/4 (1996), 287–313.
DOI:https://doi.org/10.3233/FI-1996-263404
[19] Alexandru Iosup and others. 2016. LDBC Graphalytics: A Benchmark for Large- Scale Graph Analysis on Parallel and Distributed Platforms.PVLDB9, 13 (2016), 1317–1328.
[20] Norbert Martínez-Bazan, Sergio Gómez-Villamor, and Francesc Escale-Claveras.
2011. DEX: A high-performance graph database management system. In2nd International Workshop on Graph Data Management: Techniques and Applications (GDM) at ICDE. 124–127.DOI:https://doi.org/10.1109/ICDEW.2011.5767616 [21] Bruce Momjian. 2000.PostgreSQL: Introduction and Concepts. Addison-Wesley.
[22] Mohamed Morsey, Jens Lehmann, Sören Auer, and Axel-Cyrille Ngonga Ngomo.
2011. DBpedia SPARQL Benchmark - Performance Assessment with Real Queries on Real Data. InISWC. 454–469.DOI:https://doi.org/10.1007/978-3-642-25073-6_
29
[23] Lifeng Nai, Yinglong Xia, Ilie Gabriel Tanase, Hyesoon Kim, and Ching-Yung Lin.
2015. GraphBIG: understanding graph computing in the context of industrial solutions. InSC. 69:1–69:12.DOI:https://doi.org/10.1145/2807591.2807626 [24] Raghunath Othayoth Nambiar and Meikel Pöss. 2006. The Making of TPC-DS.
InVLDB. 1049–1058. http://dl.acm.org/citation.cfm?id=1164217
[25] Thomas Neumann and Guido Moerkotte. 2009. A Framework for Reasoning about Share Equivalence and Its Integration into a Plan Generator. InBTW. 7–26.
http://subs.emis.de/LNI/Proceedings/Proceedings144/article5220.html [26] Jorge Pérez and others. 2009. Semantics and complexity of SPARQL.ACM Trans.
Database Syst.34, 3 (2009).DOI:https://doi.org/10.1145/1567274.1567278 [27] Meikel Pöss and Chris Floyd. 2000. New TPC Benchmarks for Decision Support
and Web Commerce.SIGMOD Record29, 4 (2000), 64–71.DOI:https://doi.org/10.
1145/369275.369291
[28] Arnau Prat-Pérez and David Domínguez-Sal. 2014. How community-like is the structure of synthetically generated graphs?. InGRADES at SIGMOD. 7:1–7:9.
DOI:https://doi.org/10.1145/2621934.2621942
[29] Sherif Sakr, Sameh Elnikety, and Yuxiong He. 2012. G-SPARQL: a hybrid engine for querying large attributed graphs. InCIKM. 335–344.DOI:https://doi.org/10.
1145/2396761.2396806
[30] Michael Schmidt, Thomas Hornung, Michael Meier, Christoph Pinkel, and Georg Lausen. 2009. SP2Bench: A SPARQL Performance Benchmark. InSemantic Web Information Management - A Model-Based Perspective. 371–393.DOI:https:
//doi.org/10.1007/978-3-642-04329-1_16
[31] Bin Shao, Yatao Li, Haixun Wang, and Huanhuan Xia. 2017. Trinity Graph Engine and its Applications. IEEE Data Eng. Bull.40, 3 (2017), 18–29. http:
//sites.computer.org/debull/A17sept/p18.pdf
[32] Gábor Szárnyas, Benedek Izsó, István Ráth, and Dániel Varró. 2017. The Train Benchmark: cross-technology performance evaluation of continuous model queries. Softw. Syst. Model. (2017). DOI:https://doi.org/10.1007/
s10270-016-0571-8
[33] Oskar van Rest, Sungpack Hong, Jinha Kim, Xuming Meng, and Hassan Chafi.
2016. PGQL: a property graph query language. InGRADES at SIGMOD. DOI:
https://doi.org/10.1145/2960414.2960421
[34] Hilmi Yildirim, Vineet Chaoji, and Mohammed J. Zaki. 2012. GRAIL: a scalable index for reachability queries in very large graphs.VLDB J.21, 4 (2012), 509–534.
DOI:https://doi.org/10.1007/s00778-011-0256-4
A CHOKEPOINTS
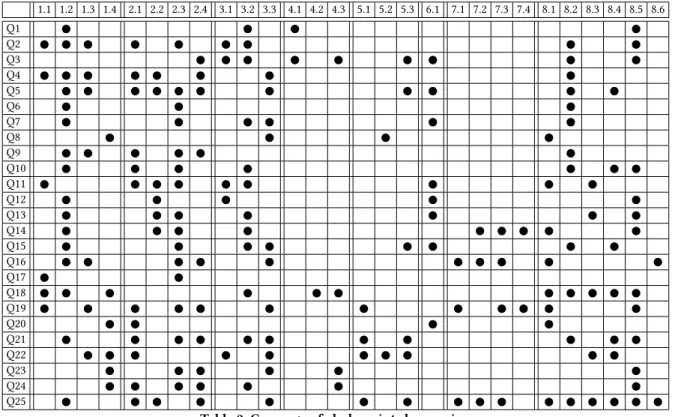
In this section, we describe the chokepoints of the benchmark. The connection between chokepoints and queries is displayed in Table 2.
A.1 Aggregation Performance
CP-1.1 Interesting orders.This chokepoint tests the ability of the query optimizer to exploit the interesting orders induced by some operators. For example, a neighborhood expansion operator often preserves the implicit sortedness of the adjacency, which can be subsequently used to perform cheaper duplicate elimination on the set of discovered vertices.
CP-1.2 High Cardinality group-by performance. This choke- point tests the ability of the execution engine to parallelize group- by’s with a large number of groups. Real property graphs are usually rich in terms of different property values (e.g., person names, top- ics, cities, etc.) and thus is very common that aggregate queries over these attributes result in a large number of groups (especially when grouping over multiple properties). In such a case, intra query parallelization can be exploited by making each thread to partially aggregate a subset of the results. In order to avoid the merging the partial aggregations and to avoid costly critical sections, the results to group can be partitioned by hashing the grouping key and be sent to the appropriate thread/partition.
CP-1.3 Top-k push down.This chokepoint tests the ability of the query optimizer to optimize queries requesting top-k results.
The search space of Graph BI queries can easily explode given the complexity of the patterns in search. Many times, the search space can be pruned by imposing extra restrictions oncekresults have been obtained and the query advances. Applying this kind of optimizations can significantly reduce the search space.
CP-1.4 Low cardinality group-by performance.This choke- point tests the ability to efficiently group results when only a very limited set of groups is available. This can require special strategies for parallelization, e.g., pre-aggregation when possible. This case also allows using special strategies for grouping like using array lookup if the domain of keys is small. This is typically observed in
1.1 1.2 1.3 1.4 2.1 2.2 2.3 2.4 3.1 3.2 3.3 4.1 4.2 4.3 5.1 5.2 5.3 6.1 7.1 7.2 7.3 7.4 8.1 8.2 8.3 8.4 8.5 8.6 Q1
Q2
Q3
Q4 Q5 Q6
Q7
Q8
Q9
Q10
Q11
Q12
Q13
Q14
Q15
Q16
Q17
Q18
Q19
Q20
Q21
Q22
Q23
Q24
Q25
Table 2: Coverage of chokepoints by queries.
graph BI queries, especially when grouping results by country or month of the year.
A.2 Join Performance
CP-2.1 Rich join order optimization.This chokepoint tests the ability of the query optimizer to find optimal join orders. When looking for pattern occurrences, a graph can be traversed in very different ways, which is equivalent to performing different join orders in the relational model. The execution time of these orders may differ by orders of magnitude, thus finding an efficient traversal strategy is of high importance.
CP-2.2 Late projection.This chokepoint tests the ability of the query optimizer to delay the projection of unneeded attributes until late in the execution. This is common on graph BI queries where we look for patterns with predicates on a reduced set of properties, but we are later interested in selecting other properties not used in such predicates. In such a situation, it might be better to omit such properties from initial scans and fetch them later by node/edge id, which can save temporal space, and therefore I/O.
Late projection does have a trade-off involving locality, since late in the plan accessing the nodes by id lead to scattered I/O or memory access patterns. Thus, late projection specifically makes sense in queries where the late use of these columns happens at a moment where the amount of qualifying nodes have been considerably reduced, for example after an aggregation with only few unique group-by keys, or a top-k operator.
CP-2.3 Join type selection.This chokepoint tests the ability of the query optimizer to select the proper join operator type (e.g., hash or index-based joins), which implies accurate estimates of cardinalities. Typically, graph databases will have neighborhoods materialized/indexed, and thus accessing the neighbors of a reduced set of nodes is typically performed using such indexes (index-based join). However, there are situations where one is interested into obtaining the neighborhood of a large frontier (a set of nodes).
Depending on the cardinalities (size of the frontier and expected size of the neighborhood), a hash or an index-based join operator is more appropriate, thus a good estimation of cardinalities is of high importance. The same rationale applied when accessing node/edge properties.
CP-2.4 Sparse foreign key joins.This chokepoint tests the per- formance of join operators when the join is sparse. Sometimes joins involve relations where only a small percentage of rows in one of the tables is required to satisfy a join. When tables are larger, typical join methods can be sub-optimal. Partitioning the sparse table, using Hash Clustered indexes or implementing Bloom filter tests inside the join are techniques to improve the performance in such situations.
A.3 Data Access Locality
CP-3.1 Detecting correlation.This chokepoint tests the ability of the query optimizer to detect data correlations and exploiting them by means of clustered indexes, MinMax indexes, etc. Many real
graphs contain correlations between property values (e.g., the coun- try of residence is correlated with the language a person speaks) which can be used to improve data access locality.
CP-3.2 Dimensional clustering.This chokepoint tests suitabil- ity of the identifiers assigned to entities by the storage system to better exploit data locality. Many graph database systems use inter- nal identifiers for nodes and edges, thus they have some choice in assigning a value to this identifier. Many real graphs have a mod- ular structure with correlations between neighbors (e.g., friends are likely to share friends) and property values and neighbors (e.g., Persons tend to connect to Persons with similar interests). These characteristics can be exploited in order to assign ids to nodes/edges smartly, which can be used to improve compression and data local- ity.
CP-3.3 Scattered index access patterns.This chokepoint tests the performance of indexes when scattered accesses are performed.
The efficiency of index lookup is very different depending on the locality of keys coming to the indexed access. The structure of real graphs might induce unpredictable index accesses (e.g., a graph neighborhood traversal is an example of an operation with random access without predictable locality), thus locality sensitive optimiza- tions might need to be disabled if these are costly when there is not locality.
A.4 Expression Calculation
CP-4.1 Common subexpression elimination.This chokepoint tests the ability of the query optimizer to detect common sub- expressions and reuse their results. A basic technique helpful in multiple queries is common subexpression elimination (CSE). CSE should recognize also that average aggregates can be derived after- wards by dividing a SUM by the COUNT when those have been computed.
CP-4.2 Complex boolean expression joins and selections.
This chokepoint tests the ability of the query optimizer to reorder the execution of boolean expressions to improve the performance.
Some boolean expressions are complex, with possibilities for al- ternative optimal evaluation orders. For instance, the optimizer may reorder conjunctions to test first those conditions with larger selectivity.
CP-4.3 Low overhead expressions interpretation.This choke- point tests the ability of efficiently evaluating simple expressions on a large number of values. A typical example could be simple arith- metic expressions, mathematical functions like floor and absolute or date functions like extracting a year.
CP-4.4 String matching performance.This chokepoint tests the ability of efficiently evaluating complex string matching ex- pressions (e.g., via regular expressions).
A.5 Correlated Sub-queries
CP-5.1 Flattening sub-queries.This chokepoint tests the ability of the query optimizer to flatten execution plans when there are correlated sub-queries. Many queries have correlated sub-queries and their query plans can be flattened, such that the correlated sub-query is handled using an equi-join, outer-join or anti-join.
To execute queries well, systems need to flatten both sub-queries, the first into an equi-join plan, the second into an anti-join plan.
Therefore, the execution layer of the database system will benefit from implementing these extended join variants. The ill effects of repetitive tuple-at-a-time sub-query execution can also be miti- gated if execution systems by using vectorized, or block-wise query execution, allowing to run sub-queries with thousands of input parameters instead of one. The ability to look up many keys in an index in one API call creates the opportunity to benefit from physical locality, if lookup keys exhibit some clustering.
CP-5.2 Overlap between outer and sub-query.This choke- point tests the ability of the execution engine to reuse results when there is an overlap between the outer query and the sub-query. In some queries, the correlated sub-query and the outer query have the same joins and selections. In this case, a non-tree, rather DAG- shaped [25] query plan would allow to execute the common parts just once, providing the intermediate result stream to both the outer query and correlated sub-query, which higher up in the query plan are joined together (using normal query decorrelation rewrites).
As such, the benchmark rewards systems where the optimizer can detect this and the execution engine supports an operator that can buffer intermediate results and provide them to multiple parent operators.
CP-5.3 Intra-query result reuse.This chokepoint tests the abil- ity of the execution engine to reuse sub-query results when two sub-queries are mostly identical. Some queries have almost identi- cal sub-queries, where some of their internal results can be reused in both sides of the execution plan, thus avoiding to repeat compu- tations.
A.6 Parallelism and Concurrency
CP-6.1 Inter-query result reuse.This chokepoint tests the abil- ity of the query execution engine to reuse results from different queries. Sometimes with a high number of streams a significant amount of identical queries emerge in the resulting workload. The reason is that certain parameters, as generated by the workload generator, have only a limited amount of parameters bindings. This weakness opens up the possibility of using a query result cache, to eliminate the repetitive part of the workload. A further opportunity that detects even more overlap is the work on recycling, which does not only cache final query results, but also intermediate query results of a “high worth”. Here, worth is a combination of partial- query result size, partial-query evaluation cost, and observed (or estimated) frequency of the partial-query in the workload.
A.7 Graph Specific
CP-7.1 Path pattern reuse. This chokepoint tests the ability of the execution engine to reuse work across graph traversals. For example, when computing paths within a range of distances, it is often possible to incrementally compute longer paths by reusing paths of shorter distances that were already computed.
CP-7.2 Cardinality estimation of transitive paths.This choke- point tests the ability of the query optimizer to properly estimate the cardinality of intermediate results when executing transitive paths. A transitive path may occur in a “fact table” or a “dimension
table” position. A transitive path may cover a tree or a graph, e.g., descendants in a geographical hierarchy vs. graph neighborhood or transitive closure in a many-to-many connected social network.
In order to decide proper join order and type, the cardinality of the expansion of the transitive path needs to be correctly estimated.
This could for example take the form of executing on a sample of the data in the cost model or of gathering special statistics, e.g., the depth and fan-out of a tree. In the case of hierarchical dimensions, e.g., geographic locations or other hierarchical classifications, de- tecting the cardinality of the transitive path will allow one to go to a star schema plan with scan of a fact table with a selective hash join. Such a plan will be on the other hand very bad for example if the hash table is much larger than the “fact table” being scanned.
CP-7.3 Efficient execution of a transitive step.This choke- point tests the ability of the query execution engine to efficiently execute transitive steps. Graph workloads may have transitive op- erations, for example finding a shortest path between nodes. This involves repeated execution of a short lookup, often on many val- ues at the same time, while usually having an end condition, e.g., the target node being reached or having reached the border of a search going in the opposite direction. For the best efficiency, these operations can be merged or tightly coupled to the index operations themselves. Also parallelization may be possible but may need to deal with a global state, e.g., set of visited nodes. There are many possible tradeoffs between generality and performance
CP-7.4 Efficient evaluation of termination criteria for tran- sitive queries.This tests the ability of a system to express termi- nation criteria for transitive queries so that not the whole transitive relation has to be evaluated as well as efficient testing for termina- tion.
A.8 Language chokepoints
CP-8.1 Complex patterns.A natural requirement for graph query systems is to be able to express complex graph patterns.
Transitive edges.Transitive closure-style computations are common in graph query systems, both with fixed bounds (e.g., get nodes that can be reached through at least 3 and at most 5knowsedges), and without fixed bounds (e.g., get allmessagesthat acommentreplies to).
Negative edge conditions.Some queries definenegative pattern con- ditions. For example, the condition that a certainmessagedoes not have a certaintagis represented in the graph as the absence of ahasTagedge between the two nodes. Thus, queries looking for cases where this condition is satisfied check for negative patterns, also known as negative application conditions (NACs) in graph transformation literature [18].
CP-8.2 Complex aggregations.BI workloads are heavy on ag- gregation, including queries withsubsequent aggregations, where the results of an aggregation serves as the input of another ag- gregation. Expressing such operations requires some sort of query composition or chaining (see also CP-8.4). It is also common tofilter on aggregation results(similarly to theHAVINGkeyword of SQL).
CP-8.3 Windowing queries.Additionally to aggregations, BI workloads often usewindow functions, which perform aggregations without grouping input tuples to a single output tuple. A common use case for windowing isranking, i.e. selecting the top element with additional values in the tuple (nodes, edges or attributes).3 CP-8.4 Query composition.Numerous use cases requirecompo- sitionof queries, including the reuse of query results (e.g., nodes, edges) or using scalar subqueries (e.g., selecting a threshold value with a subquery and using it for subsequent filtering operations).
CP-8.5 Dates and times.Handling dates and times is a funda- mental requirement for production-ready database systems. It is particularly important in the context of BI queries as these often calculate aggregations on certain periods of time (e.g., on a month).
CP-8.6 Handling paths.
Note on terminology.TheGlossary of graph theory termspage of Wikipedia4definespathsas follows: “A path may either be a walk (a sequence of vertices and edges, with both endpoints of an edge appearing adjacent to it in the sequence) or a simple path (a walk with no repetitions of vertices or edges), depending on the source.”
In this work, we use the first definition, which is more common in modern graph database systems and is also followed in a recent survey on graph query languages [3].
Handling paths as first-class citizens is one of the key distinguish- ing features of graph database systems [2]. Hence, additionally to reachability-style checks, a language should be able to express queries that operate on elements of a path, e.g., calculate a score on each edge of the path. Also, some use cases specify uniqueness constraints on paths, e.g., that a certain path must not have repeated nodes (referred to as “walks” in graph theory) or not have repeated edges (“trails” in graph theory). More precisely, paper [3] defines homomorphism-based semantics(no constraints on repetitions) and multiple flavors ofisomorphism-based semantics:
• no-repeated-node semantics(also known asfully isomorphic matching),
• no-repeated-edge semantics(also known asedge-isomorphic matching),
• no-repeated-anything semantics(not used in the context of this work).
B QUERY DESCRIPTIONS
We present a short textual specification for each query in the bench- mark. The title of queries discussed in the paper are underlined.
Q1. Posting summary.Given a date, find allMessagescreated before that date. Group them by a 3-level grouping:
1. by year of creation
2. for each year, group intoMessagetypes: isCommentor not 3. for each year-type group, split into four groups based on
length of their content
•0: 0 <= length < 40 (short)
•1: 40 <= length < 80 (one liner)
3PostgreSQL defines theOVERkeyword to use aggregation functions as window func- tions, and therank()function to produce numerical ranks, see https://www.postgresql.
org/docs/9.1/static/tutorial-window.html for details.
4https://en.wikipedia.org/wiki/Glossary_of_graph_theory_terms
• 2: 80 <= length < 160 (tweet)
• 3: 160 <= length (long)
Q2. Top tags for country, age, gender, time.Select allMessagescre- ated in the range of[startDate, endDate]byPersonslocated in country1orcountry2. Select the creatorPersonsand theTagsof theseMessages. Split thesePersons,TagsandMessagesinto a 5-level grouping:
1. name of country ofPerson, 2. month theMessagewas created, 3. gender ofPerson,
4. age group ofPerson, defined as years between person’s birth- day and end of simulation (2013-01-01), divided by 5, rounded down (partial years do not count),
5. name of tag attached toMessage.
Consider only those groups where number ofMessagesis greater than 100.
Q3. Tag evolution.Find theTagsthat were used inMessagesduring the givenmonthof the givenyearand theTagsthat were used during the next month. For theTagsand for both months, compute the count ofMessages.
Q4. Popular topics in a country. Given aTagClassand aCountry, find all theForumscreated in the givenCountry, containing at least onePostwithTagsbelonging directly to the givenTagClass. The location of aForumis identified by the location of theForum’s moderator.
Q5. Top posters in a country.Find the most popularForumsfor a givenCountry, where the popularity of aForumis measured by the number of members thatForumhas from the givenCountry.
Calculate the top 100 most popularForums. In case of a tie, the forum(s) with the smaller id value(s) should be selected. For each memberPersonof the 100 most popularForums, count the number ofPosts(postCount) they made in any of those (most popular) Forums. Also include those memberPersonswho have not posted any messages (have apostCountof 0).
Q6. Most active Posters of a given Topic.Get eachPerson(person) who has created aMessage(message) with a givenTag(direct re- lation, not transitive). Considering only these messages, for each Personnode:
•Count itsmessages (messageCount).
•Countlikes(likeCount) to itsmessages.
•CountComments(replyCount) in reply to itmessages.
Thescoreis calculated according to the following formula:1 * messageCount + 2 * replyCount + 10 * likeCount.
Q7. Most authoritative users on a given topic.Given aTag, find allPersons(person) that ever created aMessage(message1) with the givenTag. For each of thesePersons(person) compute their
“authority score” as follows:
•The “authority score” is the sum of “popularity scores” of the Persons(person2) that liked any of thatPerson’sMessages (message2) with the givenTag.
•APerson’s (person2) “popularity score” is defined as the total number of likes on all of theirMessages(message3).
Q8. Related topics. Find allMessagesthat have a givenTag. Find the relatedTagsattached to (direct) replyCommentsof theseMessages, but only of those replyCommentsthat do not have the givenTag.
Group theTagsby name, and get the count of replies in each group.
Q9. Forum with related Tags.Given twoTagClasses(tagClass1and tagClass2), findForumsthat contain
• at least onePost(post1) with aTagwith a (direct) type of tagClass1and
• at least onePost(post2) with aTagwith a (direct) type of tagClass2.
Thepost1andpost2nodes may be the samePost. Consider the Forumswith a number of members greater than a giventhreshold. For every suchForum, count the number ofpost1nodes (count1) and the number ofpost2nodes (count2).
Q10. Central Person for a Tag. Given aTag, find allPersonsthat are interested in theTagand/or have written aMessage(Postor Comment) with acreationDateafter a givendateand that has a givenTag. For eachPerson, compute thescoreas the sum of the following two aspects:
• 100, if thePersonhas thisTagas their interest, or 0 otherwise
• number ofMessagesby thisPersonwith the givenTag Also, for eachPerson, compute the sum of the score of thePerson’s friends (friendsScore).
Q11. Unrelated replies. Find thosePersonsof a givenCountrythat replied to anyMessage, such that the reply does not have anyTagin common with theMessage(only direct replies are considered, tran- sitive ones are not). Consider only those replies that do no contain any word from a givenblacklist. For eachPersonand valid reply, retrieve theTagsassociated with the reply, and retrieve the number oflikeson the reply. The detailed conditions for checking black- listed words are currently as follows. Words donothave to stand separately, i.e. if the word “Green” is blacklisted, “South-Greenland”
cannot be included in the results. Also, comparison should be done in a case-sensitive way. These conditions are preliminary and might be changed in later versions of the benchmark.
Q12. Trending Posts.Find allMessagescreated after a givendate (exclusive), that received more than a given number of likes (likeThreshold).
Q13. Popular Tags per month in a country.Find allMessagesin a givenCountry, as well as theirTags. GroupMessagesby creation yearandmonth. For each group, find the 5 most popularTags, where popularity is the number ofMessages(from within the same group) where theTagappears. Note: even if there are noTagsfor Messagesin a givenyearandmonth, the result should include the yearandmonthwith an emptypopularTagslist.
Q14. Top thread initiators. For eachPerson, count the number of Poststhey created in the time interval[startDate, endDate]
(equivalent to the number of threads they initiated) and the number ofMessagesin each of their (transitive) reply trees, including the rootPostof each tree. When calculatingMessagecounts only con- sider messages created within the given time interval. Return each Person, number ofPoststhey created, and the count of allMessages
that appeared in the reply trees (including thePostat the root of tree) they created.
Q15. Social normals.Given aCountrycountry, determine the “so- cial normal”, i.e. the floor of average number of friends thatPersons of countryhave incountry. Then, find allPersonsincountry, whose number of friends incountryequals the social normal value.
Q16. Experts in social circle.Given a Person, find all other Per- sonsthat live in a givencountryand are connected to givenPer- sonby a transitive path with length in range[minPathDistance, maxPathDistance]through theknows relation. In the path, an edge can be only traversed once while nodes can be traversed mul- tiple times. For each of thesePersons, retrieve all of theirMessages that contain at least oneTagbelonging to a givenTagClass(direct relation not transitive). For eachMessage, retrieve all of itsTags.
Group the results byPersonsandTags, then count theMessagesby a certainPersonhaving a certainTag.
Q17. Friend triangles.For a givencountry, count all the distinct triples ofPersonssuch that:
•ais friend ofb,
•bis friend ofc,
•cis friend ofa.
Distinct means that given a triplet1in the result setRof all qualified triples, there is no triplet2inRsuch thatt1andt2have the same set of elements.
Q18. How many persons have a given number of messages.For each Person, count the number ofMessagesthey made (messageCount).
Only countMessageswith the following attributes:
•Itscontent is not empty (and consequently, imageFile empty forPosts).
•Itslengthis below thelengthThreshold(exclusive).
•ItscreationDateis afterdate(exclusive).
•It is written in any of the givenlanguages. The language of aPostis defined by itslanguageattribute. The language of aCommentis that of thePostthat initiates the thread where theCommentreplies to. ThePostandCommentsin the reply tree’s path (from theMessageto thePost) do not have to sat- isfy the constraints forcontent,lengthandcreationDate. For eachmessageCountvalue, count the number ofPersonswith exactlymessageCountMessages(with the required attributes).
Q19. Stranger’s interaction.For all thePersons(person) born af- ter a certaindate, find all thestrangers they interacted with, wherestrangers arePersonsthat do notknowperson. There is no restriction on the date thatstrangers were born. Consider only strangers that are
•members ofForumstagged with aTagwith a (direct) type oftagClass1and
•members ofForumstagged with aTagwith a (direct) type oftagClass2.
TheTagsmay be attached to the sameForumor they may be at- tached to differentForums. Interaction is defined as follows: the personhas replied to a Messageby thestrangerB(the reply might be a transitive one). For eachperson, count the number of
strangersthey interacted with (strangerCount) and total num- ber of times they interacted with them (interactionCount).
Q20. High-level topics.For all givenTagClasses, count number of Messagesthat have aTagthat belongs to thatTagClassor any of its children (all descendants through a transitive relation).
Q21. Zombies in a country. Find zombies within the givencountry, and return their zombie scores. A zombie is a Person created before the givenendDate, which has created an average of[0, 1)Messagesper month, during the time range between profile’s creationDateand the givenendDate. The number of months spans the time range from thecreationDateof the profile to the endDatewith partial months on both end counting as one month (e.g. acreationDateof Jan 31 and anendDateof Mar 1 result in 3 months). For eachzombie, calculate the following:
• zombieLikeCount: the number oflikesreceived from other zombies.
• totalLikeCount: the total number oflikesreceived.
• zombieScore:zombieLikeCount/totalLikeCount. If the value of totalLikeCount is 0, the zombieScore of the zombieshould be 0.
For bothzombieLikeCountandtotalLikeCount, only consider likesreceived from profiles created before the givenendDate.
Q22. International dialog. Consider all pairs of people(person1, person2)such that one is located in aCityofCountrycountry1 and the other is located in aCityofCountrycountry2. For each CityofCountrycountry1, return the highest scoring pair. The score of a pair is defined as the sum of the subscores awarded for the following kinds of interaction. The initial value isscore = 0. 1. person1has created a replyCommentto at least oneMessage
byperson2:score += 4
2. person1has created at least oneMessagethatperson2has created a replyCommentto:score += 1
3. person1andperson2knoweach other:score += 15 4. person1liked at least oneMessagebyperson2:score +=
10
5. person1has created at least oneMessagethat was liked by person2:score += 1
To break ties, order by (1) person1.id ascending and (2) person2.idascending.
Q23. Holiday destinations. Count theMessagesof all residents of a givenCountry, where the message was written abroad. Group the messages bymonthanddestination. AMessagewas written abroad if itis located inaCountrydifferent thanhome.
Q24. Messages by Topic and Continent. Find allMessagestagged with aTagthat has the (direct) type of the giventagClass. Count allMessagesand their likes grouped byContinent,year, andmonth. Q25. Weighted interaction paths. Given twoPersons, find all (un- weighted) shortest paths between these twoPersons, in the subgraph induced by theknowsrelationship. Then, for each path calculate a weight. The nodes in the path arePersons, and the weight of a path is the sum of weights between every pair of consecutivePerson nodes in the path. The weight for a pair ofPersonsis calculated based on their interactions:
● ● ●
●
●
●
●
●
●
●
● ●
●
●
●
● ●
●
●
● ●
●
●
●
●
●
●
●
●
●
21 22 23 24 25
16 17 18 19 20
11 12 13 14 15
6 7 8 9 10
1 2 3 4 5
1 3 10 1 3 10 1 3 10 1 3 10 1 3 10
0.1 0.3 1 3
0.1 0.3 1 3 10 30
0.001 0.003 0.01
0.1 0.3 1 3 10 30 100
0.1 0.3 1 0.03
0.1 0.3
0.3 1 3 10
0.1 0.3 1 3 10 30
3 10 30 100 300 1000
0.1 0.3 1 3 10 30 3
10
0.03 0.1 0.3 1 3 10
0.3 1 3
10 30 100 300
0.03 0.1 0.3 0.3
1
3 10 30
0.1 0.3 1 3 10 30
0.003 0.01 0.03 0.1 0.3
3 10 30 100 300 10
30
0.1 0.3 1 3 10
0.1 0.3 1 3 10 30
1 3 10
0.003 0.01 0.03 0.1 0.3
Scale factor [#nodes/edges − SF1: 3/17M, SF3: 9/52M, SF10: 30/177M]
Execution time [s]
●Oracle Labs PGX PostgreSQL Sparksee
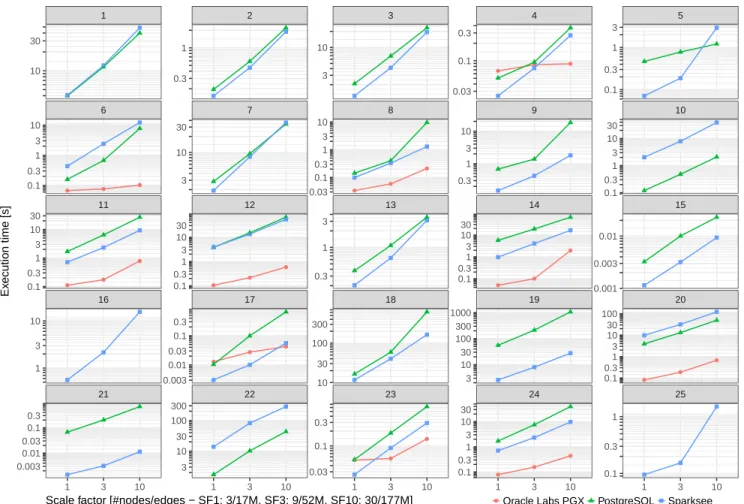
Figure 1: Execution time of the BI queries.
•Every direct reply (by one of thePersons) to aPost(by the otherPerson) contributes 1.0.
•Every direct reply (by one of thePersons) to aComment(by the otherPerson) contributes 0.5.
Only considerMessagesthat were created in aForumthat was created within the timeframe[startDate, endDate]. Note that forComments, the containingForumis that of thePostthat the comment (transitively) replies to. Return all paths with thePerson ids ordered by their weights descending.
C RESULTS FOR ALL SNB BI QUERIES
Systems.We performed benchmarks on multiple commercial data- base systems and analytical engines:
•the Oracle Labs PGX graph analytical system (with queries formulated in the declarative PGQL language [33]),
•the PostgreSQL relational database management system (with queries formulated in PostgreSQL’s SQL dialect [21]),
• Sparksee native graph database (with queries formulated in imperative C++code).
Environment.Benchmarks for PostgreSQL and Sparksee were exe- cuted on a cloud VM with 8 Xeon E5-2673 CPU cores and 256 GB RAM, running Ubuntu 16.04. Benchmarks for Oracle Labs PGX were executed on 16 Xeon E5-2660 CPU cores and 256 GB RAM, running Oracle Linux Server 6.8.
Methodology. We executed 100 queries for warmup, then executed 250 queries and measured their response time. Queries were se- lected randomly, following a uniform distribution and were exe- cuted one-by-one, i.e. with no interleave between them. For each scale factor/tool/query, we calculated the geometric mean of execu- tion times (as recommended in [13]).
Results.Figure 1 shows benchmark results for all 25 queries speci- fied in the LDBC SNB Business Intelligence benchmark.