Full Terms & Conditions of access and use can be found at
http://www.tandfonline.com/action/journalInformation?journalCode=ijog20
Journal of Obstetrics and Gynaecology
ISSN: 0144-3615 (Print) 1364-6893 (Online) Journal homepage: http://www.tandfonline.com/loi/ijog20
Evaluation of the relation between placental weight and placental weight to foetal weight ratio and the causes of stillbirth: a retrospective comparative study
Norbert Pásztor, János Sikovanyecz, Attila Keresztúri, Zoltan Kozinszky &
Gábor Németh
To cite this article: Norbert Pásztor, János Sikovanyecz, Attila Keresztúri, Zoltan Kozinszky &
Gábor Németh (2018) Evaluation of the relation between placental weight and placental weight to foetal weight ratio and the causes of stillbirth: a retrospective comparative study, Journal of Obstetrics and Gynaecology, 38:1, 74-80, DOI: 10.1080/01443615.2017.1349084
To link to this article: https://doi.org/10.1080/01443615.2017.1349084
Published online: 03 Oct 2017.
Submit your article to this journal
Article views: 118
View Crossmark data
ORIGINAL ARTICLE
Evaluation of the relation between placental weight and placental weight to foetal weight ratio and the causes of stillbirth: a retrospective comparative study
Norbert Pasztora, Janos Sikovanyecza, Attila Kereszturi a, Zoltan Kozinszkyb and Gabor Nemetha
aDepartment of Obstetrics and Gynecology, University of Szeged, Szeged, Hungary;bDepartment of Obstetrics and Gynecology, Blekinge Hospital, Karlskrona, Sweden
ABSTRACT
The aim of the present study was to evaluate the clinical importance of placental weight (PW) and pla- cental weight to foetal weight (PW/FW) ratio according to maternal characteristics, pathological condi- tions in obstetrics and the causes of foetal death by category in stillbirths. The results of autopsies and placental histopathological examinations for 145 singleton stillbirths were reviewed retrospectively.
Pathological features of the placenta were significantly associated with lower PW compared to the group with no pathological placental parameters (230 grams versus 295 grams,p¼.045). Foetal growth restriction (FGR) with pre-eclampsia (PE) was accompanied by significantly lower FW, PW and PW/FW compared to FGR cases without PE (1045 grams versus 1405 grams,p¼.026, 200 grams versus 390 grams,p¼.006 and .19 versus .24,p¼.037, respectively), whereas a similar trend was not observed in the non-FGR pregnancies complicated by PE. Oligohydramnios was accompanied by lower foetal weight compared to those who had normal amount of amniotic fluid (650 grams versus 1400 grams,p¼.006).
Among the clinical factors, only PE and oligohydramnios contributed to disproportionate fetoplacental growth in stillbirth, while none of the categories of stillbirth was related to unequal fetoplacental growth.
IMPACT STATEMENT
What is already known on this subject:In 27% of stillbirths, pathological features of the placenta or placental vascular bed are recorded. Underlying placental pathology contributes to foetal growth restriction (FGR) in approximately 50%. Although placental weight relative to foetal weight (PW/FW ratio) is an indicator of foetal as well as placental growth, data on PW/FW in stillbirth has not yet been published.
What the results of this study add: Causes of death do not show any correlation with PW/FW ratio. Placentas derived from pregnancies complicated by pre-eclampsia (PE) and concomitant FGR are smaller and PW/FW is also diminished. Oligohydramnios is associated with an enhanced risk of restricted placental growth. FGR is not correlated with any categories of causes of death.
What the implications are of these findings for clinical practice and/or further research:
Sonographic follow-up of placental volume and FW can predict the stillbirth in PE complicated by FGR and oligohydramnios.
KEYWORDS Autopsy; histology of placenta; stillbirth; placental weight; foetal weight;
placental weight to foetal weight ratio
Introduction
Stillbirth is defined as a birth of an infant with no vital signs at or after 24 weeks of gestation (de Bernis et al. 2016).
Around 2.6 million stillbirths are estimated worldwide (de Bernis et al. 2016). Stillbirth rate is a widely acknowledged indicator of the quality of health care. The stillbirth rate in Hungary in 2015 was 3.7% (Hungarian Central Statistical Office 2016), which was comparable to the corresponding data from the other industrialised countries (1.3–5.7%) (de Bernis et al.2016). The rate of stillbirths has decreased in the recent decades; however, a further decrease is considered to be clearly necessary. This goal may be reached via analyses of causes provided by autopsies and histopathological exami- nations, which would hopefully fill knowledge gaps and
facilitate an improvement in perinatal care guidelines (Blencowe et al.2016).
The placenta influences the weight of foetus until birth, and its abnormalities might lead to a decreased nutritional supply to the foetus and result in foetal growth restriction (FGR) or even stillbirth (Hasegawa et al. 2011). Placental lesions identified in cases of stillbirth can be frequently invoked as having a causal role, but the proportion of unex- plained causes still remains high (Hasegawa et al. 2011). On the other hand, FGR can be often associated with smaller pla- centa and other adverse clinical conditionsin uterothat could also lead to stillbirth (Monk and Moore2004). However, foetal weight (FW) can be misleading (Figueras and Gardosi 2011), because a foetus with small-for-gestational-age can be small only constitutionally, whereas foetuses with an apparently
CONTACTNorbert Pasztor hirt78@gmail.com Department of Obstetrics and Gynecology, University of Szeged, Szeged, Hungary These authors contributed equally to this work
ß2017 Informa UK Limited, trading as Taylor & Francis Group VOL. 38, NO. 1, 74–80
https://doi.org/10.1080/01443615.2017.1349084
normal FW may suffer from growth retardation (Figueras and Gardosi 2011). A placental weight to foetal weight (PW/FW) ratio has been introduced to be indicative (Lao and Wong 1996) of placental function and as one of the determining factors for the foetal growth potential.
In high-risk, liveborn pregnancies, the importance of FW, placental weight (PW) and PW/FW ratio has been previously monitored in detail. A disproportionate PW versus FW pattern has been formed inducing complications in pregnancy (Mayhew et al. 2007; Haavaldsen et al. 2013; Strom-Roum et al.2013). It is assumed that pathological alterations of pla- centa might lead to lower PW/FW in live births (Mayhew et al.2007), but this has not yet been investigated in cases of foetal deaths. In studies on stillbirths, only PW/FW ratio has been studied in populations (Hasegawa et al. 2011;
Haavaldsen et al.2013), where the causes of stillbirth are not analysed, though this may be well helpful in evaluating the pathological states of placenta (Smith2010).
Therefore, the aim was to assess the differences in some pathological conditions during pregnancy and the causes of death by categories based on foetal autopsy, and placental histopathological results as well as clinical data for stillbirths with respect to PW and PW/FW ratio.
Material and methods
This was a retrospective study of placental histopathological and foetal autopsy records of all the stillborn babies at the Department of Obstetrics and Gynecology, University of Szeged, from January 1996 to May 2013. The department was a tertiary care centre located in South-East Hungary and the total population of the region amounts to around 1.8 million people. The total number of live births in the area was approximately 7000 per year with an annual stillbirth rate of 3.1–7.4%. The department provides antenatal care for prema- ture infants (<37 weeks) and for stillbirths in the third trimester.
Both autopsy and placental histological examinations were performed in all cases. Stillbirth was defined as foetal death prior to or at the delivery. Multiple pregnancies were excluded from the study. In accordance with Hungarian regu- lations, only stillbirths with a weight of500 g and/or a ges- tational age (GA) of24 weeks were sorted out. The GA was determined by sonographic measurement of the embryo in the first trimester. The clinical obstetric and sociodemo- graphic data were also collected.
After the labour, both the foetus and the placenta were weighed at the delivery suite without umbilical cord and membranes. Autopsies and placental histopathological exami- nations were conducted by pathologists based on standard guidelines (Benirschke and Kaufmann 1995; Siebert 2007).
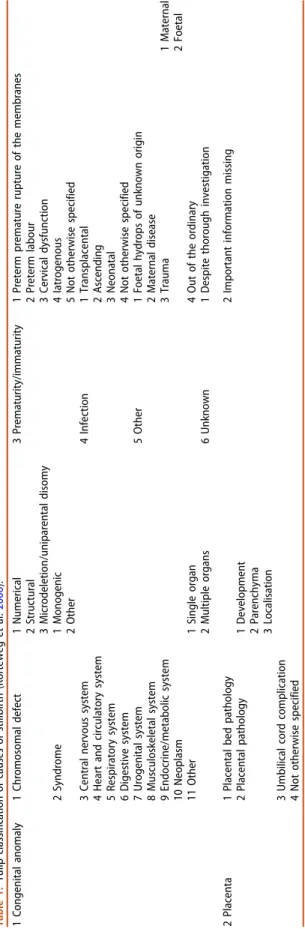
The Tulip classification was applied to the present population;
relevant categories for causes of death were determined as described earlier (Korteweg et al. 2006) (Table 1). Briefly, the Tulip classification system categorises foetal death by under- lying causes and pathomechanisms on the basis of both clin- ical and pathological findings, with a relatively low percentage of unknown causes. Furthermore, Tulip classifica- tion allows good inter-rater agreement and was easy to use
for the clinicians (Korteweg et al.2006). Subcategories for pla- cental pathology were demonstrated in detail. The pathology of placental bed was characterised by inadequate spiral artery remodelling and/or pathological signs in spiral arteries lead- ing to uteroplacental vascular insufficiency. Placental path- ology involves morphologic abnormalities, disorders of parenchyma and abnormal localisation of placenta. Umbilical cord complication comprises a constricting knot/loop around the neck, which could be recognised by histopathological evi- dence of foetal vascular obstruction. Manifestation of infec- tion implied evidence of organ involvement with organism and/or diagnosing infectious findings in placental tissue.
Other foetal or maternal pathological conditions leading to foetal death may be responsible for other causes (Korteweg et al.2006).
The PW/FW ratio was established at birth. A foetus with FGR was qualified as a foetus having a FW below the 10th percentile of population (American College of Obstetricians and Gynecologists 2013), using the Hungarian birthweight centiles (Joubert2000). Hypertensive disorders were classified by the presence of pre-eclampsia (PE), pregnancy-induced hypertension or essential hypertension.
The results of Kolmogorov–Smirnov test revealed that the data did not demonstrate a normal distribution, and Spearman’s rank correlation was used to measure the statis- tical dependence between two continuous variables.
Kruskal–Wallis signed-rank test was carried out to find out whether FW, PW and PW/FW ratio had an equal distribution in the foetal death categories in total. Multivariate logistic regression was done to evaluate the effects of various study factors on FW, PW and PW/FW ratio adjusted for GA. Logistic regression coefficient values and equations involving GA were also calculated when the effect of factor studied on FW, PW or PW/FW was significant. FW, PW and PW/FW ratio were unravelled in different clinical and obstetric settings and in pursuance to causes of stillbirth. The category of interest was compared to all other categories for each comparison.
Wilcoxon signed-rank tests were utilised to analyse the asso- ciations between the causes of foetal death on FW, PW and PW/FW ratio in the overall dataset. The distributions of PW and PW/FW ratio by causes of stillbirth were plotted against GA, and regression curve analyses were accomplished using the following models: linear, logarithmic, inverse, S-shaped curve, logistic and exponential relationships. SPSS 17.0 (SPSS Statistics, Chicago, IL) was for the analyses. Statistical signifi- cance was defined at the two-sided p¼.05 level. This study was approved by the clinical research ethical committee of the University of Szeged and exempted from further revision because it contained only retrospective data.
Results
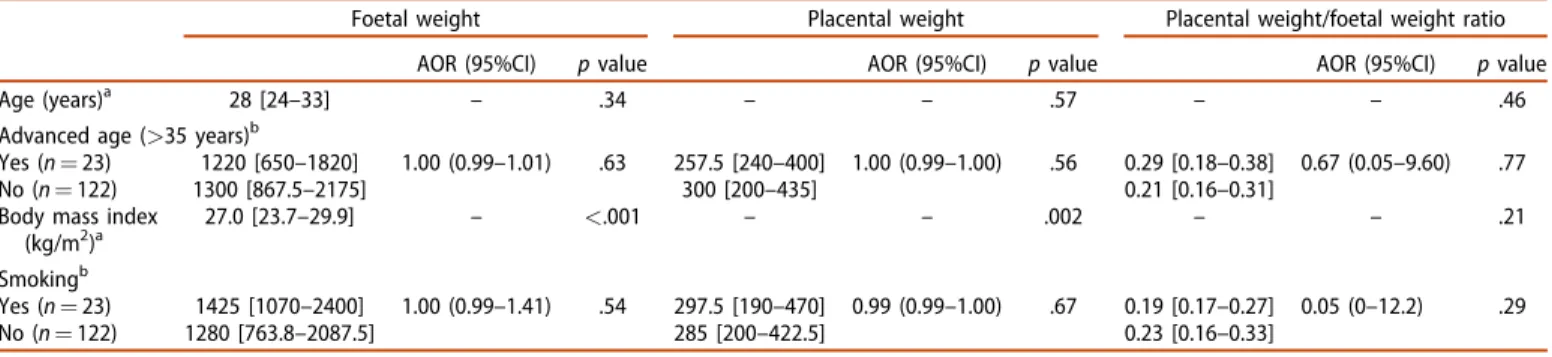
During the study period, 145 singleton stillbirths were regis- tered out of a total number of 37,010 births (3.9%). All single- ton stillbirths were analysed, but 18 multiple pregnancies were excluded (0.49%) from the study. Clinical risk factors are presented inTable 2. A higher body mass index (BMI) for the pregnant woman was associated with a significantly higher PW (rho: 0.27,p¼.002) and FW (rho: 0.31,p<.001).
JOURNAL OF OBSTETRICS AND GYNAECOLOGY 75
Table 3 provides an overview of the obstetric characteris- tics. FGR was associated with significantly lower PW and FW, but was not correlated with PW/FW ratio. The equations for logistic regression for the prediction of a presumed growth retardation among stillbirths were Y¼ 0.480.01PW þ0.10GA or Y¼ 52.030.01FWþ0.23GA. Stillbirths in pregnancies complicated by PE had higher odds for a sig- nificantly lower PW and a reduced PW/FW ratio, whereas PE was not significantly linked to a smaller FW. The equations for logistic regression for the prediction of supposed PE were Y¼ 5.780.01PWþ0.23GA or Y¼2.417.09PW/FW ratio 0.08GA. Presumably, oligohydramnios was repre- sented by lower FW (FGR was found in 16 cases out of 17) [Y¼ 5.370.02FWþ0.21GA]. Presumably, diabetes mellitus did not exhibit any relation to PW or PW/FW ratio;
instead it was linked to higher FW [Y¼4.35þ0.01FW 0.28GA].
Table 4 shows data distribution according to causes of death by categories. The categories include congenital anom- aly (4.1%), placental bed pathology (36.6%), placenta path- ology (6.9%), complication in umbilical cord (16.6%), infection (8.3%), other causes (11.0%) and unknown cause (16.6%). In congenital anomalies, the cause of death can be explained by a genetic or structural defect. The FGR rates were not sig- nificantly different in the stillbirth categories (data are not shown in the Table). None of the causes of foetal death were significantly matched with FW, PW or PW/FW ratio as com- pared to all the other causes, except that a lower PW was sig- nificantly connected with placental pathology.
Table 5 depicts the analyses performed with the help of multiple logistic regression on the factors of special interest and adjusted separately for GA. Presumably PE had an inten- sified deteriorating effect on FW and impaired PW and PW/
FW ratio among stillbirths with FGR. In contrast, in cases of normal foetal growth, supposed PE was not significantly linked to deviation of either PW or FW.
The regression curve analyses indicate that the plotted PW can be fitted well along an exponential curve in groups where umbilical cord shows pathological manifestation (p<.001), placental bed pathology (p<.001) and placental pathology (p¼.008), while no significant trend line could be detected for congenital abnormality, infection, other causes or unknown causes. There was no significant regression to be fitted to PW/FW ratio in the groups of causes.
FW showed the most robust evidence in maintaining an inverse relationship with GA in groups with placental bed pathology (p<.001), placental pathology (p<.003) and other causes (p<.001), whereas the curve analysis did not unfold significant regression for congenital anomalies, pathological manifestation in umbilical cord or infection. FW increased along an S-shaped curve as the gestation advanced (p¼.001) in cases with an unknown pathological background.
Discussion
In this retrospective cohort study, FW, PW and PW/FW ratio were assayed in relation to risk factors and causes of foetal death, but the results refer to the fact that these parameters had relevance in certain clinical conditions. In almost half of
Table1.Tulipclassificationofcausesofstillbirth(Kortewegetal.2006). 1Congenitalanomaly1Chromosomaldefect1Numerical3Prematurity/immaturity1Pretermprematureruptureofthemembranes 2Structural2Pretermlabour 3Microdeletion/uniparentaldisomy3Cervicaldysfunction 2Syndrome1Monogenic4Iatrogenous 2Other5Nototherwisespecified 3Centralnervoussystem4Infection1Transplacental 4Heartandcirculatorysystem2Ascending 5Respiratorysystem3Neonatal 6Digestivesystem4Nototherwisespecified 7Urogenitalsystem5Other1Foetalhydropsofunknownorigin 8Musculoskeletalsystem2Maternaldisease 9Endocrine/metabolicsystem3Trauma1Maternal 10Neoplasm2Foetal 11Other1Singleorgan4Outoftheordinary 2Multipleorgans6Unknown1Despitethoroughinvestigation 2Placenta1Placentalbedpathology2Importantinformationmissing 2Placentalpathology1Development 2Parenchyma 3Localisation 3Umbilicalcordcomplication 4Nototherwisespecified
the cases (47%), the birth weight of the foetus was below the 10th percentile, pointing to the importance of abnormal foe- tal growth in stillbirth. FGR was proved to be associated with lower PW in stillbirth, but PW/FW ratio did not display any significant difference. These results were consistent with a previous theory that placental volume and surface area were the primary determining factors of foetal growth (Salafia et al.2006). In pregnancies resulting in live birth, infants with FGR had a significantly lower PW/FW ratio than that of infants with appropriate growth (Heinonen et al. 2001). In contrast, the stillbirth dataset presented in this study revealed
that PW and FW were proportionally reduced throughout pregnancies in which the foetus was small, leading to non- significant difference in PW/FW ratio regarding stillbirths with a birth weight that was appropriate for GA.
It can be hypothesised that placental function is more impaired in FGR cases with stillbirth compared to FGR cases with live birth, having a consequence of lower birth weight and subsequently unchanged PW/FW ratio when foetal death happens. Accordingly, it is of clinical importance that in using ultrasound to screen for FGR, it may be useful to measure the placental volume that denotes PW, and to calculate PW/
Table 2. Influence of risk factors affecting mothers of singleton stillbirths (N¼145) on placental weight and placental ratio (placental weight/foetal weight).
Foetal weight Placental weight Placental weight/foetal weight ratio
AOR (95%CI) pvalue AOR (95%CI) pvalue AOR (95%CI) pvalue
Age (years)a 28 [24–33] – .34 – – .57 – – .46
Advanced age (>35 years)b
Yes (n¼23) 1220 [650–1820] 1.00 (0.99–1.01) .63 257.5 [240–400] 1.00 (0.99–1.00) .56 0.29 [0.18–0.38] 0.67 (0.05–9.60) .77
No (n¼122) 1300 [867.5–2175] 300 [200–435] 0.21 [0.16–0.31]
Body mass index (kg/m2)a
27.0 [23.7–29.9] – <.001 – – .002 – – .21
Smokingb
Yes (n¼23) 1425 [1070–2400] 1.00 (0.99–1.41) .54 297.5 [190–470] 0.99 (0.99–1.00) .67 0.19 [0.17–0.27] 0.05 (0–12.2) .29
No (n¼122) 1280 [763.8–2087.5] 285 [200–422.5] 0.23 [0.16–0.33]
Data are expressed in median [interquartile range].
aSpearman’s correlation.
bMultiple logistic regression adjusted for gestational age.
AOR: adjusted odds ratio; CI: confidence interval; kg/m2: kilogram/metre2.
Table 3.Correlations between obstetric characteristics of pregnancies affected by stillbirth (N¼145) and placental weight and placental ratio (placenta weight/
foetal weight).
Foetal weight Placental weight
Placental weight/foetal weight ratio
AOR (95%CI) pvalue AOR (95%CI) pvalue
AOR
(95%CI) pvalue Gestational age
(weeks ± SD)a
31.0 [28–35] – <.001 – – <.001 – – <.001
Previous spontaneous abortionb
Yes (n¼26) 1260 [883.8–2475] 1.00 (0.99–1.01) .79 300 [200–500] 1.00 (0.99–1.00) .46 0.23 [0.17–0.31] 0.61 (0.03–14.08) .76
No (n¼119) 1325 [794–2050] 272.5 [200–412.5] 0.22 [0.16–0.31]
Previous stillbirthsb
Yes (n¼7) 950 [530–1725] 1.00 (0.99–1.01) .96 240 [240–395] 0.99 (0.99–1.01) .62 0.29 [0.19–0.42] 0.87 (0.01–50.6) .95
No (n¼138) 1300 [840–2105] 287.5 [200–432.5] 0.22 [0.16–0.31]
Foetal growth restrictionb
Yes (n¼68) 1380 [925–1980] 0.99 (0.98–0.99) <.001 265 [200–450] 0.99 (0.99–0.99) <.001 0.23 [0.16–0.34] 3.33 (0.28–39.36) .34
No (n¼77) 1270 [788–2250] 330 [200–405] 0.19 [0.16–0.28]
Pre-eclampsiab,c
Yes (n¼21) 1300 [825–2040] 0.99 (0.99–1.01) .20 200 [180–270] 0.99 (0.98–0.99) .001 0.18 [0.12–0.26] 0.001 (0.00–0.91) .047
No (n¼113) 1325 [813–2088] 330 [213–445] 0.23 [0.17–0.34]
Hypertension during pregnancyb,d
Yes (n¼13) 1300 [850–2518] 1.00 (0.99–1.00) .84 250 [200–395] 0.99 (0.99–1.01) .12 0.20 [0.12–0.31] 0.07 (0.00–62.8) .44
No (n¼114) 1300 [815–2085] 325 [208.8–443] 0.23 [0.17–0.33]
Oligohydramniosb
Yes (n¼17) 650 [373–1142] 0.99 (0.99–0.99) .006 200 [150–380] 0.99 (0.99–1.01) .24 0.31 [0.19–0.42] 1.72 (0.17–17.8) .65
No (n¼128) 1400 [925–2200] 295 [209–440] 0.22 [0.16–0.30]
Any type of diabetes mellitusb
Yes (n¼12) 1392.5 [1131.3–2393] 1.01 (1.01–1.02) .03 340 [218–425] 1.00 (0.99–1.00) .34 0.21 [0.15–0.28] 0.03 (0.00–62.7) .37
No (n¼133) 1300 [810–2080] 285 [200–430] 0.22 [0.16–0.31]
Data are expressed in median [interquartile range].
aSpearman’s correlation.
bMultiple logistic regression adjusted for gestational age.
cPregnancies with pre-eclampsia were compared to all other pregnancies with the exception of those with hypertension (n¼113).
dPregnancies with hypertension were compared to all other pregnancies with the exception of those with pre-eclampsia, which were excluded from the control group (n¼114).
AOR: adjusted odds ratio; CI: confidence interval.
JOURNAL OF OBSTETRICS AND GYNAECOLOGY 77
FW, which offers the possibility of risk assessment of conse- quential foetal death. Moreover, during serial screening of pregnancies with FGR, placental and PW/FW growth charts can be utilised in order to predict foetal death.
Data suggest that PE has a profound effect on PW and PW/FW ratio among stillbirths, even though in patients of present study predominantly mild PE could be seen. This is in contrast to the results from an earlier study conducted on liveborn babies (Mayhew et al. 2003). Furthermore, if FGR develops in pregnancy with PE, then PE might have a deteri- orating effect on FW, PW and PW/FW ratio, thus yielding a significantly lower FW, PW and PW/FW ratio in such com- bined cases as compared to those with FGR only. This is in accordance with the findings from a previous study on live births (Mayhew et al. 2004). A similar association could be
demonstrated in early phase of pregnancy by Hafner et al.
(2003). When FGR is associated with PE, the placental growth is reduced throughout the first and second trimesters. The results of the present study allude to the fact that abnormal placental development can continue in the early third trimes- ter, generating stillbirth in these cases.
No relation can be described between the PW or PW/FW ratio and the causes of stillbirth, although the study is limited due to the low number of stillbirths reported, thus producing the range of statistical power between 45% and 91%. The trends in PW and PW/FW ratio are similar in each group of foetal death. Furthermore, the dataset in present study sig- nals that pathological characteristics of placenta and patho- logical features of placental bed verified by histopathological examinations have no specific effect on FW, whereas a
Table 4. Relationships of the causes of death by categories to stillbirths based on TULIP-classification (N¼145) and the placental weight and placental ratio (placenta weight/birth weight).
Foetal weight Placental weight Placental weight/foetal weight ratio
AOR (95%CI) pvalue AOR (95%CI) pvalue AOR (95%CI) pvalue
Causes of death by categories according to TULIP classification 1. Congenital anomalya
Yes (n¼6) 1525 [980–2365] 1.00 (0.99–1.00) .21 300 [230–415] 0.99 (0.99–1.01) .38 0.16 [0.13–0.23] 0.01 (0.01–23.65) .33
No (n¼139) 1300 [808–2083] 285 [200–428] 0.22 [0.17–0.32]
2. Placenta
2.1 Placental bed pathologya
Yes (n¼53) 1300 [780–2230] 1.00 (0.99–1.01) .87 302.5 [208–443] 1.00 (0.99–1.01) .25 0.23 [0.17–0.37] 1.00 (0.99–1.00) .42
No (n¼92) 1350 [820–2040] 285 [200–420] 0.22 [0.16–0.29]
2.2.1 Placental pathologya
Yes (n¼10) 1562 [619–2250] 1.00 (0.99–1.00) .96 230 [165–348] 0.99 (0.98–1.00) .045 0.19 [0.12–0.30] 0.29 (0.01–159) .70
No (n¼135) 1300 [818–2098] 295 [200–438] 0.22 [0.17–0.32]
2.3 Umbilical cord pathologya
Yes (n¼24) 1150 [620–2500] 1.01 (1.00–1.01) .056 230 [140–480] 1.01 (0.99–1.04) .56 0.23 [0.15–0.29] 1.40 (0.12–16.39) .79
No (n¼121) 1352 [866–2070] 300 [206–420] 0.22 [0.16–0.32]
3. Prematurity/Immaturity 4.1 Transplacental infectiona
Yes (n¼12) 1412 [1128–1965] 1.00 (0.99–1.00) .98 328 [200–405] 0.99 (0.99–1.00) .62 0.22 [0.19–0.28] 0.08 (0.00–93.0) .49
No (n¼133) 1300 [781–2150] 285 [200–440] 0.22 [0.16–0.32]
5.1 Other causes: Foetal hydrops of unknown origina
Yes (n¼16) 1810 [1172–2163] 1.00 (1.00–1.00) .15 300 [250–400] 1.00 (1.00–1.00) .30 0.20 [0.13–0.35] 0.24 (0.00–26.14) .55
No (n¼129) 1300 [764–2078] 273 [200–430] 0.22 [0.17–0.31]
6.1 Unknown: Despite thorough investigationa
Yes (n¼24) 1200 [750–2015] 1.00 (0.99–1.01) .78 340 [200–470] 1.00 (0.99–1.00) .47 0.23 [0.16–0.32] 3.72 (0.33–42.37) .29
No (n¼121) 1380 [840–2105] 285 [200–413] 0.22 [0.16–0.31]
Data are expressed in median [interquartile range].
aMultiple logistic regression adjusted for gestational age.
AOR: adjusted odds ratio; CI: confidence interval.
Table 5. Multiple logistic regression analyses on factors for placental insufficiency/pre-eclampsia among foetal growth restricted (FGR)a(n¼68) and non-FGRa (n¼77) stillbirths.
FGRa(n¼68)
Presumably pre-eclampsia (n¼12) Absence of pre-eclampsia (n¼56) pvalue AOR (95%CI)
Foetal weight 1045 [788–1813] 1405 [990–2040] .026 0.99 (0.99–1.00)
Placental weight 200 [200–260] 390 [241–495] .006 0.98 (0.97–0.99)
Placental weight/foetal weight ratio 0.19 [0.15–0.29] 0.24 [0.17–0.35] .037 0.00 (0.00–0.54)
Non-FGRa(n¼77)
Presumably pre-eclampsia (n¼9) Absence of pre-eclampsia (n¼68) pvalue
Foetal weight 1800 [1025–2468] 1188 [782–2180] .97 1.00 (0.99–1.00)
Placental weight 200 [170–410] 270 [200–405] .082 0.99 (0.98–1.00)
Placental weight/foetal weight ratio 0.18 [0.11–0.24] 0.20 [0.17–0.29] .280 0.00 (0.00–10.76)
Data are expressed in median [interquartile range].
aFGR: stillbirth with foetal growth restriction (defined as having a foetal weight below 10th percentile).
placental pathology depresses PW significantly. It is plausible that morphological abnormalities, histopathological changes and/or abnormal localisation might lead to diminished pla- cental volume, but Laurini et al. (1994) confirmed that FGR can be associated with even a small placental infarct. This is the consequence of widespread placental ischaemia sur- rounding the relevant area of infarction. On the other hand, an increased extension of parenchymal disorders of villi or intervillous space (i.e. massive perivillous fibrin deposition at 20% of placental area) may be tied to significantly deterio- rated placental function even in foetuses that are not affected by growth restriction.
True knots, umbilical cord torsion or loops are regarded as responsible for foetal demise in 16.5% of the studied cases.
Surprisingly, PW and PW/FW ratio do not differ from other causes. A part of these umbilical cord problems occurs as a sudden incident, but the role of chronic umbilical cord abnor- malities or loops cannot be excluded either. In support of this hypothesis, loops have even been identified in early ges- tation and can persist until delivery (Heifetz 1996). Cord abnormalities may interfere with placental development, since there are specific histopathological findings in cases of obstruction of the venous return from the placenta (Parast et al. 2008). However, the hemodynamic consequen- ces of such long-lasting umbilical cord entanglement on the foetal and placental circulation have not been sufficiently appraised yet.
The present study included all singleton stillbirths with complete histopathological results and obstetric data.
Findings from the present study indicate that sonographic evaluation of the increase in placental volume during the gestation can be utilised to predict the term of stillbirth in pregnancies with PE, oligohydramnios and FGR.
Live births were, however, not analysed in this study, yet the comparison of placental ratios in various clinical condi- tions in all pregnancies including those ending with live births and stillbirths could add a lot of important information on clinical management of pregnancies in order to avoid still- birth. Present study has small number of reported cases that reduces the statistical power. Most of the reports in the litera- ture state that smoking is a significant contributor to low PW and FW (Hasegawa et al. 2011), whereas the findings from this study refer to no link between smoking and these parameters, possibly due to the low number of cases. As a consequence, a larger study with sufficient statistical power is required to analyse the association between causes of death and weight parameters related to foetus/placenta.
Furthermore, it would be necessary to carry out a compre- hensive study in order to compare these parameters in still- births and live births with the determination of cut-offs of placental growth charts and PW/FW values that distinguish the two populations from each other.
Conclusions
This study seems to be the first that is published on PW and PW/FW ratio among the subgroups involved in stillbirth. It has been purported that PW/FW ratio does not provide fur- ther information on the cause of death in the event of
stillbirth. PE has a subtle negative effect on placental growth in case of stillbirth with either appropriate or low FW. As in pregnancies with liveborn infants, PE has an additional deteri- orating effect on placental growth in cases with foetal weight below the 10th percentile. Sonographic follow-up of placental volume may have clinical value in risk assessment of still- births in case of pregnancies associated with FGR.
Disclosure statement
The authors report no conflicts of interest.
ORCID
Zoltan Kozinszky http://orcid.org/0000-0001-7485-9895 Gabor Nemeth http://orcid.org/0000-0003-1829-3457
References
American College of Obstetricians and Gynecologists. 2013. ACOG Practice bulletin No. 134: fetal growth restriction. Obstetrics and Gynecology 121:1122–1133.
Benirschke K, Kaufmann P. 1995. Pathology of the human placenta. 3rd ed. New York: Springer-Verlag. p. 419–451.
Blencowe H, Calvert C, Lawn JE, Cousens S, Campbell OMR. 2016.
Measuring maternal, fetal and neonatal mortality: challenges and solu- tions. Best Practice and Research Clinical Obstetrics and Gynaecology 36:14–29.
de Bernis L, Kinney MV, Stones W, Ten Hoope-Bender P, Vivio D, Leisher SH, et al. 2016. Stillbirths: ending preventable deaths by 2030. Lancet (London, England) 387:703–716.
Figueras F, Gardosi J. 2011. Intrauterine growth restriction: new concepts in antenatal surveillance, diagnosis, and management. American Journal of Obstetrics & Gynecology 204:288–300.
Haavaldsen C, Samuelsen SO, Eskild A. 2013. Fetal death and placental weight/birthweight ratio: a population study. Acta Obstetricia Et Gynecologica Scandinavica 92:583–590.
Hafner E, Metzenbauer M, H€ofinger D, Munkel M, Gassner R, Schuchter K, et al. 2003. Placental growth from the first to the second trimester of pregnancy in SGA-foetuses and pre-eclamptic pregnancies compared to normal foetuses. Placenta 24:336–342.
Hasegawa J, Arakawa K, Nakamura M, Matsuoka R, Ichizuka K, Katsufumi O, et al. 2011. Analysis of placental centiles is useful to estimate cause of fetal growth restriction. Journal of Obstetrics and Gynaecology Research 11:1658–1665.
Heifetz SA. 1996. The umbilical cord: obstetrically important lesions.
Clinical Obstetrics and Gynecology 39:571–587.
Heinonen S, Taipale P, Saarikoski S. 2001. Weights of placentae from small-for-gestational age infants revisited. Placenta 22:399–404.
Hungarian Central Statistical Office. 2016. Statistical Yearbook of Hungary 2015. Budapest: Hungarian Central Statistical Office. p. 41–52.
Joubert K. 2000. Hungarian birth weight and length references based on the national live births data between 1990 and 1996. Hungarian Journal of Obstetrics and Gynaecology 63:155–163.
Korteweg F, Gordijn S, Timmer A, Erwich J, Bergman K, Bouman K, et al.
2006. The Tulip classification of perinatal mortality: introduction and multidisciplinary inter-rater agreement. BJOG: An International Journal of Obstetrics and Gynaecology 113:393–401.
Lao TT, Wong WM. 1996. Placental ratio and intrauterine growth retard- ation. British Journal of Obstetrics and Gynaecology 103:924–926.
Laurini R, Laurin J, Marsal K. 1994. Placental histology and fetal blood flow in intrauterine growth retardation. Acta Obstetricia Et Gynecologica Scandinavica 73:529–534.
Mayhew TM, Manwani R, Ohadike C, Wijesekara J, Baker PN. 2007. The placenta in pre-eclampsia and intrauterine growth restriction: Studies JOURNAL OF OBSTETRICS AND GYNAECOLOGY 79
on exchange surface areas, diffusion distances and villous membrane diffusive conductances. Placenta 28:233–238.
Mayhew TM, Ohadike C, Baker PN, Crocker IP, Mitchell C, Ong SS. 2003.
Stereological investigation of placental morphology in pregnancies complicated by pre-eclampsia with and without intrauterine growth restriction. Placenta 24:219–226.
Mayhew TM, Wijesekara J, Baker PN, Ong SS. 2004. Morphometric evi- dence that villous development and fetoplacental angiogenesis are compromised by intrauterine growth retardation but not by pre- eclampsia. Placenta 25:829–833.
Monk D, Moore GE. 2004. Intrauterine growth restriction-genetic causes and consequences. Seminars in Fetal and Neonatal Medicine 9:371–378.
Parast MM, Crum CP, Boyd TK. 2008. Placental histologic criteria for umbilical blood flow restriction in unexplained stillbirth. Human Pathology 39:948–953.
Salafia CM, Charles AK, Maas EM. 2006. Placenta and fetal growth restric- tion. Clinical Obstetrics and Gynecology 49:236–256.
Siebert JR. 2007. Perinatal, fetal and embryonic autopsy. In: Gilbert- Barness E, editor. Potter’s Pathology of the Fetus, Infant and Child.
2nd ed. Philadelphia: Elsevier. p. 695–740.
Smith GC. 2010. Predicting antepartum stillbirth. Clinical Obstetrics and Gynecology 53:597–606.
Strom-Roum EM, Haavaldsen C, Tanbo TG, Eskild A. 2013. Placental weight relative to birthweight in pregnancies with maternal diabetes mellitus.
Acta Obstetricia Et Gynecologica Scandinavica 92:783–789.