EDITORS Radek Nemec, Lucie Chytilova
COVER DESIGN Radek Nemec (title background graphic is a free vector art designed by Starline / Freepik and downloaded from the URL:
http://www.freepik.com/)
PUBLISHER VŠB – Technical University of Ostrava Faculty of Economics
Department of Systems Engineering PUBLICATIONYEAR 2019
NUMBER OF PAGES 425
@COPYRIGHT the author/authors of each paper
ISBN (on-line) 978-80-248-4306-3 ISBN (USB) 978-80-248-4305-6
ISSN 2570-5776
PAPER CITATION EXAMPLE:
Author, A. (2019). ‘Title of the paper’. In: Nemec, R. and Chytilova, L. (eds.) Proceedings of the 13th International Conference on Strategic Management and its Support by Information Systems 2019, May 21-22, 2019, Ostrava, Czech Republic, pp. x-y.
All papers published in the proceedings have been peer-reviewed by 2 independent reviewers.
Editors are not responsible for the grammar and language used in papers.
M EMBERS OF THE PROGRAMME COMMITTEE
CHAIR Jana Hančlová
VŠB – Technical University of Ostrava, Czech Republic
MEMBERS Ivan Brezina
University of Economics, Bratislava, Slovak Republic José María Caridad
University of Córdoba, Spain Petr Doucek
University of Economics, Prague, Czech Republic Jaroslav Janáček
University of Žilina, Slovak Republic Tomaž Kern
University of Maribor, Kranj, Slovenia Paweł Lula
Cracow University of Economics, Poland Dušan Marček
VŠB – Technical University of Ostrava, Czech Republic Tomáš Pitner
Masaryk University, Brno, Czech Republic
Robert Rankl
Baden-Württemberg Cooperative State University, Stuttgart, Germany
Mariann Veres-Somosi
University of Miskolc, Hungary
Milan Vlach
Kyoto College of Graduate Studies for Informatics, Japan
M EMBERS OF THE ORGANIZING COMMITTEE
CHAIR Lucie Chytilová
VŠB – Technical University of Ostrava, Czech Republic MEMBERS
Blanka Bazsová
VŠB – Technical University of Ostrava, Czech Republic Radek Němec
VŠB – Technical University of Ostrava, Czech Republic František Zapletal
VŠB – Technical University of Ostrava, Czech Republic
C
ONFERENCE WEBSITE http://www.ekf.vsb.cz/smsis/P REFACE
Two years have passed and, once again, we are here with our international meeting of academics and professionals – the conference on Strategic Management and its Support by Information Systems (SMSIS). This year, the conference is held for the 13th consecutive year and, again, we are glad for the support from the dean of the Faculty of Economics, VŠB – Technical University of Ostrava, prof. Zdeněk Zmeškal.
The first SMSIS conference has been held in 1995 and, to this day, it continues as a traditionally bi-annual platform for professional discussions and exchange of experiences between research teams from various countries and institutions around the world, namely from the Czech Republic, Hungary, Iran, Spain, Slovakia and the United Kingdom. The conference focuses on a relatively broad scale of topics that are associated with:
o strategic management,
o quantitative methods and their applications in management issues,
o trends and issues in information systems design, management and security, o and applications of new media and intelligent tools in the Digital Economy.
This year, several new hot topics are presented and discussed, namely, social dimension of strategic management, benchmarking in supply chain management, spatial econometrics, cybersecurity for industry 4.0, or artificial neural network and machine-learning with human- in-the-loop.
The SMSIS 2019 conference is organized in cooperation with the Czech Society for Systems Integration (CSSI) and three Czech universities: VŠB – Technical University of Ostrava (Faculty of Economics), University of Economics in Prague (Faculty of Informatics and Statistics) and Masaryk University in Brno (Faculty of Informatics).
The SMSIS conference proceedings usually contains about 50 carefully selected scholarly and professional papers, which are double-blind reviewed by members of the programme committee, who certainly deserve thanks for their devoted work. I would like to thank the members of the organizing committee as well, for their dedication and hard-work during the preparation and organization of the SMSIS 2019 conference event.
I wish all of us to be successful in the presentation of our work, our contributions to be beneficial to conference participants and that the event will meet everyone’s expectations.
To a successful conference!
Jana Hančlová May 2019
T ABLE OF C ONTENTS
K EYNOTE SPEECHES ( ABSTRACTS )
Industry 4.0 and its Impact on the Labour Market: an Opportunity or a Threat?
Jakub Fischer
pp. 12
Benchmarking in Supply Chain management Using Data Envelopment analysis
Adel Hatami-Marbini
pp. 13
Fitting disjunctive functions to the information retrieval and decision making tasks
Miroslav Hudec
pp. 14
R EGULAR PAPERS
S
ECTIONA
S
TRATEGIC MANAGEMENTTitle and authors pp. Paper #
Responsible Employment as a Strategic Issue Károly Balaton, Dóra Diána Horváth
16-24 6
A Central European approach to the typology of social enterprises Sándor Bozsik, Zoltán Musinszki, Judit Szemán
25-32 1
External Analysis for the Purpose of Strategic Decision-Making of Heating Company
Jakub Chlopecký, Ladislav Moravec, Roman Danel, Omar Ameir
33-41 7
Performance management features in the light of social innovation in the public sector
Daniella Kucsma
42-50 12
Investigating the Process of Social Innovation – A Social Learning Based Approach
Gabriella Metszosy
51-59 20
Comparison of supply-chain coordinating contract types Viktor Molnar, Tamas Faludi
60-67 35
The influence of reviews and new media reputation on film box office revenues
Antonín Pavlíček, Ladislav Luc
68-76 39
S
ECTIONB
Q
UANTITATIVEM
ETHODS INM
ANAGEMENTTitle and authors pp. Paper #
Efficiency of the Agrarian Sector in the NUTS II regions in V4 countries
Helena Brožová, Ivana Boháčková
78-86 2
Productivity and efficiency of automotive companies in the Czech Republic: a DEA approach
Jiří Franek, Ondřej Svoboda
87-98 47
Performance Evaluation of Printed Media in Online Social Media Using Data Envelopment Analysis
Hourieh Haghighinia, Mohsen Rostamy-Malkhalifeh
99-108 4
Estimating the effects of contextual variables on Spanish banks efficiency
Jana Hančlová, Lucie Chytilová, Lorena Caridad
109-115 46
Spatial Component in Regression Modelling of Unemployment in Czechia
Jiří Horák, Lucie Orlíková
116-130 5
Beta-convergence of the EU Regions, 2004-2014: the GWR Approach
Michaela Chocholatá
131-138 8
Multi-Level Stackelberg Game in Emergency Service System Reengineering
Jaroslav Janáček
139-146 9
Economic Evaluation of LTPD variable plans without memory Nikola Kaspříková
147-152 10
Comparison of two different approaches to capture volatility developments of gold returns
Stanislav Kováč
153-161 11
Optimization Model for the Personnel Scheduling Problem Martina Kuncová, Lucie Beranová
162-169 13
Identifying Factors Affecting Visitor Attendance in a City Building – Case Study of Brno Market
Martina Langhammerová, Vlastimil Reichel
170-178 14
The forecast of unemployment in Hungary and the role of social innovation in employment expansion
Katalin Lipták
179-186 15
Travel and Tourism Competitiveness Index 2017 – Quantile Regression Approach of Enabling Environment Pillars
Eva Litavcová, Petra Vašaničová, Sylvia Jenčová, Martina Košíková
187-195 16
How to evaluate the efficiency of projects in the context of business performance? Review of possible approaches and choice of relevant method
Lukáš Melecký, Michaela Staníčková
196-203 41
Application of AHP Method for Choosing of Suitable Airplane in Air Cargo Transport
Ivana Olivková, Lenka Kontriková
204-211 23
Node subset heuristic for non-split delivery VRP Jan Pelikán, Petr Štourač, Michal Černý
212-216 25
Return and Volatility Spillover Effects in Western European Stock Markets
Petr Seďa, Lorena Caridad López del Río
217-225 26
Evaluation of an (emergency) situation under uncertainty Michal Škoda, Helena Brožová
226-234 27
Efficiency of small and medium enterprises using Data Envelopment Analysis
Hana Štverková, Lucie Chytilová
235-241 48
Production efficiency under uncertainty using the PROMETHEE method
František Zapletal
242-249 29
S
ECTIONC
C
URRENTT
RENDS ANDI
SSUES INI
NFORMATIONS
YSTEMSD
ESIGN, M
ANAGEMENT ANDS
ECURITYTitle and authors pp. Paper #
A Comparison of the Efficiency of Czech Universities Blanka Bazsova
251-260 32
Outliers in regression modelling: Influential vs. non-influential values and detection using information criteria
José Carlos Casas-Rosal, Julia Núñez-Tabales, José María Caridad y Ocerin, Petr Seďa
261-272 33
A note on statistical computing with long data streams Michal Černý, Petr Štourač
273-279 3
Process Petri Nets with Time Stamps and Their Subnets Ivo Martiník
280-290 19
Comparison of Selected Aspects of DAX and SQL Vítězslav Novák
291-299 22
A comparison of technical efficiency between Spanish and Czech schools based on a stochastic meta-frontier production function
Petr Seďa, José Carlos Casas-Rosal, Rafaela Dios-Palomares, Carmen León-Mantero, Orlando Arencibia Montero, Juan Antonio Jimber del Río
300-309 34
Model of storage and shipping synchronisation in production warehouses
Dušan Teichmann, Michal Dorda, Denisa Mocková
310-317 37
Testing Approach Suitable for Big Data Jaroslav Zacek, Marek Malina
318-325 28
A Comparison of Selected Regions in the Czech Republic from Perspectives of Digitalization and Industry 4.0
Martina Žwaková
326-337 30
S
ECTIOND
A
PPLICATIONS OFN
EWM
EDIA ANDI
NTELLIGENTT
OOLS IN THED
IGITALE
CONOMY AND MODELLINGTitle and authors pp. Paper #
Non-stationary time series prediction based on empirical mode decomposition and artificial neural networks
Lun Gao, Huanyu Li
339-347 42
Stock Value and Currency Exchange Rate Prediction Using an Artificial Neural Network Trained By a Genetic Algorithm
Martin Maděra, Dušan Marček
348-357 17
Comparison of quantitative approaches for paper web break prediction
Jan Manďák
358-370 18
Applying the IoT in the Area of Determining the Locations of Persons and Equipment
Milos Maryska, Petr Doucek, Lea Nedomova
371-378 45
Information support of daily scrum meetings
Jan Ministr, Tomas Pitner, Roman Danel, Vyacheslav Chaplyha
379-385 36
Cybersecurity Qualifications for Industry 4.0 Era Jan Ministr, Tomáš Pitner, Nikola Šimková
386-393 44
SQL Query Similarity Using Graph-theoretic Approach Radek Němec, František Zapletal
394-401 40
Collecting and systematizing "smart solutions" for residential real estate, especially in Central and Eastern Europe, with special regard to the Visegrad countries
Daniel Orosz
402-409 24
Possibilities of ITIL and PCF Mapping Petr Rozehnal, Roman Danel
410-417 43
Word-Graph vs. Bag-of-Words Feature Extraction for Solving Author Identification Problem
Miloš Švaňa
418-425 38
S ECTION
B
Q UANTITATIVE M ETHODS IN M ANAGEMENT
- 77 -
The forecast of unemployment in Hungary and the role of social innovation in employment expansion
Katalin Lipták1
Abstract. The aim of the study is to analyse unemployment in the Hungarian labour market using the ARIMA (autoregressive-integrated-moving-average) model. According to my opinion, knowing the unemployment forecast is very useful and important for the decision makers and researchers. If the forecast is well known, the employment policies and directions can be formulated easier. I prepare a 12-month prognosis for the data of Hungarian unemployment (number of registered job-seekers). Such forecasts can be useful for decision makers and managers. Next, I introduce an example of social innovation at the settlement level. It is my belief that social innovation can be a good solution to the problem of unemployment. Any interpretation of social innovation so far can also be assigned the specific feature of employment expansion.
Keywords: unemployment, forecast, social innovation.
JEL Classification: C53, J21
1 Introduction
The forecast of unemployment is very important tool. The aim of my paper is to give new results of forecast of unemployment in Hungary (national level) and define what is the social innovation. Nowadays the unemployment rate is not so high in Hungary (3.7% in 2018), but some years ago (in 2010) it was 12% or higher (Central Statistical Office). The reasons for the decrease are a very strong employment policy and some new solutions in the public employment; it cannot be attributed, however, to the spread of atypical forms of employment.
The transition from the traditional employment model to a new model, requires a change in the attitude of labour market participants. In this situation, successful examples of social innovations play a key role; these can be observed in local development or in employment expansion. My hypothesis is that Hungary is performing less strongly in the area of labour market participation, because atypical employment is not widespread, and there is some social innovation, but not enough. More good examples and best practices are needed.
2 Methodology - the forecast of unemployment
We distinguish two types of time series: theoretical and empirical (observed) timelines.
Empirical time lines always contains a finite number of n-element members and contain observation error, while theoretical time lines in principle can be infinite and free of observation error (Hunyadi et al., 1997). The monthly unemployment data is suitable for stochastic time line analysis, as I wish to deal with the analysis of the short-term effects, primarily. The decomposition models include the most popular time line analysis methods. The principles of these time lines are that they consist of four well separated components (additive models as in the case of ARIMA):
1 Department of Labour Market and Employment Policy, Faculty of Economics, University of Miskolc, liptak.katalin@uni-miskolc.hu
- 179 -
) ( ) ( ) ( ) ( )
(t X t X t X t X t
Y T S C (1)
where:
Y(t) – the factual data of the examined time lines,
XT(t) – trend (permanently prevailing tendency, is a long-term basis tendency),
XS(t) – seasonal component (differing from the trend, the measure of a periodic fluctuation), XC(t) – cyclic component (the long-term fluctuation),
Xξ(t) – irregular component (stationery, Gauss – distribution random effect).
The application of the ARIMA (autoregressive-integrated-moving-average) model in the literature is known as Box-Jenkins methodology, which was first developed in the 1930s (Box and Jenkins, 1976). Auto-regression is a form of regression in which the dependent variable relates to its own different delayed values of the past instead of to other variables.
p t p t t
t φ Y φ Y ε
Y 1 1 (2)
where p indicates the order of auto-regression.
The moving average (MA) model expresses the current value of the time lines in the function of the present and past random variables. Thus the moving average means that the value of the timelines at a time t affects the current term and the weighted combination of the past error terms.
q t q t
t εt θ ε θ ε
Y 1 1 (3)
where q indicates the order of the moving average (Kehl and Sipos, 2011).
The model is stationary transformed with difference formation, called d-rate integral written to I(d) time series ARIMA model. We can give the ARIMA model’s dimensions in the following way: ARIMA (p, d, q) (Kehl and Sipos, 2011). ARIMA models in every case relate to linear contexts. The equation for estimating the explanatory variables of the result variable can be divided into two groups: the auto-regressive (AR) and the moving averaged (MA) model variables. In the case of the auto-regressive model the indicators are explained with its past values. If the value of maximum delay is p, thus the values are included at least p-term in the explanatory variables; we can talk about p-order AR model, and the sign of it: AR (p). For the analysis of the monthly unemployment data line, I use a so-called seasonal ARIMA model, whose general marking is: ARIMA (p, d, q) (P, D, Q)s. We mean under seasonal fluctuation the same wavelength and regular amplitude, repeated regularly with short-term fluctuations (Hunyadi et al., 1997). The starting point of modelling is to determine whether the desired timeline to be examined is stationary, and if it is not, whether it can be done to stationary with appropriate transformation. Stationary means temporal stability of the variables of the time lines, the expected values of certain variables, its variance, and the relationship variables belonging to different times expressing auto-covariance are constant in time (Rédey, 1991).
A stationary time line is the Y1, Y2, . . . , Yt, . . . , YT theoretical time line if:
- 180 -
μ ) (Y E
. t
1
2.Var (Yt)σ2
, , σ k
) ,Y (Y ρ Cov
. k t t k 12
3 2
where Cov(Yt,Ytk)E
(Yt μ)(Ytk μ)
andk t
t
2 , t tk
(4)
Stationary time lines do not contain trend effect, as the values of the time line fluctuate around an average level of constant with constant scattering. The constant scattering means that the intensity of fluctuations in time does not change (either increase or decrease) (Kehl and Sipos, 2011).
Determining the existing contexts between the consecutive observations means the description of the correlation structure of the time lines, which happens with calculation of the auto-correlation and partial auto-correlation coefficient method.
y y
k , ,...,Ky y y y
r n
t t k
n
t
k t t
k 12
1
2
1
(5)
The autocorrelation coefficients’ estimated values measure the tightness between the values of the time line delayed with time unit k and the linear correlation contact. The r1 means the consecutive relationship and r2 means the intensity of the relationship between the values being from each other in two time units. The coefficients in the function of delaying (k=1, 2, ..., K) form the autocorrelation function (ACF). The partial autocorrelation coefficients measures the tightness of the linear correlation contact between the k time unit delayed values of the time line in such way that the intermediate effect of 1, 2, ..., k-1 delays are filtered out. The coefficients form the partial autocorrelation function (PACF) in the function of retardation (k=i, 2, ..., K). The type of the stochastic process can be identified on the basis of ACF and PACF values of an experiential time line, which also appoints the model to be elected (Chatfield, 2004).
It is necessary to define what kind of ARMA model we could try and what the order of the auto-aggressively (p) and/or the moving average (q) would be. It can be defined on the basis of experimental or transformed ACF and PACF values. We call this phase of modelling identification. We have to examine the adequacy of matching so that the selected model characterizes the data well. Either Akaike information criteria (AIT) or the Bayes – criteria of the Schwartz-type – is suitable for testing, but the application of the two leads to misinformation, thus I apply the Akaike-type criterion.
σ p n
AIC(p) log p22 (6)
- 181 -
where n – the size of the sample; p – the number of the estimated parameters; - the size of residuum.
We choose the model where the value of the Akaike criterion is the smallest. After that, it is necessary to check that there is no auto-correlation between the residuum, which was carried out by the testing of the normality of error members (Maddala, 2004).
Many researchers use the ARIMA model, because this is a well-known estimation instrument. One of the main advantages of ARIMA models is that they perform quite well in forecasting based only on past observations of the series (Mayor Fernández et al., 2007).
According to Wilson and Perry (2004), the results of spectral analysis need to be compared with model forecasts other than ARIMA, given that the results of spectral analysis are indeed a worthy contender. Mayor Fernández et al. (2007) used the quarterly information provided by the Spanish Economically Active Population Survey, finding that a dynamic ARIMA model gave better results. Knudsen (2000) used shift-share analysis to get forecast results by regional level. According to Barnichon and Garda (2016), forecasting the unemployment rate is an important and difficult task for policymakers. Despite decades of research on the topic, policymakers often rely on simple time series models, such as ARIMA models, to forecast unemployment. The unemployment flow data underlying our approach have already been calculated for as many as 70 developed and developing countries (Viegelahn and Wieser, 2013).
3 The evaluation of the results – The empirical results of the forecasts for Hungary
For the forecast I took as a basis of the monthly data line of the registered number of the job seekers in the period January 2000–December 2018 for Hungary from the database of the National Employment Service.
Figure 1 The number of registered job-seekers in Hungary (January 2000–December 2018) [Own compilation]
0 100000 200000 300000 400000 500000 600000 700000 800000
01.2000 01. 2001 01.2002 01.2003 01.2004 01.2005 01.2006 01.2007 01.2008 01.2009 01.2010 01.2011 01.2012 01.2013 01.2014 01.2015 01.2016 01.2017 01.2018
- 182 -
I used Gretl software for the calculations. First I examined whether the data line of unemployment is stationary. The time line is not stationary on the basis of the smallest squares’
method (OLS), so I checked it with the Dickey-Fuller test. I examined the fitting with constant, constant and trend, and with constant, trend and square. The null hypothesis can be rejected at the level of 1% significance in all three cases, which means that the time line contains unity of root (Herman et al, 1994).
Because of the presence of the unit root, it is not possible to fit the ARIMA model to the time line, the time line has to be changed to a stationary time line. For transformation the seasonal differenced values of the data have to be accounted for (we call this differentiation:
the deviation happening in a discrete time). The time line in which first differences are stationary are called a first-order integrated I(1) time line. Then, I looked again at the results of the ADF test.
According to the ADF test, because of the low p-values there is no unit root in the time line (the delay is 1). The next step is choosing the right ARIMA model, for which we have to examine the correlogram. Just from the correlogram we cannot clearly define the exact model which will be used, thus ARIMA models have to be formed in which there is first-order differentiation, thus the model variants ARIMA (1,1,1) (1,1,1) 12, ARIMA (1,1,0) (1,1,0) 12 and the ARIMA (0,1,1) (0,1,1) 12 were constituted.
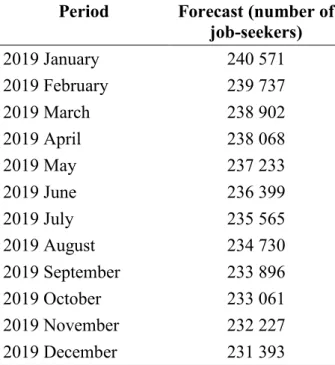
It is necessary to examine which of these models can be used best for forecasts. Among the known model selection procedures I compared the Akaike criteria (that model type is the best where the value is the smallest one). Based on this indicator the ARIMA (0,1,1) (0,1,1) 12 model can be applied. In order to be able to use the model for forecasts, we need to determine whether the error members are normally distributed or autocorrelated. As the correlogram shows a minimal autocorrelation, let us try a forecast with the ARIMA (0,1,1) (0,1,1) 12 model (Table 1).
Period Forecast (number of job-seekers)
2019 January 240 571
2019 February 239 737
2019 March 238 902
2019 April 238 068
2019 May 237 233
2019 June 236 399
2019 July 235 565
2019 August 234 730
2019 September 233 896
2019 October 233 061
2019 November 232 227
2019 December 231 393
Table 1 The values of the forecast at 95% reliability level to the data line
I demonstrated the results also graphically with the help of the software (Fig. 2).
- 183 -
Figure 2 The forecast of the number of registered job-seekers in Hungary [Own compilation]
It can be seen well that the number of registered job-seekers in Hungary shows a slight decrease for 2019. It is interesting that there is no seasonal fluctuation. Overall, the Hungarian processes point in a favourable direction, but the number of unemployed is high (230,000). We must solve this problem in the Hungarian labour market.
I made a further unemployment estimation using the ARIMA model by gender. The projected value shows that women are expected to have higher unemployment rates than men.
The main reason for this is that women with families are bound to a place and sometimes women with young children do not find easily a new job. It is necessary to seek the improvement of the women’s labour market participation, and the application of the active policy employment forms would be a great help for Hungarian women. Increasing the number of women working in part-time job or distance work is really justified, and is a primary help for mothers with young children. In my opinion, we can solve this problem of unemployment if we use social innovations. This is a new direction, but active employment policy instruments have not solved the high unemployment situation in Hungary. In the next paragraph I will show the different definitions of social innovation and an example.
4 The interpretation of social innovation and an example (innovative management approach in Nemesvámos )
The definition of social innovation in the literature is not yet uniform (Benedek et al, 2015;
Benedek et al, 2016; G.Fekete, 2015; Kocziszky et al, 2015; Kocziszky et al, 2017; Varga, 2017) at the same time all novel and innovative ideas to overcome existing social problems can be considered as social innovation.
- 184 -
I would like to introduce an example of social innovation in Hungary which led to employment expansion and decreased the high unemployment rate on a settlement level. The settlement of Nemesvámos is not far from Lake Balaton, and has a population of 2,500 people based on the latest census data. After the change of the regime (from 1989), there was a very high unemployment rate. After some years not only the successful grants had a big impact on the settlement, but multinational companies had also located in the region. Alcoa–Köfém Ltd.
is based in Székesfehérvár, and one of its sites can be found in Nemesvámos. It currently employs 1,700 people, of whom 120 employees work at the Nemesvámos site. In August 2000, a 23,000 m3HARIBO factory was built in a green field investment. In 2006, the two-shift work schedule was expanded to three shifts, with a workforce of 160 people. In almost four years, the factory increased its production volume six-fold and the number of employees tripled.
Nemesvámos has attracted more and more businesses, thanks to its favourable business environment and local government regulations, including free utilities transfer and the implementation of road construction without a company contribution. Initially, the local trade tax was only one or two thousandths, which over the years has been increased with the developmental rate of the enterprises.
Nemesvámos ascribes an important role to other development alongside the local economic development. During the local authorities emphasized it among other things that such implementations will be accomplished that residential source is not needed. As a result, the household savings can remain or can be increased, so local incomes can be spent locally. In 2010, a new mayor was elected. The biggest change was caused by the fact that the new mayor started his work with a management approach, he considered Nemesvámos as an enterprise.
This is a new point of view. Continuing the previous work, new ideas were formulated; the establishment and the maintenance of the financial independence of the village received a central role. Furthermore, there was a focus on creation and the retention of independent decision-making possibilities. Thanks to the local needs local products have emerged, enabling a local market to appear. Employment has started to grow. I think this is a good example of social innovation at the level of a settlement.
5 Conclusions and proposals
Since the development of a coordinated strategy for employment is one of the main goals of the European Union, the building of forecasts under alternative scenarios could be very useful. As we have seen above, forecasting unemployment is relatively easy to calculate, which gives good results for decision makers or managers. High unemployment is not a big problem at the national level in Hungary, but on micro-regional or settlement level it can be a major problem (due to the large regional differences). The limited labour catchment area is replaced by the cross-country international market. Due to the expanding labour market, career opportunities are broadening and the mobility of labour is increasing. Despite this, mothers with young children are at a disadvantage in the labour market because their mobility and career chances are worse than men’s. It appear that the social innovations are playing an increasingly important role in employment expansion, as for the minimizing of the existing problems. The active involvement of citizens and civil service organizations is also necessary.
- 185 -
Acknowledgement
This research was supported by the project no. EFOP-3.6.2-16-2017-00007, titled Aspects on the development of intelligent, sustainable and inclusive society: social, technological, innovation networks in employment and digital economy. The project has been supported by the European Union, co-financed by the European Social Fund and the budget of Hungary.
References
Barnichon, R. and Garda, P. (2016). ‘Forecasting unemployment across countries: The ins and outs’.
European Economic Review, 84 (1), pp. 165-183.
Benedek, J., Kocziszky, Gy. and Veresné Somosi, M. (2015). ‘Új innovációs paradigma? Regionális társadalmi innovációs potenciál javításának lehetősége szakértői rendszer segítségével, lehetőségek és korlátok’. Veresné Somosi, M. (ed.) Mérleg és Kihívások IX. Nemzetközi Tudományos Konferencia, Miskolc: Miskolci Egyetem Gazdaságtudományi Kar.
Benedek, J., Kocziszky, Gy., Veresné Somosi, M. and Balaton. K. (2016). ’Generating and Measuring Regional Social Innovation’. Theory Methodology Practice: Club of Economics in Miskolc, 12 (special issue), pp. 14-25.
Box, G. and G. Jenkins (1976). Time Series Analysis: Forecasting and Control. Revised Edition. San Francisco: Holden Day.
Chatfield, C. (2004). The Analysis of Time Series: An Introduction. Sixth Edition. London: Chapman and Hall.
G. Fekete É. (ed.) (2015): Társadalmi innovációk a felzárkóztatás szolgálatában: Dél-Cserehát - Nyitás a jövőre. Miskolc: Miskolci Egyetem Gazdaságtudományi Kar.
Herman, S., Pintér, J., Rappai, G. and Rédey, K. (1994). Statisztika II. Pécs: JPTE Kiadó.
Hunyadi, L., Mundruczó, G. and Vita, L. (1997). Statisztika. Budapest: Aula Kiadó.
Kehl, D. and Sipos, B. (2011). Excel parancsfájlok felhasználása a statisztikai elemzésekben. Pécs.
Knudsen D.C. (2000). ‘Shift-share analysis: further examination of models for the description of economic change’. Socio-Economic Planning Sciences, 34, pp. 177-198.
Kocziszky, Gy., Benedek, J., Veresné Somosi, M. and Balaton, K. (2015). ’Regionális társadalmi innováció generálása szakértői rendszer segítségével’. Észak-magyarországi Stratégiai Füzetek, 12 (2), pp. 4-22.
Kocziszky, Gy., Veresné Somosi, M. and Balaton, K. (2017). ’A társadalmi innováció vizsgálatának tapasztalatai és fejlesztési lehetősége’.Vezetéstudomány, 48 (6-7), pp. 15-19.
Maddala, G. (2004). Bevezetés az ökonometriába. Budapest: Nemzeti Tankönyvkiadó.
Mayor Fernández, M., López, A. J. and Pérez, R. (2007). ’Forecasting Regional Employment with Shift–
Share and ARIMA Modelling’. Regional Studies, 41 (4), pp. 543-551.
Rédey, K. (1991). Sztochasztikus idősori modellek (ARIMA modellek).OTKA tanulmány, p. 130 Varga, K. (2017). ’A regionális társadalmi innováció kérdése’. International Journal of Engineering
and Management Sciences, 2 (4), pp. 602-616.
Viegelahn, C. and Wieser, C. (2014). The ILO Estimates on Unemployment Flows. In: ILO (2014). Key Indicators of the Labour Market. Eighth edition. Geneva. pp. 21-27.
Wilson, P.G. and Perry L.J. (2004). ’Forecasting Australian Unemployment Rates Using Spectral Analysis’. Australian Journal of Labour Economics, 7 (4), pp. 459-480.
- 186 -
![Figure 1 The number of registered job-seekers in Hungary (January 2000–December 2018) [Own compilation]](https://thumb-eu.123doks.com/thumbv2/9dokorg/1330899.107654/16.892.131.764.715.1071/figure-number-registered-seekers-hungary-january-december-compilation.webp)
![Figure 2 The forecast of the number of registered job-seekers in Hungary [Own compilation]](https://thumb-eu.123doks.com/thumbv2/9dokorg/1330899.107654/18.892.167.737.108.545/figure-forecast-number-registered-job-seekers-hungary-compilation.webp)
