DOCTORAL (PhD) THESIS
UNIVERSITY OF WEST HUNGARY
FACULTY OF AGRICULTURAL AND FOOD SCIENCES Institute of Biosystems Engineering
Leader of the Doctoral School:
PROF. DR. MIKLÓS NEMÉNYI, CMHAS
Supervisors:
PROF. DR. MIKLÓS NEMÉNYI, CMHAS DR. GÁBOR MILICS PhD
DEVELOPING ELEMENTS OF PRECISION AGRICULTURE:
SPECIAL FOCUS ON THE SPECTROSCOPIC DETECTION OF FUSARIUM DAMAGE AND PROCESS CONTROLL OF
CHEMICAL DISTRIBUTION
Written by:
ISTVÁN VIRÁG
MOSONMAGYARÓVÁR 2014
2
1. RESEARCH AIMS
1. In the course of analysing ear rot of maize our primary aim was to find a wavelength range that could be use to clearly distinguish the healthy maize samples from the infected ones by using a spectrophotometer, based on optical fiber technology. Another important task was to carry out the conventional measurements (severity, weight, length). Our purpose was to determine damage caused by Fusarium species in the experimental plots and to select most appropriate ears for hyperspectral laboratory tests.
2. A fertilizer control system was tested with special focus on map based distribution. The main target was to determine role of the calibration factor and to observe sensitivity of the system against dose and working speed changes.
3. Patch spraying technology was tested with the following purpose: To get acquainted with reliability and accuracy of the automatic section control system using spraying plan or boundary information for spraying weed patches.
3
2. MATERIALS AND METHODS
2.1 Examination of ear rot
The examined genotypes (MV1, MV2) were sown in a small-plot experiment in the pathological nursery of the Agricultural Institute (CAR- HAS) with two replications. In the main plot were the genotypes, in the sub plot were the treatments. Four treatments were used: isolates of Fusarium verticillioides, F. culmorum, F. graminearum and untreated check. Six plants were artificially inoculated, using the toothpick method.
Before harvest six ears were collected from non-infected and artificially inoculated plots. After drying and labelling ear rot severity, length and weight of ears were measured.
In addition to these conventional measurements, the samples were also analysed at a wavelength range of 350–2500 nm using an ASD Fieldspec 3 MAX™ hyperspectral instrument (Figure 1/a.) in a special light-isolated cabinet at the Agricultural Engineering Institute of the Ministry of Rural Development. The non-destructive analysis of maize ears and shelled kernels was carried out using a Plant Probe™ (ASD) sensor (Figure 1/b.). Three ears were selected from each treatment. Five measurements were made on the ears. Shelled kernels were taken in a special black dish and measured five times.
For each measurement point an integrated mean spectrum was recorded, based on the results of twenty readings. The white reference measurement was repeated before each sample was measured.
4 Figure 1. The hyperspectral laboratory: light-isolated cabinet (a), Fieldspec 3
MAXTM instrument (b)
Evaluation of the hyperspectral measurements was done with ViewSpec Pro software. The raw data were converted into reflectance spectra, than splice correction was made. The five measurements for each ear were averaged, after which the first derivatives of the mean spectra were compared. Principal component analysis was made with Statistica software and analysis of conventional measurements was done with MS Excel.
2.2 Evaluation of site-specific fertilizer distribution 2.2.1 GIS
(
geographic information system) data processingFor testing the distribution process data recording system of the field computer was used based on a method developed by the Institute of Biosystems Engineering. The fertilization map was prepared with Ag Leader SMS software for 66 management zones.
a) b)
5 The necessary amounts of major nutrients (N, P, K) were determined by the economic and environmental-friendly, computer based fertilization advisory system (ProPlanta). The professional advice was made for maize (Dekalb 440 hybrid) for forage with a high expected yield (10 t/ha). Based on the determined amount of nitrogen agent, seven different fertilizer doses (430, 448, 467, 493, 511, 530, 578 kg/ha; CAN 27%) were used in the management zones.
A spinner disk applicator, Amazone ZA-M (Model 1201) with a working width of 27 m was used. During the distribution process the amount of fertilizer was controlled by Amatron+ terminal based on the map exported to the EDGE monitor.
Evaluation of the saved data was done using Arc GIS software. To the as-applied map layer, a boundary layer of management zones was added. The values of the recorded points were collected inside each area of the management zones. With statistical analysis function of Arc GIS software, means of the values inside every management zones were determined. The as-applied doses were compared to the prescribed doses using linear regression analysis.
2.2.2 Field experiments with focus on distributed quantity (2011)
In further examination of the application control system, the calibration factor applied by Amatron+ system was investigated. Three different nitrogen fertilizer (urea N 46%, ammonium nitrate N 34%, calcium ammonium nitrate (N 27%) were applied. A spinner disk applicator, Amazone ZA-M MaxTronic with a working width of 25 m was used. Automatic guidance system (Trimble AutopilotTM) was applied during the distribution process with EGNOS and RTK GPS corrections.
6 500, 700 or 1000 kg weight fertilizer packages were put into the spreader tank. Total amount of the package was distributed. During distribution process the Amatron+ interface measured the treated area in hectares.
In this way the weight of the fertilizer unit was divided by the treated area of the field. The weight stated on fertilizer bags was taken into account for the calculations because the manufacturer did not indicate any departure from the net mass on the packaging.
Testing calibration factor: Value of the calibration factor was modified in the test for more accurate application. The possibility of using empirical factors was investigated, too.
Testing factor affected by working speed: During the experiment, speed was changed from a given set and system’s ability to keep the preset target dose was tested. The investigated speed values were 8, 10 and 12 km/h.
Map-based application simulation: The first step of the simulation experiment was to adjust the calibration factor until the required fertilizer amount (435 kg/ha) was achieved. Then half of the original amount was added to the control panel (without changing value of calibration factor) to simulate big differences in dose during map-based distribution.
7 2.3 Spraying weed patches with the help of spraying control system Technical background and data preparation:
A Hardi Ranger 2500 sprayer connected to a Steyr 9078 tractor was used during the experiments with a working width of 18 m. The sprayer with four section frame was controlled by Ag Leader Insight terminal connected to DirectCommand control system. For section managing the „AutoSwath”
function was selected to carry out automatic operation. Automatic guidance system (Trimble AutopilotTM) with EGNOS GPS correction was applied in the course of spraying. Boundaries of the weed patches were recorded by Ag Leader SMS Mobile software. Ag Leader SMS Advanced software was used on the one hand to export recorded boundaries to the field computer and on the other hand to prepare and export spraying distribution map.
2.3.1 Map based post-emergent weed control on maize field
The selected 21,95 ha field was sprayed with Lumax (mezotrion, S- metolachlor, terbutilazin) for preemergence weed control. A few weeks after treatment in course of field scouting many irregular shaped weed patches (Cirsium arvense L.) were found. Based on the boundaries of weed patches a spraying map was generated with one meter resolution. This map was exported to Insight monitor using *.irx file format.
For chemical weed control Cambio (320 g/l bentazon, 90 g/l dikamba) herbicide was used against annual and perennial broad-leaved weeds with 2 l/ha dose in 250 l/ha water. Selectivity and efficacy was evaluated after one and two weeks.
8 2.3.2 Spraying grain stubble using vector based boundaries
Weed coverage of the field that was selected for the second experiment was more than 60% and weed populations were distributed heterogeneously.
In this way only imaginary boundaries were recorded to examine patch spraying technology. For testing the new method vector based boundaries were exported to Insight monitor in a special file format (*.iby). Clean water was used for spraying without any herbicide. The selected dose (300 l/ha) was given by hand in the field monitor.
3. RESULTS
3.1 Examination of ear rot
3.1.1 Results of conventional measurements
In case of MV1 genotype the weight of the ears decreased by 19,41%
and the length by 7,46% after infection with the F. culmorum isolate, with a severity value of 24,58%. Inoculation with the F. verticillioides isolate resulted in low severity for this genotype.
In case of MV2 genotype, all Fusarium treatments resulted significant damage compared to the untreated check. After infection with F.
graminearum weight of the ears decreased by 72,5%, with a severity value of 66,39%. Furthermore weight of the ears decreased by 42,91% and 27,38%
caused by F. culmorum and F. verticillioides treatments with high severity.
9 3.1.2 Results of hyperspectral laboratory measurements
3.1.2.1 Analyzing spectral data of maize ears
The greatest difference was observed in the 880–910 nm range where the spectra collected from the surface of samples exhibiting symptoms could be clearly distinguished from the mean spectra of symptomless samples in case of MV1 and MV2 genotype. Further analysis was performed using the reflectance values in this range.
Principal component analysis was used to provide a statistical confirmation of the differences observed in the selected wavelength range.
When entering the data required for the analysis, the mean spectra of every maize ear within the given spectrum range were taken as a variable.
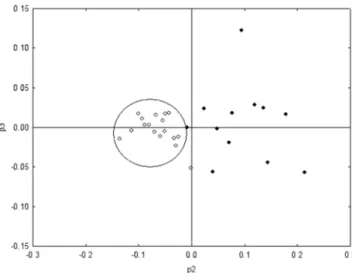
In the coordinate system set up by the second and the third principal components, spectra of samples with or without symptoms of infection are separated well (Figure 2. and 3.). The differences between the variables were determined by the second principal component.100% of the control samples are located in the negative range and 85,7% of the infected samples are in the positive range if spectra values of both genotypes are investigated together.
10 Figure 2. Spectrum values on a 2nd vs. 3rd principal component plot in MV1
genotype
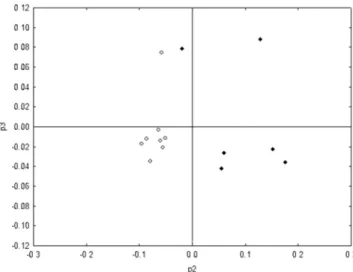
Figure 3. Spectrum values on a 2nd vs. 3rd principal component plot in MV2 genotype
Legend: ● spectrum values of infected ears
○ spectrum values of control ears
11 3.1.2.2 Analyzing spectral data of shelled kernel samples
The greatest difference was observed in the 880–910 nm range - similary to ear measurements - where the spectra collected from the surface of kernels exhibiting symptoms could be clearly distinguished from the mean spectra of symptomless samples in case of MV1 and MV2 genotype.
For principal component analysis, the mean spectra of shelled kernel groups within the given spectrum range were taken as a variable.
In the coordinate system set up by the second and the third principal components, spectra of samples with or without symptoms of infection are separated well, too (Figure 4. and 5.). The differences between the variables were determined by the second principal component.100% of the control samples are located in the negative range and 91,7% of the infected samples are in the positive range if spectra values of both genotypes are tested together.
Figure 4. Spectrum values on a 2nd vs. 3rd principal component plot in MV1 genotype
12 Figure 5. Spectrum values on a 2nd vs. 3rd principal component plot in MV2
genotype
Legend: ● spectrum values of infected kernel samples
○ spectrum values of control kernel samples
3.2 Results of precision fertilizer distribution
3.2.1 Evaluation with the help of geospatial processing software
The correlation between the data set of prescription map to the data set of as- applied map was determined. In areas of the management zones, there was a strong correlation (r= 0,93) between the as-applied and prescribed doses. This result was attributed to scattering that was attributed to a sluggish system response (when changing from low to high application doses). When the tramlines of the tractor were close to the neighbouring management zones, the distribution was done beyond the border of the actual management zone.
This is another important fact that affects the accuracy of the distribution work.
13 3.2.2 Field measurements
Testing calibration factor
After calibration test with ammonium nitrate, factor value 1,10 was suggested by control terminal. In the first distribution the amount was less than the target dose (471 kg/ha) with 20,55 kg/ha. The given value of the factor was decreased to 1,00 than 0,90. Instead of 471 kg/ha, 537 kg/ha ammonium nitrate was distributed. Changing factor with one-tenth resulted in a high degree of inaccuracy. Factor was set up to 0,98 than decreased until 0,96. In this way 467,89 kg/ha fertilizer was distributed by reducing the given factor with 0,14. The given and real working speed was 10 km/h for this experiment.
Changing working speed
The system’s adaptability to speed changes was studied during this experiment. Spring barley was treated with CAN (N 27%). After calibration test factor value 1,00 was suggested. With this settings 5,14 kg/ha extra fertilizer was distributed compared to target dose (148 kg/ha). With increasing the factor to 1,01 the target dose was reached within 1% error in two rounds (147,49 és 147,79 kg/ha). The given speed (10 km/h) was increased to 12 km/h in the fourth round. With this settings the difference was 7,18 kg/ha compared to target dose. Before next round 12 km/h was adjusted in the control panel. Result was 152,44 kg/ha. In next round working speed was decreased to 8 km/h without changing the settings. 26,21 kg/ha extra fertilizer was distributed by reducing the speed with 4 km/h. In the last five rounds of the experiment, factor was adjusted to 12 km/h settings. Target dose was achieved within 2% with factor value 1,02.
14 Simulating plan-based application
In the course of the third experiment urea (N 46%) was used with 435 kg/ha target dose. Working speed was 12 km/h. Factor value was adjusted to 0,70 based on the manual of Amatron+ monitor. In the first distribution 65 kg/ha extra fertilizer was applied. The factor was modified to 0,80 than 0,85 finally 0,88. With this value 438,68 kg/ha was achieved in average of four round. A strong linear correlation (r = 0,99) was found between the specified factor and the actual dose of fertilizer application. Raising the calibration factor with 0,01 resulted in a decrease of fertilizer with 3,48 kg/ha, based on the given equation. For the eight turn half of the target dose was adjusted in the control monitor. The half dose (218 kg/ha) was approached with extra 32 kg/ha without changing factor (0,88). With factor value 0,99 still 9,27 kg/ha difference was found. Also a strong linear correlation (r = 0,98) was observed between the specified factor and the actual dose of fertilizer application. In this way raising the factor with 0,01 resulted in a decrease of fertilizer with 2,05 kg/ha. Based on the given equation the required 218 kg/ha could have been reached with factor value 1,03.
Use of empirical factor
In this experiment possibility of using empirical factor was tested. The factor used in previous trial (0,88) was given to the monitor, the same fertilizer urea (N 46%) was used. Based on the differences observed in the first two rounds factor was reduced to 0,87. In the average of eight round 441,11 kg/ha distributed fertilizer was achieved with standard deviation value 4,37. This result is within 2% error compared to the target dose.
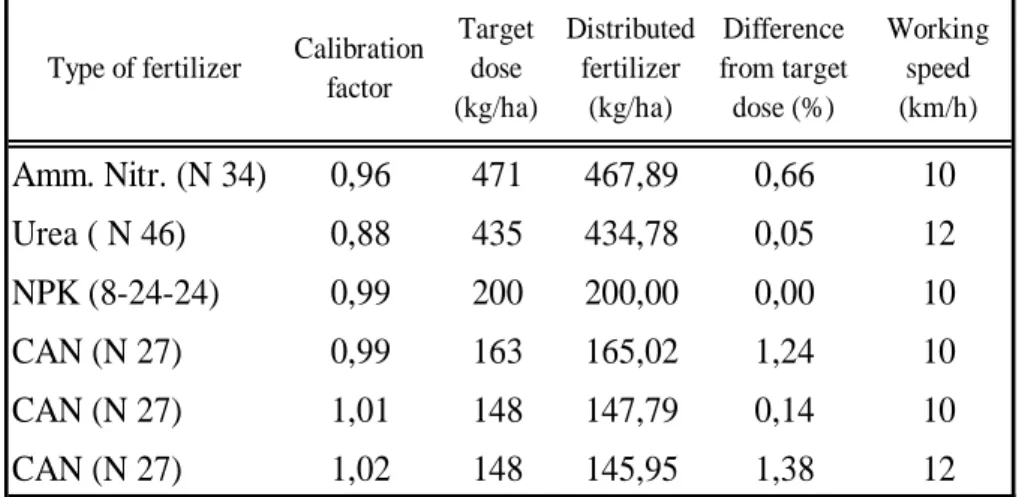
15 Summary: The best settings are summarised in table 1. which are within 2%
error compared to the target dose. Mostly the value of the calibration factor is around 1,00. This value could be a good starting point for new settings if the calibration test is not feasible. This table could be useful for users working with the same fertilizer control system.
Table 1. Summary of settings for fertilizer doses Type of fertilizer Calibration
factor
Target dose (kg/ha)
Distributed fertilizer
(kg/ha)
Difference from target dose (%)
Working speed (km/h)
Amm. Nitr. (N 34) 0,96 471 467,89 0,66 10
Urea ( N 46) 0,88 435 434,78 0,05 12
NPK (8-24-24) 0,99 200 200,00 0,00 10
CAN (N 27) 0,99 163 165,02 1,24 10
CAN (N 27) 1,01 148 147,79 0,14 10
CAN (N 27) 1,02 148 145,95 1,38 12
3.3 Spraying weed patches with the help of section control system 3.3.1 Post-emergent weed control using raster based spraying map
During raster based spraying the automatic swath control system was working only if the actual position of the sprayer was inside the weed patch.
The swath control system was not operating if the actual position of the application was outside the area of the weed patch even though some section of the sprayer was over the target area. The sections of the frame were closed by swath control system only when the sprayer reached a distributed area.
More herbicide was used compared to the plan and the expected working width decreased because of continual navigation towards the area of weed
16 patches. The preliminary contact effect could be observed already one week after treatment and systematic symptoms could be noticed after two weeks on weeds caused by active ingredients of herbicide. Based on the entire necrosis of shoot tip the efficacy of treatment was close to 100 percent.
3.3.2 Spraying grain stubble using vector based boundaries
In the course of vector based spraying method the automatic swath control system was working properly if the actual position of the sprayer was outside the weed patches but some section of the sprayer was over the target area.
Inside the boundary of weed patches swath control was also working well to eliminate the spraying of weed-free areas. In this case the required working width (18 m) could have been used during navigation. This method was more efficient and accurate compared to the technique that was examined during the first experiment. For small weed patches (110m2, 25m2) the average of spray volume was 30% less than the target dose. The sprayer was passing the small patches to fast so the control system was not able to reach the target dose.
Comparison of the two experiments:
In the first experiment the distributed area exceeded the total area of the weed patches with 33%. In the second experiment the spraying was carried out with reduced over application (21%) compared to the total weed patch area. In the second experiment the mean amount of the distributed spray exceeded the prescribed dose with only 0,99%. In the first experiment the mean distributed spray amount was less than the prescribed dose with 14,30%.
17
4. NEW SCIENTIFIC RESULTS (THESES)
1. I have determined that the spectral measurements carried out from 880 to 910 nm wavelength range are suitable for the separation of healthy and fusarium infected maize ears and shelled kernel samples.
2. I found that the spectral measurements carried out on shelled kernels give more reliable and accurate results to separate healthy and infected samples compared to the measured data of maize ears.
3. I have proved that changing the distributed fertilizer amount without adjusting the calibration factor leads to inaccurate application results.
Especially if significant change in dosage is needed or working speed is different from the original settings. I found that the examined control system is limitedly suitable for plan-based application.
4. I have proved that the investigated automatic swath control system is working properly with vector based boundary information if the actual position of the sprayer is outside the weed patches but some section of the sprayer is over the target area.
18
5. RESULTS FOR THE PRACTICAL USE
1. For resistance breeding against ear rot of maize the spectral measurements could give a hand for researchers, because separation of healthy and infected kernels was efficient in case of both genotypes (tolerant and susceptible).
2. I have summarised the best settings of the nutrient replenishment trials in one table, that contains the required value of the calibration factor and working speed for a given target dose.
3. I have described specific and detailed methodology about implementation of patch spraying. I have discussed all important process from the recording of weed patches through map preparing over all settings of the application monitor.
19
6. LIST OF PUBLICATIONS
Rewieved papers published in scientific journal
M. Csiba; A.J. Kovács; I. Virág; M. Neményi (2013): The most common errors of capacitance grain moisture sensors: effect of volume change during harvest. Precision Agriculture, 14:215-223. IF: 2,01
C. Szőke, I. Virág, D. K. Szalay, P. Bónis, L. Fenyvesi, L.C. Marton, M.
Neményi (2012): Investigation of Fusarium ear rot symptoms on maize (Zea mays L.) using a spectroradiometer. Journal of Agricultural Sciences, Debrecen 50:50-53
Csiba M.; Virág I.; Lócsi M.; Neményi M. (2011): A foltszerűen megjelenő gyomtársulásokra kidolgozott, helyspecifikus, vegyszeres gyomirtási technológia értékelése. Magyar Gyomkutatás és Technológia, 12 (2): 49-59.
I. Virág; D. K. Szalay; Cs. Szőke; G. Milics; L. Cs. Marton; M. Neményi (2011): Analysing symptoms of Fusarium ear rot on maize (Zea mays L.) using an ex situ hyperspectral examination method. Acta Agronomica Hungarica (ISSN: 0238-0161) 59 (3): 231-240.
Szőke Cs.; Virág I.; Magyar D.; Rácz F.; Marton L. Cs. (2011): Kukorica genotípusok fuzáriumos szárkorhadásának értékelése képelemző program és fertőzési indexszámítás segítségével. Agrártudományi Közlemények, Acta Agraria Debreceniensis (43):45-51
20 Full articles in proceedings
I. Virág; G. Milics; M. Neményi (2013): Investigation of Fusarium Ear Rot Symptoms on Maize (Zea Mays L.) Using a Spectroradiometer.In: Neményi Miklós, Varga László, Facskó Ferenc, Lőrincz Ildikó (szerk.) "Science for Sustainability" International Scientific Conference for PhD Students. 414 p.
Győr, Hungary, 2013.03.19-2013.03.20. Sopron: Nyugat-magyarországi Egyetem Kiadó, 2013. pp. 224-228. (ISBN:978 963 334 103 2)
G. Milics; N. Smuk; I. Virág; M. Neményi (2012): Precision agriculture – technical development for a sustainable agriculture. In: Neményi M, Heil B (Editors) The Impact of Urbanization, Industrial and Agricultural Technologies on the Natural Environment: International Scientific Conference on Sustainable Development and Ecological Footprint. 400 p.:
Sopron, Hungary, 2012.03.26-2012.03.27. Budapest: Nemzeti Tankönyvkiadó; Nyugat-magyarországi Egyetem, 2012. pp. 231-240.
(ISBN:978-963-19-7352-5)
Virág I.; Szőke Cs,; Szalay D. K.; Deákvári J.; Milics G.; Kovács A. J.;
Fenyvesi L.; Neményi M. (2012): A kukorica (Zea mays L.) csőfuzáriózisa által okozott tünetek vizsgálata spektroradiométer segítségével. In: Prof Varga László, Kovácsné Gaál Katalin CSc (Editors) XXXIV. Óvári Tudományos Nap: A Magyar Mezőgazdaság - Lehetőségek, Források, Új Gondolatok. (ISBN:978-963-9883-93-2): 36-41.
I. Virág; G. Kukorelli; B. Nagy; G. Milics; R. Schmidt (2012): Site-specific nitrogen fertilization developed for wheat (Triticum aestivum L.) with the help of OptRxTM sensor. 11th Alps-Adria Scientific Workshop. Smolenice, Slovakia, 2012. 03. 26-31. (Edited by: M. Harcsa) Növénytermelés, Vol. 61.
pp. 471-474.
M. Csiba; I. Virág; A. J. Kovács; M. Neményi (2012): Evaluation of the Map-based Chemical Weed Control Technology Applied for Weed Patches.
International Scientific Conference on Sustainable Development &
Ecological Footprint. March 26-27 2012,Sopron, Hungary.
21 G. Milics; J. Deákvári; P. Burai; Cs. Lénárt; I. Balla; M. Csiba; M. Farouk; I.
Virág; V. Nagy; M. Neményi (2011): Application of hyperspectral imaging in precision crop production and soil management. Pollution and water resources. Columbia University Seminar Proceedings (Edited by.: George J.
Halasi-Kun) Vol. XL. 2010-2011., pp. 139-149
I. Virág; M. Csiba; G. Milics; N. Smuk; M. Neményi (2011): Evaluation of Variable Rate Fertilization Technology with the help of geospatial processing programs. 8th European Conference on Precision Agriculture, 2011. 07. 11- 14., pp. 352-357
I. Virág; Cs. Szőke (2011): Field and laboratory examinations of corn plants by means of hyperspectral imaging technology. 10th Alps-Adria Scientific Workshop. Opatija, Croatia. 2011. 03. 14. – 19. Akadémia Kiadó, Edited by M. Harcsa, (Növénytermelés Vol. 60.) pp. 69-72.
G. Milics; I. Virág; M. Farouk M. A.; P. Burai; Cs. Lénárt (2010): Airborne hypersrectral imaging for data collection for resilient agro-ecosystems. 9 th Alps-Adria Scientific Workshop. Növénytermelés. Špičák, Czech Republic, 2010. 04. 12-17., Edited by M. Harcsa. Akadémiai Kiadó, Vol. 59., pp. 593- 596.
G. Milics, J. Deákvári, P. Burai, Cs. Lénárt, I. Balla, M. Csiba, M. Farouk, I.
Virág, V. Nagy, M. Neményi (2010): Hyperspectral remote sensing for precision crop production and soil management. International Conference on Agricultural Engineering (AgEng) Towards Environmental Technologies.
Clermont-Ferrand, France, 2010. 09. 6-8., pp. 1-9.
I. Virág; M. Csiba; G. Milics; N. Smuk; M. Farouk; M. Neményi (2010):
Efficiency of the variable rate fertilization technology in the aspects of agricultural practise. 18th International Poster Day and Institute of Hydrology Open Day. Transport of Water, Chemicals and and Energy in the Soil-Plant- Atmosphere System. Slovenská republika, Bratislava, 2010. 11. 11., (Edited by: A. Čelková) ISBN 978 80 89139 21 7, pp. 612-616.
22 M. Farouk; G. Milics; I. Virág; J. Deákvári; N. Smuk; K. Szalay; M.
Neményi (2010): Verifying hyperspectral reference via field measurements of ground control points. 18th International Poster Day and Institute of Hydrology Open Day. Transport of Water, Chemicals and Energy in the Soil- Plant-Atmosphere System. Slovenská republika, Bratislava, 2010. 11. 11., (Edited by: A. Čelková) ISBN 978 80 89139 21 7, pp. 97-102.
Virág I.; Csiba M.; Milics G.; Neményi M. (2010): A helyspecifikus tápanyag-kijuttatás eredményessége a gyakorlat szemszögéből. XXXIII.
Óvári Tudományos Nap. 2010. 10. 07. ; pp.1-5.
Abstracts in proceedings
Balla I.; Milics G.; Virág I.; Deákvári J.; Jolánkai M.; Fenyvesi L.; Neményi M. (2010): Helyspecifikus talajnedvesség és fajlagos vezetőképesség mérési technológiájának fejlesztése. MTA AMB XXXIV. Kutatási és fejlesztési Tanácskozás előadásainak és konzultációs témáinak összefoglalói. (Edited by: Tóth L., Magó L.) Gödöllő, 2010. február 2., pp. 42-43.
G. Milics; J. Deákvári; P. Burai; Cs. Lénárt; I. Balla; M. Csiba; M. Farouk; I.
Virág; V. Nagy; M. Neményi (2010): Hyperspectral remote sensing for precision crop production and soil management. International Conference on Agricultural Engineering (AgEng) Towards Environmental Technologies.
Book of Abstracts, Clermont-Ferrand, France, 2010. 09. 6-8., 288. p.
Papers published in popular magazines
Deákvári J.; Kovács L.; Szalay D. K.; Tolner I. T.; Csorba Á.; Milics G.;
Virág I.; Balla I.; Kardeván P.; Fenyvesi L. (2011): Parlagfű-detektálás hiperspektrális távérzékelési eszközökkel. Mezőgazdasági Technika.. 2011.
03. (52) pp. 2-5.