698 | wileyonlinelibrary.com/journal/jage J Agric Econ. 2021;72:698–711.
O R I G I N A L A R T I C L E
Dairy sector trade dynamics: Some insights on the evolution of trade linkages within the EU
Imre Fertő
1| Zoltán Bakucs
1| Jan Fałkowski
2This is an open access article under the terms of the Creative Commons Attribution License, which permits use, distribution and reproduction in any medium, provided the original work is properly cited.
© 2021 The Authors. Journal of Agricultural Economics published by John Wiley & Sons Ltd on behalf of Agricultural Economics Society.
1Centre for Economic and Regional Studies, Budapest, Hungary
2Faculty of Economic Sciences, University of Warsaw, Warszawa, Poland
Correspondence
Imre Fertő, Centre for Economic and Regional Studies, Budapest, Hungary.
Email: ferto.imre@krtk.mta.hu
Funding information
Nemzeti Kutatási Fejlesztési és Innovációs Hivatal, Grant/Award Number: 115788
Abstract
While the positive effect of economic integration on trade is commonly accepted, we still lack a proper understand- ing of the complex patterns behind this phenomenon. In particular, it is important to better understand how the structure of trade linkages evolves. To advance our knowl- edge about this matter, we test two specific predictions that originate from the recent literature on network effects in trade relations: (1) that the size of an initial trade network is positively correlated with building new trade linkages; (2) that the evolution of a trade network in a given country depends on the trade network of its trading partners. Using data related to intra- EU trade in dairy products between 2001 and 2015, we find support for both these predictions.
K E Y W O R D S
Dairy sector, duration of trade, intra- EU trade, network analysis, trade links
J E L C L A S S I F I C A T I O N C12; C35; F15
1 | I N TRODUCTION
The fact that economic integration increases trade flows between countries is now widely ac- knowledged (Baier & Bergstrand, 2007). The plentiful evidence of economically and statisti- cally significant effects of the European Union (EU) on trade among Member States illustrates this (Baier et al., 2008). That being said, the overall increase in trade flows that may be at- tributed to various forms of economic integration masks important and often subtle processes
of change in the structure of trade networks. Over time, new ties between countries can be established, whereas old links may develop or cease. Furthermore, specific links may gain in importance, while others may diminish.
This raises the issue of which key factors affect trade network development. As the recent literature convincingly argues (e.g. Antras et al., 2017; Bernard et al., 2015; Chaney, 2014; Rauch
& Trindade, 2002), countries that participate in economic integration agreements do not trade with each other on a random basis. On the contrary, it is likely that the development of trade linkages depends on specific characteristics and circumstances. Trade frictions, structural de- velopments in trade partners and informational barriers, in particular, seem likely to play a major role (see e.g. Rauch, 2001). Consequently, social and business networks are commonly perceived to significantly facilitate international exchange and affect trade structure. This sit- uation notwithstanding, how exactly these factors have an impact and how they translate into new trade linkages is still relatively unexplored in our literature.
We investigate the development of these linkages and reconstruct the trade network in the European dairy industry over the period 2001– 2015. In so doing, we seek to uncover to what extent building new trade connections between EU Member States depends on the pre- existing structure of the network. To the best of our knowledge, this paper is the first to use this ap- proach. While many studies have attempted to explain intra- EU bilateral agri- food trade flows (see, for example, Bojnec & Fertő, 2016; Fertő & Jámbor, 2015; Huchet- Bourdon & Chaptea, 2011), while others investigate the duration of trade relations between Member States (Bojnec
& Fertő, 2012), we are unaware of any other study that has estimated the effect of the network structure on the establishment of new trade linkages.1
The focus on EU dairy products is motivated by the importance of the dairy sector in EU agriculture. Milk is the EU’s most important single product sector in terms of value, ac- counting for roughly 15% of agricultural output.2 We focus on intra- EU trade because, first, the great majority of milk that is produced in Europe is consumed/traded within the EU.
According to the European Dairy Association, for cow's milk, the relevant share amounts to about 90% (EDA, 2014). Second, in recent decades we have observed a continuous increase in trade flows in dairy products between EU Member States. Interestingly, this concerns not only processed products, but also raw milk, which is typically considered a bulky and highly perishable product. Importantly, given our focus, this process has been marked not only by an increase in traded volume, but also by significant changes in the structure of the European dairy industry and associated trade network. In fact, over the last two decades the network has become a lot denser and, following the recent EU enlargements, the process of globalisa- tion, and the changes in the EU’s dairy quota system leading to its elimination, the number of trade connections between Member States has substantially increased (Benedek et al., 2017). As a result, intra- EU trade in dairy products provides a suitable test case for exploring the extent to which the evolution in trade linkages might be related to the structure of trade network.
The analysis of the evolution of trade network is of interest not only in itself, but is also salient from a policy perspective. As widely documented, the dairy products of many EU Member States are competitive on global markets (Bojnec & Fertő, 2014). European dairy exports are projected to grow over the next 10 years, and the European Union as a whole is expected to increase its export share of dairy commodities from 24% to 28% (OECD- FAO, 2017). In this context, an improved understanding of the structure of the trade network and its impacts might help to predict the development of new trade linkages and their consequences.
1This is not to say that agricultural trade has not been investigated with the help of a network approach (see, e.g., Gephart and Pace, 2015; or Benedek et al., 2017). To the best of our knowledge, however, no former studies have focused on the relationship between network structure and new trade linkages.
2According to Eurostat data, this share has been relatively stable over time.
The next section briefly discusses theoretical arguments that support the notion that the structure of trade networks may significantly affect how new trade connections are estab- lished. It also formulates two specific predictions based on theories about the dynamics of trade networks. In section 3 we present the data and empirical approach that we use to test these predictions in the context of the intra- EU dairy sector. Section 4 provides our results and section 5 concludes.
2 | BACKGROU N D DISCUS SION
The ongoing process of globalisation has substantially reshaped patterns of international trade in agro- food products (see e.g. Beghin et al., 2015; Bojnec & Ferto, 2016; Chevassus- Lozza et al., 2013; Curzi et al., 2015; Olper et al., 2017; Swinnen et al., 2015). On the one hand, recent years have seen an increase in overall trade flows. On the other hand, the greater participation of countries in the agro- food value chain has been observed. Agro- food trade within the EU (the focus of this paper) can serve as a very good illustration of this.
Studies which have tried to explain intra- EU agro- food trade have identified several factors that are likely to account for the exchange between EU Member States. Among other elements, attention has been paid to the impact of institutional differences between countries (Bojnec
& Fertő, 2014), and the establishment of the Eurozone (Huchet- Bourdon & Chaptea, 2011). In addition, the research focus has been on more standard determinants of trade (associated with gravity models), such as distance between trading countries, the size of markets, factor endow- ments, and product quality (Curzi & Olper, 2012; Fertő & Jámbor, 2015).
While these studies have considerably improved our knowledge about the evolution of agro- food trade within the EU, one important aspect of the related issue has not received sufficient emphasis in the literature. This is the role of network linkages in fostering the international exchange of agro- food products. Indeed, while insights from network theory have come to play an increasingly important role in more general literature about trade, the research on agro- food trade has not yet made much use of network theory.
This is quite surprising given the fact that trade is a naturally networked activity and in- ternational exchange is characterised by fundamental interdependencies. In fact, choices and behaviour in a given country (sector or firm in one country) depend, to a large extent, on the choices and behaviours made in other countries (sectors or firms in other countries). These interdependencies have become even more evident with the rise of global value chains, result- ing in increasing trade in intermediate inputs (rather than final goods) across several borders.
Johnson (2018) and Antras (2020), for example, suggest that these decisions about sourcing raw materials follow strategic selection. As shown in the new trade theory literature (e.g., Bernard et al., 2018), international trade is dominated by large firms (both on the export side and on the import side). Consequently, the evolution of international exchange depends, to a consid- erable extent, on the decisions made by these companies. The choices that they make reflect strategic interactions among them rather than simply their internal needs and characteristics.
This strongly suggests that trade linkages do not evolve randomly, but depend on the structure of existing connections. It also suggests that accounting for the latter may complement more conventional trade analyses which typically focus on the traditional gravity forces of distance and market potential.
Studies of trade network formation (see e.g. Antras et al., 2017; Bernard et al., 2015; Chaney, 2014; Chaney, 2016; Rauch, 2001; Rauch & Trindade, 2002) have sought to identify certain characteristics of trade networks that allow prediction of their development over time. Two particular predictions can be derived from this literature: (1) the number of trading partners that an actor has positively affects the creation of new trade relationships; (2) new export des- tinations are associated with existing trade linkages of current trading partners.
The economic rationale for these propositions is as follows. The first is based on the obser- vation that accessing foreign markets is characterised by economies of scale. Firms acquire information on how to expand and incur some fixed costs in undertaking this challenge (e.g.
reorganisation to create an export promotion office, or hire sales representatives who know foreign languages). Investing in foreign market entry therefore is likely to support further ex- pansion to new destinations. In addition, and relatedly, recent evidence suggests that firms tend to expand towards markets that are similar to their previous export destinations (Morales et al., 2019). This suggests that having a larger group of current trading partners increases the probability of finding a new market with characteristics that were already encountered else- where. Consequently, we expect a positive relationship between the number of current trading partners and the establishment of new trade relationships.
The second prediction also reflects the presumption that existing connections reduce the costs of establishing new connections (Chaney, 2014). The following argument can be used to support this view. Entering a new market incurs certain costs (finding local suppliers/customers, adjusting the packaging, labelling; modifying the product to meet different standards or better suit local tastes). When looking for information on the necessary adaptations and contacts to trade with, firms may either search at random or decide to take advantage of contacts of its ex- isting partners. The latter option is likely to be cheaper as the costs of acquiring information are typically higher than costs of transmitting the information once it is acquired. As a result, firms will find it easier to enter markets in which their current trading partners are already present.
We test these two predictions using data on intra- EU trade in dairy products over the period 2001– 2015. This not only gives us the opportunity to analyse the evolution of trade networks over 15 years, but captures two phases of EU enlargement (in 2004 and 2007), which allows us to investigate the apparent effects of enlargement.
Our paper is related to several strands of literature. On the one hand, it contributes to nu- merous studies that have explored various aspects of European agro- food trade (Sarker and Jayasinghe, 2007; Curzi et al., 2012; Bojnec & Fertő, 2015; Fertő et al., 2016; Olper et al., 2017).
Although these studies have significantly improved our knowledge about the factors affecting the volume of trade between EU Member States, they do not address the mechanisms that drive the evolution of the agro- food trade network.
Given this focus, our study is closely related to the growing literature that investigates fac- tors that drive the creation of new trade linkages, that is, the ‘extensive margin of trade’. Recent studies focusing on the agro- food sector include Scoppola et al., (2018), Curzi et al., (2020), and Raimondi et al., (2020). The focus of these works, however, is on the impact of preferential trade agreements, non- tariff measures or geographical indications and not on the potential role of trade network structure.
We also contribute to recent studies that have highlighted that many countries do not trade every year, nor in all products (Feenstra & Rose, 2000; Haveman & Hummels, 2004; Schott, 2004). These works have inspired research on the duration of international trade. The ex- isting research provides evidence that trade relationships are surprisingly short lived (e.g.
Besedeš, 2008; Besedeš & Prusa, 2006a, 2006b; Brenton et al., 2010; Nitsch, 2009; Obashi, 2010). Peterson et al., (2017) argue that this phenomenon can be explained by various factors, including firms testing export markets by entering and then exiting them after learning about the potential for profit, uncertainty regarding fixed- entry costs in export markets (Melitz, 2003), and demand- related conditions that cannot be resolved until after entry (Besedeš &
Prusa, 2011). Notwithstanding this research, the extent to which the related phenomenon can be explained by the structure of trade network has not been given closer scrutiny.
Finally, focusing on the role of network linkages in shaping the evolution of trade connec- tions, we contribute to the broader literature that adopts a network perspective for world trade patterns (e.g. Bhattacharya et al., 2008; De Benedictis & Tajoli, 2011; Fagiolo et al., 2013). What distinguishes our paper from these studies, however, is the fact that our focus is on the role that
network structures may play in the evolution of trade relationships, rather than on the statisti- cal properties of trade networks, or the way in which various network indices can improve our understanding of the volume of trade.
3 | DATA A N D M ET HODOLOGY
In our empirical analysis we make use of trade data from the World Integrated Trade Solution (WITS) that covers the period 2001– 2015, at a disaggregated level as possible. More specifi- cally, we use 20 dairy product categories which correspond to HS 6- digit level disaggregation (for exact definitions, see Table A1 in Appendix S1).3
We test whether the patterns of the establishment of new trade linkages in the EU dairy sector are related to existing trade network(s). Two specific hypotheses are tested:
H1: the size of the initial trade network is positively correlated with the building of new trade linkages.
H2: the evolution of a trade network for a given country depends on the trade network of its trading partners.
To test hypothesis H1 we need a dependent variable based on a measure of a new trade relation- ship. Although a new trade relationship may exist for only a short period (minimum one year), we are interested in the determinants of longer, ‘lasting’ trade relationships. Our benchmark defi- nition of a new trade relationship is a partnership of longer than three consecutive years. To test the robustness of our results, however, we also use an alternative definition which assumes that a new trade relationship must last for at least 5 years. As such, our approach tries to combine here the insights from the literature on both the extensive trade margin (which uses various indices to measure the number of trade connections) and the trade duration.
Our empirical estimation strategy is as follows. We first calculate trade spells4 (i.e. the span of the trade connection, measured in years). We also code dummy variables to identify rela- tionships that involve longer than 3- year spells. Note that, given the fact that our study covers 15 years, with this approach two partner countries trading the same dairy product may be en- tered into the binary regression more than once. Finally, we define our dependent variable Newrijkt, which is a binary variable that takes a value of ‘1’ if a new trade relationship is estab- lished between countries i and j in product category k at time t and is ‘0’ otherwise. To test H1, we estimate the following model (using logit estimators):
where i denotes a reporter country, j denotes a partner country, k denotes a product category and t denotes time. Our key explanatory variable in this model is the variable Doutikt, which is the ex- porter's out- degree centrality, calculated for a product category k, measured at the time the trade spell began. To calculate this variable, we employed the ‘most local network index, degree central- ity’ which gives the number of nodes (countries) connected directly to node i. Since our (binary) network is directed, the network out- degree (Doutikt) measure corresponds to the number of links
3Clearly, a more ideal situation would be to have firm- level data. That being said, we are not aware of any such datasets that focus on agro- food firms and permit the capture of network effects (not to mention the issue of the need to cover such a long period and embrace all economies within the European Union).
4Stset command in Stata.
(1) Newrijkt=𝛼 + 𝛽1Doutikt+𝛽2lndistij+𝛽3lndist2ij+𝛽4Euroijt+𝛽5Contigij+𝛾t+𝛿k+𝜆i+𝜑j+𝜀ijkt
or connections that originate from node i (Wasserman & Faust, 1994). For trade networks, the out- degree represents the number of trade partners to which a given country exports its products (De Benedictis & Tajoli, 2011).
Other covariates included in the model represent standard trade costs variables, that is, the distance between partner countries, a dummy variable indicating whether they use a common currency (here, euro) and a dummy variable indicating whether they have a common border. In order to capture the fact that trade costs may have a non- linear effect on the evolution of trade relationships, our model includes distance both as linear and squared terms. All our models control for time- fixed effects (capturing all the factors affecting all trading partners in a given year), as well as product- category- fixed effects (capturing all time- invariant factors that affect the trade in a given product). In addition, we always control for exporter and importer fixed effects so as to capture potential country- specific unobservable factors that may affect the way in which new trade relationships evolve.
Our second hypothesis, H2, proposes a positive relationship between the out- degree mea- sure for a selected country and the out- degree measure of its trading partners. Put differently, we expect that a given country will have more trade linkages the more trade connections its current partners have. In order to provide some insights on this relationship, we estimate the following model. The dependent variable in the model is defined as the (logged) reporter coun- try's out- degree centrality (lnDoutikt). It captures the number of trading relationships that the reporter country had in a given year and in a given product category. The key explanatory vari- able, in turn, focuses on connections of the reporter country's trading partners. To construct this measure, we proceed in three steps. First, for each reporter country, we identify a group of its trading partners in a given year and a given product category. Second, for each country in this group we identify an analogous group of this country's trading partners. Third, for each reporter country, we calculate key statistics that describe the number of trade connections of all its trading partners. Depending on a specification we use different measures and look at the median and the maximum number of trade connections that countries identified as trading partners of a selected reporter country have. When calculating these statistics, we use logged degree centrality measures. The specific model that we estimate to test H2 is the following:
where i denotes a reporter country, k refers to a specific product category, t refers to a specific year, and g denotes a group of i's trading partners. As before, the model includes different types of fixed effects, including exporter, time and product- category fixed effects. This assures that our estimates are not driven by some unobservable country- specific, time- specific and product- category- specific factors, respectively. Put differently, with these sets of dummy variables we can control for the omitted characteristics that are time- invariant (country fixed effects), refer to global tendencies (year fixed effects) and reflect key differences between various product- categories (product- category fixed effects). In order to address, at least in part, the fact that there may be omitted time- varying covariates, in some specifications we also control for the interaction between exporter and time fixed effects. This allows us to control for the time trends specific to a given country. In consequence, we can check if the relationship in question holds once we take into account that countries may have embarked on different paths along which they develop their participation in international exchange.
Clearly, although this approach has notable advantages, it shares many disadvantages of a standard panel analysis. In particular, our setup suffers from econometric problems related to both omitted variables bias (that are not captured by the different types of fixed effects which we use) and reverse causality. That said, it should be noted that the different types of fixed effects that we include in our models allow us to control for an extensive set of potential (2) lnDoutikt=𝛼 + 𝛽1lnDoutgkt+𝜆i+𝛾t+𝛿k+𝜀ikt
factors that are likely to affect the trading partner linkages (geographical location, historical connections, institutional aspects, the size of the market).
Because our dependent variable, measuring the number of trade connections, has both a lower and upper bound, we employ the flexible pseudo maximum likelihood estimator devel- oped by Santos Silva et al., (2014).5 To check the robustness of our findings, and also to obtain deeper insights on the issue in question, in addition to using the full sample, we also investi- gated the postulated hypotheses separately for Old Member States (OMS) – that is, countries joining the EU before 2004 – and New Member States (NMS), being those countries that joined the EU in 2004 or later.
4 | R E SU LTS
We start with a short overview of our key variable (Douti), which measures the number of trade relationships between EU Member States in dairy products covered by our data. Boxplots presented in Figures 1– 3 provide basic information about the distribution, skewness and outli- ers in the data. Figure 1, which refers to the EU as a whole, shows that the median value of out- degree increases over time: its value doubled between the starting and end periods. This reflects the increase in the number of trade relationships between EU Member States and implies that market integration in dairy products within the EU has grown during the period under analysis.
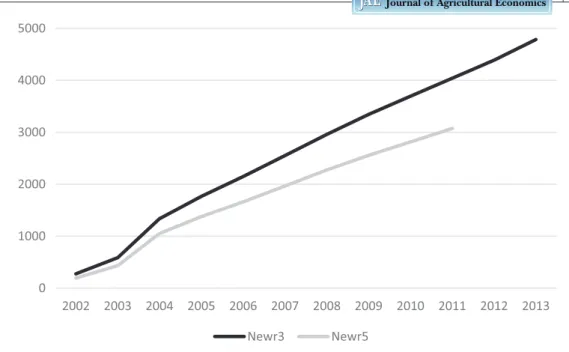
This is clearly depicted in Figure 2, which shows the cumulative number of new trade rela- tionships within the EU. As reported, the number of new trade relationships have continuously
5Flex command in STATA. We are grateful to an anonymous reviewer for this suggestion.
F I G U R E 1 The evolution of the number of trade relationships in dairy products (Douti) in the EU as a whole over the period 2001– 2015
Source: Authors’ calculations.
increased, and we observe this feature regardless of the threshold that we use to define a new trade relationship. In addition, the impact of EU enlargement in 2004 is clearly visible.
Figure 3 provides further details and looks at the evolution of trade linkages for each Member State separately. As shown, the median value out- degree ranges between 2 and 25.
The most networked countries are Germany, Italy, France, Poland and the Netherlands, the countries that are the largest dairy producers in the EU. The least networked countries, in turn, are Malta, Cyprus, Slovenia, Luxembourg and Romania. For most countries the dis- tributions are symmetric (e.g. Sweden, Ireland, UK, Belgium or France) or exhibit negative skewness (e.g. Germany Italy or Poland). An exception to that rule is Cyprus, for which we observe extreme positive skewness.
Table 1 shows that new trade relationships are not evenly distributed across the EU. The greatest proportion of new trade relationships (approximately 55%) were made between OMS and NMS. The smallest share (approximately 16%) involved new trade relationships between NMS. What should be noted is that this picture hardly changes when looking at 5- year spells instead of 3- year ones as the threshold. In addition, the reported statistics seem to suggest that during the period under study new trade relationships in the European dairy sector were initiated more often by OMS than by NMS. This fact is consistent with findings from earlier research which emphasised the different nature of OMS and NMS markets (e.g. Bojnec &
Fertő, 2012, 2014).
With this evidence, we now turn to our regression analysis. Our logit estimation results with respect to H1 are detailed in Table 2, which refers to the specification in which new trade rela- tionships are based on a 3- year spell as a threshold. In an Appendix S1 (Table A2) we show the results that refer to the 5- year spell threshold. The table is composed of two main panels. Each panel presents the results for the full sample (i.e., 27 Member States), for the sample composed of OMS only, and for the sample composed only of NMS, respectively. In the left- hand side panel, our key independent variable (Doutikt) is calculated for the same year as the dependent
F I G U R E 2 Cumulative number of new relationships (2002– 2013)
Notes: ‘Newr3’ captures the number of new relationships when the new relationship is defined as lasting for at least 3 consecutive years. ‘Newr5’ captures the number of new relationships when the new relationship is defined as lasting for at least 5 consecutive years.
Source: Authors’ calculations.
0 1000 2000 3000 4000 5000
2002 2003 2004 2005 2006 2007 2008 2009 2010 2011 2012 2013 Newr3 Newr5
variable. In the right- hand side panel, in turn, our model also includes the key independent variable lagged by one and two periods. This is done to better capture the long- run effect of the size of the initial trade network.6 Due to a very substantial correlation in our key explanatory variable at different lags, with the relevant coefficients ranging from 0.92 to 0.95, we are not able to get good enough estimates to exactly determine the effect at each lag. What follows is that we cannot tell whether the effect is contemporaneous or permanent. However, we can test the joint significance of all Doutikt variables (Wooldridge, 2012). We can also calculate the es- timate of the long- run effect and its significance. The relevant statistics are reported at the foot of the tables.
Most importantly, the coefficient for the key variable of interest, Doutikt, is highly significant and positive in all estimations, regardless of whether we look at the full sample or at the OMS/
NMS subsamples. Our results are also robust to the addition of lagged values of Doutikt mea- sure at time t − 1 and t − 2. As explained earlier, because of the pronounced multicollinearity
6We thank an anonymous referee for suggesting this to us.
F I G U R E 3 Out- degree distribution for each Member State as a whole over the period 2001– 2015 Note: dots represent outliers.
Source: Authors’ calculations.
TA B L E 1 Share of new trade relationships by market segment between 2001 and 2015 (%)
OMS- OMS NMS- NMS OMS- NMS NMS- OMS
Three years 28.5 16.1 31.0 24.4
Five years 28.7 16.4 32.4 22.5
Notes: OMS stands for Old Member States of the EU, and NMS for New Member States.
Source: Authors’ calculations.
these variables induce in the models, the sign and magnitude of the lagged coefficients is hard to interpret. However, the joint exclusion of these variables (see the lower part of the table) is soundly rejected. Please note also that the estimate of long- run propensity is always positive and highly significant (see the last row of the tables). Overall, therefore, these results confirm H1 and support the argument that the number of new trade relationships is positively related to the size of the initial trade network. Table A2 gives further credence to this supposition and shows that our results are robust to changing the definition of ‘new trade relationship’. What should also be noted is that the results we obtain seem to hold regardless of which sample we look at. Put differently, we find no difference between the behaviour of all EU member states, NMS and OMS. This might be seen as a further robustness test of our results, but also as an interesting finding on its own.
Our other covariates are consistent with intuition and other studies concerned with the ex- tensive trade margin. Establishing new trade relationships is more likely between countries that have a common boarder. For OMS we also find a positive effect of common currency. Distance, in turn, does not seem to affect OMS but does have some effect for NMS. While close and mod- erate proximity of potential trading partners seem to facilitate establishing new trade linkages, larger distances seem to be an impediment to NMS forming a new trading relationship.
With this evidence in hand, we now move to investigate hypothesis H2 (i.e., whether the size of the exporter's network depends on the size of partners’ network). The relevant results are shown in Table 3. Following Santos- Silva et al., (2014), flexible specifications were used to take into account both upper- and lower- bounds in our data. The top panel reports the results based on the full sample, the middle panel reports the results for the OMS subsample, while the bot- tom panel reports the results for the NMS subsample. The odd columns present the specifica- tions in which the key explanatory variable captures the median number of trade connections of a selected country's trading partners. The even columns refer to specifications in which the key explanatory variable measures the maximum number of such trade connections. The first
TA B L E 2 Results for H1 (new trade relations – minimum duration >3 years)
Full sample OMS NMS Full sample OMS NMS
Doutikt 0.11*** 0.11*** 0.10*** 0.19*** 0.21*** 0.16***
Doutikt−1 −0.11*** −0.16*** −0.08***
Doutikt−2 0.01* 0.02*** −0.00
lndistij 0.12 0.71 4.24*** 0.18 0.52 3.45***
lndistij2 −0.04 −0.06 −0.39*** −0.04 −0.05 −0.33***
Euroijt 0.08 0.40** 0.14 0.06 0.38* 0.11
Contigij 0.63*** 0.69*** 0.53*** 0.63*** 0.70*** 0.57***
Constant −1.66 −5.05 −12.88*** −1.72 −4.27 −10.64***
N 59988 14143 11208 53746 12742 10070
Chi2 2034.79 1010.78 1258.65 2768.33 1457.29 1204.74
Pseudo R2 0.16 0.14 0.21 0.20 0.19 0.23
Joint significance of Dout variables
Chi2(3) 1592*** 476*** 251***
Long- run propensity signif. (sum Dout variables)
LRP 0.08*** 0.08*** 0.07***
Notes: All estimations include exporter, importer, year, and product- group fixed effects, with clustered standard errors at country pair level. * Significant at the 0.1 level, ** Significant at the 0.05 level, *** Significant at the 0.01 level. Note that there is strong correlation between Doutikt variables ranging from 0.92 to 0.95. Hence, in the right- hand side panel, due to multicollinearity, we are not able to get good enough estimates to exactly determine the effect at each lag.
Source: Authors’ calculations.
two columns use – except the key variable of interest – exporter, time and product- category fixed effects. The models presented in columns (3)– (4), in turn, also include an interaction be- tween exporter and year fixed effects.
The key message from these estimates is that the coefficient for the variables capturing trade connections of a selected country's trading partners is positive and highly significant for all specifications. This suggests that the evolution of a trade network for a particular country is positively associated with the trade network of its trade partners. This is consistent with the hypothesis and indicates that the way in which general literature on trade describes the evolu- tion of trade networks seems to be suitable for describing what we can observe in the European dairy sector. Furthermore, we find this effect regardless of the sample that we look at. It might be noted, however, that the relevant coefficients are larger for NMS (bottom panel) than for OMS (middle panel), which is likely to reflect the fact that the latter countries have already had stronger linkages with other EU Member States and were better positioned in the European dairy trade network.
As a further robustness check, we also experimented with alternative measures of the extent to which trading partners of a selected country are connected with each other. More specifi- cally, we looked at the mean number of their trade connections, the number of trade linkages of the most important partner (in terms of trade value), or the clustering coefficient of the re- porter country's trade network. All these exercises (not reported) confirmed a positive and statistically significant relationship between the number of a selected country's trade linkages and the trade connections of its trading partners.7 While the caveats mentioned above should
7These results are not reported for reasons of brevity but can be obtained from the authors upon the request.
TA B L E 3 Results for H2, dependent variable log of Douti
(1) 2) (3) (4)
Full sample
median_lnoutdegreep 0.54*** 0.34***
max_lnoutdegreep 1.52*** 2.30***
Constant 0.55*** −2.68*** 0.78*** −4.67***
Observations 138,440 138,440 138,403 138,403
R- squared 0.64 0.64 0.71 0.71
OMS subsample
median_lnoutdegreep 0.22*** 0.07*
max_lnoutdegreep 0.413*** 0.46***
Constant 0.32*** −0.45*** 0.08 −0.98***
Observations 89,902 89,902 89,902 89,902
R- squared 0.65 0.65 0.67 0.68
NMS subsample
median_lnoutdegreep 0.86*** 0.79***
max_lnoutdegreep 2.19*** 3.20***
Constant −3.89*** −7.98*** −5.98*** −12.75***
Observations 48,538 48,538 48,501 48,501
R- squared 0.60 0.61 0.73 0.75
Notes: All estimations include exporter, importer, year and product- category fixed effects, with robust standard errors, Specifications in columns (3) and (4) additionally include the interaction between exporter and year fixed effects. * Significant at the 0.1 level, *** Significant at the 0.01 level.
Source: Authors’ calculations.
be kept in mind, these findings clearly show that the conditional correlation between the exam- ined phenomena is very robust.
5 | CONCLUSIONS
While there is an extensive literature devoted to investigating trade in agro- food products, our knowledge about the evolution of trade structures and the nature of trade networks is still rela- tively poor. Most studies focus on explaining the volume of trade, while the formation of trade linkages between countries is much less understood. In this paper we have tried to fill this gap at least in part. To the best of our knowledge, this paper is the first to look at agro- food trade incorporating recent advances from the literature about international trade networks. Our focus is on intra- EU trade in dairy products over the period 2001– 2015.
Our results should be treated with caution as our empirical setup is not free from economet- ric problems related to both omitted variable bias and reverse causality. That said, it should be noted that they uniformly point to the fact that the network features of intra- EU trade in dairy products should be given more attention and may significantly improve our understanding of which trade linkages can be observed, and why. Our analysis provides support for two predic- tions from established models of international trade. First, our results suggest that the creation of a new trade relationship is more likely for countries with more trading partners. Second, our evidence is consistent with the hypothesis that building new relationships and/or maintaining existing links (i.e. the duration of trade) is positively correlated with the location of the dairy exporter within the network. More specifically, we observe that any given country has a more central position in the trade network (measured by the number of connections it has), the more central position its current trading partners have.
Our results have several potential policy implications. For example, our analysis seems to imply that reducing trade barriers in country A may have important consequences for third countries with which country A already has established trade relationships. This is because when country B is incentivised to start trading with country A (due to reduced trade costs) it may also wish to establish trade relationships with third countries who are trade partners of country A even if there is no formal reduction in trade barriers in these third countries. In addition, our research can be useful for improving our understanding of the way in which var- ious shocks (be it positive or negative) are transmitted through international exchange. Having a better knowledge of trade network evolution allows more accurate predictions of when and how a given shock may propagate from one country to another. This relates to both shocks that are policy- driven (i.e. introduced by a certain governmental intervention) as well as exogenous shocks related, for instance, to health issues (e.g. COVID- 19) or natural disaster (e.g. an earth- quake). This clearly suggests potential research areas that can build on the basic explorations that we provide in this paper. Testing the investigated relationships in a broader context (i.e., not limited to intra- EU trade) provides another possible extension.
AC K NOW LEDGEM EN T
The authors would like to thank two anonymous reviewers and the Editor, David Harvey, for their constructive comments on an earlier draft. This research was supported by the Hungarian Academy of Sciences – Polish Academy of Sciences Researcher Exchange Visit Programme and the the project: NKFI- 115788 ‘Economic crises and international agricultural trade’.
R E F E R E NC E S
Antras, P. (2020) Conceptual aspects of gobal value chains, World Bank Economic Review, forthcoming, https://doi.
org/10.1093/wber/lhaa006
Antras, P., Fort, T. and Tintelnot, F. (2017) The margins of global sourcing: Theory and evidence from U.S. firms, American Economic Review, 107 (9), 2514– 2564.
Baier, S. and Bergstrand, J. (2007) Do free trade agreements actually increase members’ international trade?, Journal of International Economics, 71 (1), 72– 95.
Baier, S., Bergstrand, J., Egger, P. and McLaughlin, P.A. (2008) Do economic integration agreements actually work?
Issues in understanding the causes and consequences of the growth of regionalism, The World Economy, 31 (4), 462– 497.
Beghin, J.C., Maertens, M. and Swinnen, J. (2015) Nontariff measures and standards in trade and global value chains, Annual Review of Resource Economics, 7 (1), 425– 450.
Benedek, Z.s., Bakucs, Z., Fałkowski, J. and Fertő, I. (2017) Intra- European Union trade of dairy products: insights from network analysis, Studies in Agricultural Economics, 119 (2), 91– 97.
Bernard, A., Grazzi, M. and Tomasi, C. (2015) Intermediaries in international trade. Products and destinations, Review of Economics and Statistics, 97 (4), 916– 920.
Bernard, A., Jensen, J.B., Redding, S.J. and Schott, P.K. (2018) Global Firms, Journal of Economic Literature, 56 (2), 565– 619.
Besedeš, T. (2008) A search cost perspective on formation and duration of trade, Review of International Economics, 16 (5), 835– 849.
Besedeš, T. and Prusa, T.J. (2006a) Ins, outs and the duration of trade, Canadian Journal of Economics, 39 (1), 266– 295.
Besedeš, T. and Prusa, T.J. (2006b) Product differentiation and duration of U.S. import trade, Journal of International Economics, 70 (2), 339– 358.
Besedeš, T. and Prusa, T.J. (2011) The role of extensive and intensive margins and export growth, Journal of Development Economics, 96 (2), 371– 379.
Bhattacharya, K., Mukherjee, G., Saramäki, J., Kaski, K. and Manna, S.S. (2008) The international trade network:
weighted network analysis and modelling, Journal of Statistical Mechanics: Theory and Experiment, 2008 (02), 1– 5.
Bojnec, Š. and Fertő, I. (2012) Does EU enlargement increase agro- food export duration?, World Economy, 35, 609– 631.
Bojnec, Š. and Fertő, I. (2014) Export competitiveness of dairy products on global markets: The case of the European Union countries, Journal of Dairy Science, 97 (10), 6151– 6163.
Bojnec, Š. and Fertő, I. (2015) Does enlargement has caused intra and extra European Union agri- food trade?, Bulgarian Journal of Agricultural Sciences, 21 (1), 1– 15.
Bojnec, Š. and Fertő, I. (2016) Patterns and drivers of the agri- food intra- industry trade of European Union coun- tries, International Food and Agribusiness Review, 19 (2), 53– 73.
Brenton, P., Saborowski, C. and von Uexküll, E. (2010) What explains the low survival rate of developing country export flows, The World Bank Economic Review, 24 (3), 474– 499.
Chaney, T. (2014) The network structure of international trade, American Economic Review, 104 (11), 3600– 3634.
Chaney, T. (2016) Networks in International Trade. In Y. Bramoullé, A. Galeotti and B. Rogers, (eds,) Oxford Handbook of the Economics of Networks, Oxford, Oxford University Press, pp 754– 775.
Chevassus- Lozza, E., Gaigné, C. and Le Mener, L. (2013) Does input trade liberalization boost downstream firms’
exports? Theory and firm- level evidence, Journal of International Economics, 90 (2), 391– 402.
Curzi, D. and Olper, A. (2012) Export behavior of Italian food firms: Does product quality matter?, Food Policy, 37, 493– 503.
Curzi, D., Raimondi, V. and Olper, A. (2015) Quality upgrading, competition and trade policy: Evidence from the agri- food sector, European Review of Agricultural Economics, 42 (2), 239– 267.
Curzi, D., Schuster, M., Maertens, M. and Olper, A. (2020) Standards, trade margins and product quality: Firm- level evidence from Peru, Food Policy, forthcoming, https://doi.org/10.1016/j.foodp ol.2020.101834
De Benedictis, L. and Tajoli, L. (2011) The world trade network, World Economy, 34 (8), 1417– 1454.
Economic Report, E.D.A. (2014) Economic Report 2014, Belgium: European Dairy Association.
Fagiolo, G., Squartini, T. and Garlaschelli, D. (2013) Null models of economic networks: the case of the world trade web, Journal of Economic Interaction and Coordination, 8 (1), 75– 107.
Feenstra, R.C. and Rose, A.K. (2000) Putting things in order: Trade dynamics and product cycles, Review of Economics and Statistics, 82 (3), 369– 382.
Fertő, I. and Jámbor, A. (2015) Drivers of vertical intra- industry trade: the case of the Hungarian agri- food sector, Agricultural Economics, 46 (1), 113– 123.
Fertő, I., Podruzsik, S.z. and Balogh, J. (2016) Intra- industry trade in the wine sector in the enlarged European Union, Review of Agricultural, Food and Environmental Studies, 97 (3), 159– 172.
Gephart, J.A. and Pace, M.L. (2015). Structure and evolution of the global seafood trade network, Environmental Research Letters, 10, (2015) article id. 125014.
Haveman, J. and Hummels, D. (2004) Alternative hypotheses and the volume of trade: the gravity equation and the extent of specialization, Canadian Journal of Economics, 37 (1), 199– 218.
Huchet- Bourdon, M. and Cheptea, A. (2011) Informal barriers and agricultural trade: does monetary integration matter?, Agricultural Economics, 42 (4), 519– 530.
Johnson, R.C. (2018) Measuring global value chains, Annual Review of Economics, 10, 210– 236.
Melitz, M. (2003) The impact of trade on intra- industry reallocations and aggregate industry productivity, Econometrica, 71 (6), 1695– 1725.
Morales, E., Sheu, G. and Zahler, A. (2019) Extended gravity, Review of Economic Studies, 86, 2668– 2712.
Nitsch, V. (2009) Die another day: Duration in German import trade, Review of World Economics, 145 (1), 133– 154.
Obashi, A. (2010) Stability of production networks in East Asia: Duration and survival of trade, Japan and the World Economy, 22 (1), 21– 30.
OECD- FAO. (2017) OECD- FAO Agricultural Outlook 2017- 2026. Paris: OECD Publishing.
Olper, A., Curzi, D. and Raimondi, V. (2017) Imported Intermediate Inputs and Firms, Productivity Growth:
Evidence from the Food Industry, Journal of Agricultural Economics, 68 (1), 280– 300.
Peterson, E.B., Grant, H.J. and Rudi- Polloshka, J. (2017) Survival of the fittest: export duration and failure into United States fresh fruit and vegetable markets, American Journal of Agricultural Economics, 100 (1), 23– 45.
Raimondi, V., Falco, C., Curzi, D. and Olper, A. (2020) Trade effects of geographical indication policy: The EU case, Journal of Agricultural Economics, 71 (3), 330– 356.
Rauch, J. (2001) Business and Social Networks in International Trade, Journal of Economic Literature, 39 (2001), 1177– 1203.
Rauch, J. and Trindade, V. (2002) ‘Ethnic Chinese networks in international trade’, Review of Economics and Statistics, 84 (1), 116– 130.
Santos- Silva, J.M.C., Tenreyro, S. and Wei, K. (2014) Estimating the Extensive Margin of Trade, Journal of International Economics, 93 (1), 67– 75.
Schott, P.K. (2004) Across- product versus within- product specialization in international trade, Quarterly Journal of Economics, 119 (2), 647– 678.
Scoppola, M., Raimondi, V. and Olper, A. (2018) The Impact of EU Trade Preferences on the Extensive and Intensive Margins of Agricultural and Food Products, Agricultural Economics, 49 (2), 251– 263.
Swinnen, J., Maertens, M. and Colen, L. (2015) The Role of Food Standards in Trade and Development, Food Safety, Market Organization, Trade and Development, Springer International Publishing, pp 133– 149.
Wasserman, S. and Faust, K. (1994) Social network analysis: Methods and applications, New York and Cambridge:
Cambridge University Press.
Wooldridge, J.M. (2012) Introductory Econometrics. A Modern Approach, 5th edn, Cengage Learning.
SU PPORT I NG I N FOR M AT ION
Additional supporting information may be found online in the Supporting Information section.
How to cite this article: Fertő I, Bakucs Z, Fałkowski J. Dairy sector trade dynamics:
Some insights on the evolution of trade linkages within the EU. J Agric Econ.
2021;72:698–711. https://doi.org/10.1111/1477-9552.12429